
Abstract
Different numerical techniques have been used in the last decades for the acoustic characterization and performance optimization of sound diffusive surfaces. However, these methods require very long calculation times and do not provide a rapid feedback. As a result, these methods can hardly be applied by designers at early stages of the design process, when successive design iterations are necessary from an aesthetic point of view. A suitable alternative could be the use of parametric modeling in combination with performance investigations during the design process of sound diffusive surfaces. To this aim, this study presents a design process for diffusive surfaces topology optimization based on the combination of parametric models and geometrical acoustic simulations. It aims to provide architects and designers with rapid visual feedback on acoustic performances at a preliminary stage of the design process. The method has been tested on different case studies, which have been modelled based on geometric guidelines for diffusive surface optimization. The sensitivity of the method showed that it could be a very useful tool for comparisons among surface design alternatives. Finally, the advantages and limitations of the integrated optimization in comparison with conventional optimizations are discussed.
Introduction
The sound waves reflected by diffusive surfaces have been analyzed by different theoretical models,1–5 which are usually based on finite element (FEM), boundary element (BEM) or finite difference time domain (FDTD) methods. At the present state-of-the art, such models require long calculation times and can hardly provide the operator with an immediate performance feedback. Due to these limitations, generally designers and architects are not actively involved in the acoustic performance assessment of the diffusive surfaces they design. The design of the diffusive surface and its acoustic evaluation are two rather independent processes, with few exchanges between the professionals of the two disciplines. However, both aesthetic and acoustic performances are crucial to diffusive surface design, as the overlooking of one of them may hamper the achievement of a successful solution in overall terms. Moreover, this could have important effects on the perceptual experience of listeners.5–8 Designers need to gather pertinent acoustic performance information, to make informed design choices since the early design phases. 9 Although the ISO 17497 Standard,10,11 which proposes measurement methods for scattering and diffusion coefficients, was published more than a decade ago, further effort is needed to increase the designers’ awareness of acoustic performances during the design process. In this frame, the support of simple design rules and approaches could help to achieve optimized architectural solutions.
While acoustic performance has been established as a key design factor of the built environment, it has started to be included among the performance criteria in design optimization processes only recently. 12 As highlighted already in 1941 by Maa, 13 long before the use of computers for room acoustic simulations, practitioners prefer geometrical acoustic (GA) solutions, which are seen as more intuitive in solving most of the practical problems avoiding the impractical complexity of the physical acoustics. Given the current availability of computational power, the physical methods remain impractical for the design needs at an early stage of the design process. It is important to note that the integration of geometric acoustic based performance evaluation tool within the modeling could help designers to gather useful performance data since the conceptual stages of the design workflow.14–16 This integrated approach may offer great opportunity to control and optimize the manufacturing process. Nowadays, advanced manufacturing technologies allow for the production of highly complex surfaces. Some examples of the application of 3D printers, CNC milling machines, and industrial robots to produce complex structures can be found in recent studies.16–19 In Reinhardt et al., 19 the design exploration of acoustically-efficient sound diffusive patterns has been investigated by combining computational design with a prototyping technique based on robotic fabrication. Rapid prototyping has also been applied in Peters and Olesen, 16 to ease the fabrication of samples of scattering surfaces based on a pattern of hexagonal elements, which featured varied depths and widths. The performance of the different samples was measured then according to ISO 17497-1. 10 The data obtained was fed to the computational design tool to generate further design solutions with predicted sound scattering performances. Moreover, visual explorations based on a process of architectural and acoustic tuning 12 suggest the deployment of robots to evaluate the designs of diffusive surfaces and directly react on the measured results during the fabrication process by modifying the surface shape. In Shtrepi 20 a detailed summary and analysis of the design processes of these works is presented. According to the analysis, the design workflow of all case-studies includes the development of custom computational design tools, digital modeling, fabrication of prototypes as test surfaces, experimental measurement of the acoustic performance, and the integration of these data into the generative tool.16–19 At the moment, this approach requires a customization of existing software or the development of project-specific tools through computer-programming. 21 Therefore, programming skills are generally required to enable to develop and run such custom procedures. 22 These design methods suggest the need for new professional figures, with a multi-disciplinary background and programming skills, in order to generate tailored design solutions to meet both aesthetical and acoustic requirements in a more interactive way between disciplines. It is important that future investigations could integrate to these two aspects also the perceptual dimension, which has been shown to be very important when the significant differences have to be determined between different solutions related to diffusive surfaces.23–25
This research presents a design optimization method for diffusive surfaces based on the combination of parametric modeling and geometrical acoustic simulations. A parametric design tool (Grasshopper) and a geometrical acoustic simulation tool based on ray-tracing method (RT) integrated into a 3D modeling software (Rhinoceros) have been used to generate rapid performance feedback and to optimize the performances of complex diffusive surfaces. The main aim of this study is to provide architects and designers with an approach and a tool that can run simplified acoustic analyses on the diffusive performances of surfaces at a preliminary stage of their design, which can be easily and rapidly visualized within the modeling program. The approach allows the user to compare different solutions and promotes final decisions based on integrated acoustic and aesthetic features of the design.
Methods
The evaluation of the sound diffusive performances of 14 surfaces has been structured into two parts. Firstly, the sound diffusive performances of four simple 1D diffusers, i.e. single plane diffuser which produce scattering in one plane, have been tested with a BEM method (Reflex AFMG) and with the proposed ray-tracing (RT) acoustic simulation tool in the attempt to assess/verify the accuracy of the latter method. The second part documents the design optimization process and the performance assessment of a sample 3D diffusing surface, i.e. multiple plane diffusers, featuring on hexagonal-based scattering elements. The design optimization is articulated into five subsequent steps; at each step two versions of the diffusing surfaces, with different coverage densities, were developed and tested. The sound diffusive performances of the ten resulting surfaces were tested with the proposed RT tool only.
The design optimization takes into account the procedure proposed in ISO 17497-1:2004 Standard, 10 which refers to the measurement of the random-incidence scattering coefficient in a diffuse field, and also the recommendations in ISO 17947-2:2012 Standard, 11 referred to the measurement of the directional diffusion coefficient in the free-field. The scattering coefficient is defined as the ratio of the non-specularly reflected sound energy to the total reflected energy. The diffusion coefficient describes the quality of the diffusers, that is, it quantifies the spatial uniformity of the scattered sound. Both these coefficients are frequency-dependent single numbers in the range 0 to 1.
Therefore, the optimization process has different objectives: (1) the maximization of the scattered energy with respect to the specularly-reflected one, that is to obtain a random-incidence scattering coefficient close to 1, and (2) the generation of a more uniform polar distribution of the scattered energy for any source angle, that is a diffusion coefficient value close to 1. The first parameter has not been assessed with a direct method in this work, under the assumption that the amount of non-specularly reflected energy is expected to increase based on the geometric rules available in literature,20,26 which were applied to optimize the diffusive performances of the surfaces. Thus, the optimization process has focused on the second parameter, that is, the diffusion coefficient, with the aim to increase the uniformity of the spatial distribution of the reflected sound energy.
Optimization process
Two different approaches have been followed in the optimization process, that is, qualitative analyses and quantitative ones. Both approaches are based on RT assumptions as they do not consider the wave equations and treat the sample as a perfectly rigid surface without any absorptive properties. Therefore, no frequency dependence is considered.
Qualitative analyses are based on the visual inspection of the 3D polar distributions of the reflected rays, which are compared to a target distribution, that is, a hemisphere, that represents a uniform spatial distribution of sound energy. In this process, the rays are generated by an omni-directional sound source located at a distance of 10 m from the surface sample (area ≈ 10 m2), which is positioned horizontally, as shown in Figure 1(a). The position of the sound source can be controlled by altering its azimuth (ф) and elevation angles (θ). After being reflected by the surface sample, all the reflected rays are stopped as they intersect a boundary hemisphere of radius 5 m. For each reflected ray, it is possible to visualize the reflection path length (m) and running time (ms).

Virtual scene and visualization used in the acoustic simulations for the (a) Qualitative and (b) Quantitative analyses.
In the second phase, an objective function optimization has been considered based on the normalized sound pressure levels calculated over two orthogonal semi-circles, oriented vertically with respect to the surface sample. In this case, the proposed set-up is defined in compliance with the indications of the ISO 17497-2 Standard. 11 The virtual scene is shown in Figure 1(b). The diffusion coefficient of the sample is estimated by using the RT acoustic simulations in a virtual anechoic room. The sample (≈10 m2) is positioned horizontally at the center of the hemispheres, while the location of the sound source can be controlled by the user. In this paper, the sound source has been located at different positions along two orthogonal semi-circles with a radius of 10 m. A series of spherical receivers is distributed over two orthogonal semi-circles with a radius of 5 m that surround the panel. The equal spacing of the spherical receivers along the orthogonal semi-circles, as well as their radius, was defined with the goal of capturing all of the sound energy reflected from the sample towards the semi-circles. Therefore, the radius of the receivers is equal to the spacing between them, meaning that a given receiver is tangent to the center of the sphere of the neighbor receiver.
The acoustic simulations performed to estimate the reflected sound energy at each receiver position are based on the RT technique described in Xiangyang et al. 27 The sound source is an omnidirectional source with a sound power W0. Since the simulations are intended to estimate the performance of a small panel, and in the interest of reducing calculation times, the sound source shoots sound rays uniformly in the solid angle towards the panel. Therefore, all the rays emitted by the source hit the surface sample. This study does not consider the sound absorption of the panel, nor the attenuation caused by the air. As a result, the sound power delivered by each one of the sound rays is:

where N is the number of sound rays. The ith ray is considered to cross a given spherical receiver r, if the shortest distance from the ray to the center of the receiver dc is smaller than the radius of the receiver.
The sound intensity contribution of the ith ray to the receiver r is defined as:

where Vr is the receiver volume, and dri is the length of the path of the ith ray within the sphere of the receiver r:

where rr is the receiver radius.
Based on previous equations, when a sound ray passes through the center of a receiver, all of its energy is recorded in the receiver itself, while none of it is given to its neighbor receiver, as the distance (dri) travelled by the ith ray inside the neighbor receiver will be equal to zero, as shown in equations 2 and 3. Indeed, the ith ray would be tangent to the sphere of the neighbor receiver. If the sound ray passes through a location comprised between the centers of two receivers, its sound energy is shared between them, proportionally to their dri values. For example, a ray passing exactly through the midpoint of two receivers centers, namely A and B, will have dri values for A and B equal to half their radius. Therefore, according to equation 2, the sound energy of the ray is equally shared between receivers A and B, that is, the intensity contribution to each receiver is equal to half of the ray energy. In this way, there is never duplication or loss of energy.
Once the computation of the energy contributed to a given receiver by all sound rays has been performed, under the assumption of a sound impedance of the medium ρc to be 400 (kg/m2s) and pref to be 2ˑ10-5 (Pa), the Sound Pressure Level (Li) can be calculated as:


These simulations offered a visual representation of the calculated Li values over the two orthogonal semi-circles of receivers (xz and yz planes). A set of vectors with color and length assigned according to the amount of reflected energy (Figure 1(b)) was used to represent the sound energy reflected by the surface sample.
Moreover, a single value diffusion coefficient has been calculated based on ISO 17497-2 Standard. 11 The estimated parameter in this phase is the diffusion coefficient defined as follows:
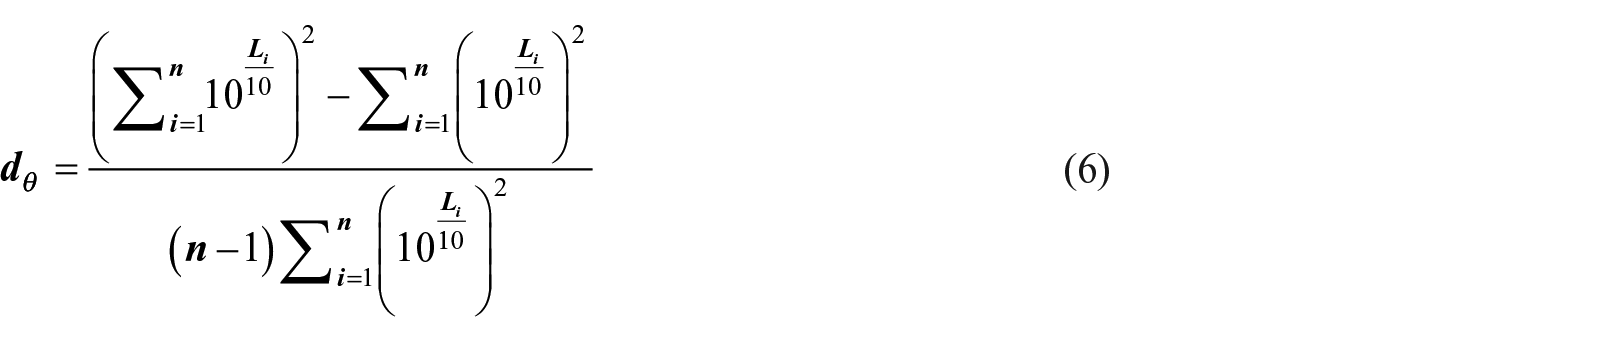
where dθ is the diffusion coefficient for the j-th one-third octave band considered, Li is the sound pressure level of the reflected sound for the j-th one-third octave band considered at the i-th receiver position, and n is the number of receiver positions. Since the simulations performed here are based on ray-tracing, they do not consider the wave phenomena and assume the sample as perfectly rigid without any absorptive properties, the dθ is calculated as a single number uniformity index uθ without any frequency dependence, that is, equation 6 is used for uθ calculation. Moreover, it should be noted that in these simulations it has not been necessary to normalize the uniformity index in comparison to a flat surface (ISO 17497-211), which aims to remove edge diffraction scattering effects due to the limited sample size under analysis. The edge diffraction scattering effects due to the limited sample size and any scattering property of the surfaces have not been implemented. Therefore equation 6 directly describes the uniformity of scattered energy from the surface topology only. Thus, the simplification made by using a single number uniformity index uθ is accepted based on the main aim of this work, which having a quantitative number that allows to easily compare different design alternatives, besides the visual feedback.
The following sections give more details on the simplifications made by using a ray-tracing method and define the validity domain of the proposed approach.
Simplifications and limitations
The ray-tracing method is a geometrical acoustic (GA) simulation technique which neglects the wave properties of sound and assumes its propagation as rays. 28 It is a simplified simulation method and as such it presents a series of weaknesses related to the accuracy of the results at low frequencies where the lack of wave phenomena starts to play a major role.
One of the neglected aspects is the contribution of edge diffraction, which can be considerable when dealing with finite reflectors with dimensions similar to the wavelength or when the distance between reflector and receiver is not small. Several models of edge diffraction can be used to extend the validity of geometrical acoustic techniques. 28 Rindel 29 showed how the reflection strength can be modified using the Kirchhoff-Fresnel approximation. For a free-hanging finite reflector with no absorption or surface scattering, the reflected sound will have a high-pass filter effect, as well as interference effects above the high-pass cutoff-frequency, and asymptotically tend toward the infinite-wall reflection factor. The diffraction wave is apparently radiated from the edges or perimeter of an object. Its intensity is negligibly small if the object is small compared with the wavelength. In this case, the incident wave remains unaffected. The inclusion of these models in the current study was quite limited because of the resulting increase in computation time when calculating the statistical distribution of diffraction angles depending on the distance from the edge, the wavelength and the ray incidence angle.
Another aspect that is neglected when using the ray-tracing is the phase information. This kind of information is crucial when designing phase grating diffusers (e.g. QRD), which are highly influenced by phase interactions and requires proper surface modulations with regard to the wavelengths. 30 It should be noted that these types of diffusers cannot be evaluated with the approach presented here, which considers geometric scattering only. It is assumed that the validity of the results and comparisons presented here regards only frequencies above the effective frequency f0, which is the frequency where the scattering coefficient is maximized based on the size of the scattering elements. The dimensions of the scattering elements are the first design aspect that can be controlled. The simple equations presented in Cox et al., 31 that is f0 = c/2a or f0 = c/2h, show linear relations between the frequency and the sizes (a = width or length, and h = height or depth) of the scattering elements. The surface can be assumed smooth at low frequencies if the depth, h, and the length, a, of the irregularities profile are significantly smaller than λ/2. When the scattering elements are of the order of magnitude of the wavelength a complex scattered field will develop; for higher frequencies the single faces of the irregularities reflect the impinging sound energy in a specular way. Based on this, the geometric theory 32 is applied in this work. The effects of the single surface orientation are considered by the ray-tracing method proposed above, which accounts for the diverged reflected rays through a simple geometric construction. This is valid when the wavelength is assumed to be small compared to the surface size, that is, for frequencies higher than the f0. In order to improve this process, the diffraction from the finite-sized panel could be considered and then the effect of single surface orientation added as proposed in Rindel. 32
A simple case-study presented in Hargreaves et al. 33 is used to highlight the effects of the simplifications introduced with the RT approach. It should be noted that while there are several databases of measured diffusion coefficients for a wide range of surfaces, only a few measured frequency-dependent polar distributions are available in literature. These are usually obtained through wave-based simulations. 30 Figure 2 shows the case of a simple square-based pyramid (a = 1.5 m and h = 0.35 m), which has been characterized by a two-dimensional measured and BEM-predicted polar response at 1 kHz for normal incidence source. The set-up presented in Figure 1(b) has been used to characterize the surface through the RT approach presented here.

Comparison of the RT method with two-dimensional measured and BEM-predicted polar responses of a square-based pyramid at 1 kHz for normal incidence source presented in Hargreaves et al. 33
It can be noticed that the surface is effectively a redirecting surface which generates two strong reflections in different distinct directions, which is expected to form a notch response reducing the energy in the specular direction. The performance might be compromised at low to mid-frequencies, when finite-sized panel effects become important. 30 The RT approach detects the strong reflections from each side but is not able to approximate reflections in the −30° to 30° direction. However, given that a number of clear distinct lobes is predominant (almost 10dB higher), simple ray tracing techniques can still be used to locate the directions of the most significant lobes. 30 Therefore, geometric diffusers such as triangles and pyramids, which mainly generate dispersion, redirection and specular reflection could be easily evaluated through the RT proposed method. As suggested above, the Kirchhoff-Fresnel approximations presented by Rindel 29 could be used as a guide to determine the cut-off frequency to detect when each side will produce specular-like reflections and so produce a notch response, and when the scattering will be more dominated by edge diffraction. However, at this stage of the research this part has not been implemented here and only simple ray tracing has been considered.
Assumptions and comparison to BEM simulations
The results of the quantitative analyses have been firstly compared to those of BEM simulations performed using Reflex AFMG. It is a wave-based acoustic simulation software that calculates the reflection, diffusion, and scattering properties of a sound wave incident upon a defined geometrical structure in a 2D modeling environment. Therefore, the method can be applied only to assess the performances of single plane diffusers (1D), under the assumption that the geometry extends infinitely in the third dimension. Moreover, the surface of the sample is assumed to be perfectly rigid and 100% reflective. The calculation of the scattering coefficients is based on the ISO 17497-1 Standard, 10 while the Li directivities are evaluated based on the method proposed in ISO 17497-2 Standard. 11 The receiver positions over the semi-circles have been defined with an angular spacing (α), that is, resolution, of 1°.
The diffusive performances of three 1D diffusive surfaces and one flat surface have been simulated with Reflex AFMG and with the quantitative method presented in this paper. The scattering elements of the three diffusive surfaces either feature rectangular, curved or sawtooth profiles, with a = 0.30 m and h = 0.20 m (f0=567Hz and f0=850 Hz, that is, within 630 Hz and 800 Hz third-octave bands, respectively). The performance comparisons were based on the polar distributions obtained using Reflex AFMG for the different third-octave bands (>800 Hz) as well as on the uniformity index uθ of the Li distribution over a semicircle of n receivers with α = 1° (n = 361). The simulations have been performed at five source positions, located at 10 m distance from the surface over the angles 0°, ±30° and ±60° over the xz plane. For the surfaces with flat, rectangular and curved scattering elements, only 0°, +30° and +60° have been simulated since they have a symmetric geometry. The simulations have been performed for each surface with three different values of the number of rays Nr, that is, 10 k, 50 k, and 100 k, in order to evaluate the corresponding simulation time variation. The uθ values obtained from the simulations are shown in Table 1. It can be noticed that the different numbers of rays do not cause the simulated uθ values of each surface to vary significantly. The largest differences are reported for the curved surface at 0° and 30°. The simulation time varied from 2 to 3 min, 5 to 7 min and 8 to 11 min for 10 k, 50k, and100 k rays, respectively. Considering the uθ variations and the differences in simulation time, it was decided to use 50k rays in the simulations described in the following paragraphs.
Uniformity index (uθ) for four surfaces using Nr = 10k, 50k and 100k.
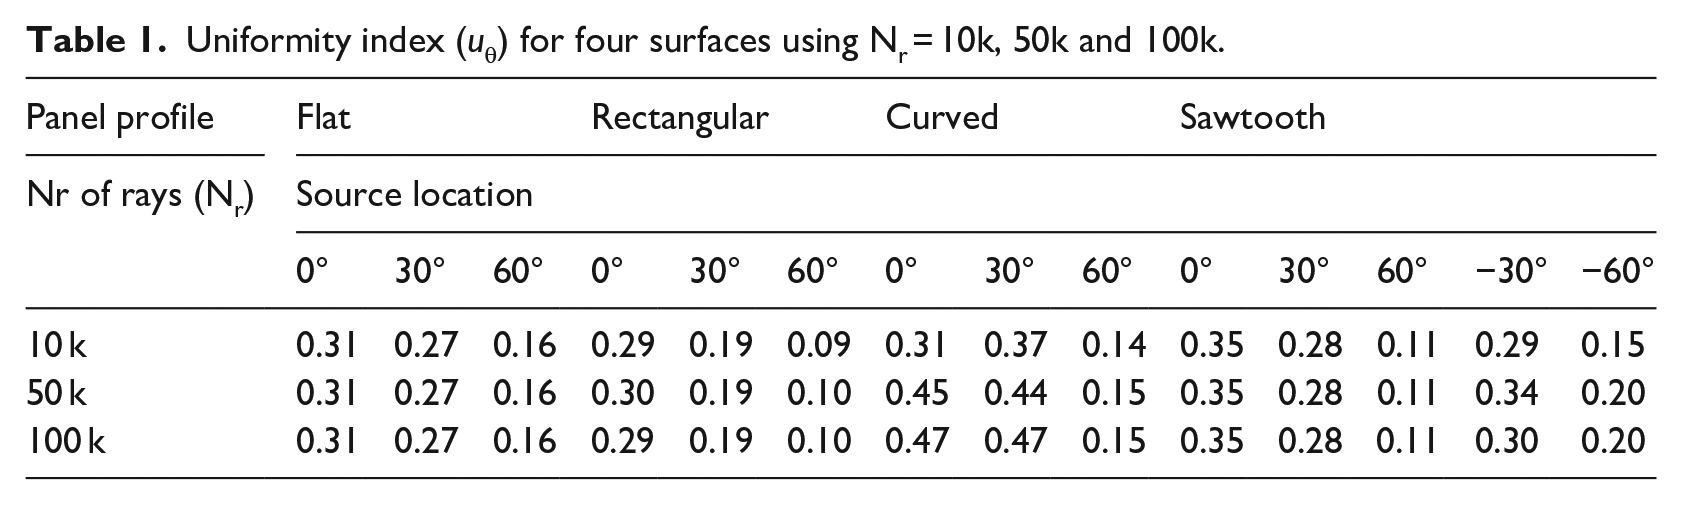
Figure 3 shows the polar distributions of the sound energy reflected by each of the four surfaces, obtained with Reflex AFMG and with the proposed RT method, considering a sound source located at 30° in the xz plane. The spatial response plots display the sound pressure level of the reflected sound wave relative to the level of the incident sound wave. The radial is given in decibels. Moreover, the calculated diffusion coefficient d30 or uniformity index u30 have been reported. It can be noticed that the polar distributions of the reflected energy of the surfaces obtained by the RT method are coherent to the performance of the four surfaces obtained by Reflex AFMG. The lobes in the polar distribution obtained by the BEM simulation are highlighted with a more intense color in the polar graphs calculated with the proposed RT method. However, it should be noted that due to the principles on which the generation of the reflected rays is based in RT, this method tends to overestimate the uniformity uθ compared to the dθ values. This trend is more evident in the case of the flat surface, where it is not possible to distinguish the direction of the specularly reflected energy, based on the polar graph. It can be noticed that due to this, the rectangular surface case results into a lower uθ compared to the flat surface. Moreover, the method seems to overestimate the uniformity also in the case of curved surfaces. Indeed, the curved surface uθ shows how this surface outperforms the sawtooth surface. This is not highlighted from the dθ of the same surfaces obtained with the BEM simulations. Therefore, the investigation of the curved surfaces would require a specific investigation which goes beyond the scope of this work. Despite the systematic drawback related to the specularly reflected energy, the graphs can be useful to perform a comparative investigation of different surface design alternatives when considering geometric scattering; an example of this application is reported in in the following paragraph.

Polar distribution of the reflected sound energy for source location θ = 30° on the xz plane with RT and BEM method, dθ at 800 to 5000 Hz third-octave bands and uniformity index (uθ) for a flat and three diffusive surfaces. The radial axis is given in decibels.
Optimized geometries
The diffusive panels considered in the design process are square in plan, with the side length equal to 3.3 m, and an area of ≈10 m2. They are composed by a planar base on which different arrays of scattering elements are located, as shown in Figure 4. The form-optimization process has been articulated into five steps (Figure 4), in which the arrangement and/or shape of these elements has been modified in the attempt to improve the scattering and diffusion properties of the panels. The geometrical variations applied to the panels have been selected based on the indications suggested in previous studies.34–38 The considered panels were modeled parametrically in Grasshopper for Rhinoceros, exploiting also the functionalities of the Kangaroo2 plug-in. The parametric model enabled to control the arrangement and the shape of the scattering elements, as well as the coverage density (CD) of the elements. The latter parameter quantifies the number of scattering elements of the panel and is calculated as the percentage of the area of the squared panel which is covered by the scattering elements. Kangaroo2 plug-in has been used to randomize the distribution of scattering elements and to easily control the coverage density in an automatized way.

Five different optimization steps H1-H5.
With respect to the arrangements of the elements, both the grid and the random distributions were tested. The geometric variations of the elements which have been investigated are all based on a hexagonal base, from which different forms have been developed, that is, hexagonal prisms, hexagonal pyramids and truncated hexagonal pyramids. Moreover, different dimensions of the scattering elements have been considered, that is, different widths (0.15, 0.25, 0.30 m) and heights (0.19, 0.22, 0.25 m). At each optimization step, two panels with different coverage densities of the elements were tested, that is, 26% to 30% and 60% to 65%, which represent low and high coverage density, respectively. Therefore, the overall number of panel configurations analyzed is 10, resulting from 2 samples with different coverage densities for each of the five optimization steps (Figure 4).
The starting configuration of the panel (H1) features an array of hexagonal prisms (width 0.30 m, height 0.25 m) arranged in a grid layout, with coverage densities of either 26% or 65%. In the second optimization step, the arrangement of the elements has been randomized in the attempt to enhance the scattering properties of the panel (H2), as suggested in Tsuchiya et al. 34 and Jeon et al. 35 ; the form of the elements, as well as the coverage densities were unchanged from to the previous step. As recommended in Tsuchiya et al. 34 and Lee et al., 31 in the following step, the widths and heights of the hexagonal elements (H3) have been varied. The widths were set to either 0.30 m, 0.25 m or 0.15 m and the heights to 0.19 m, 0.22 m, 0.25 m. The coverage densities of the panels from the third optimization step on, that is, those featuring a randomized distribution of elements, are 30% and 60%. In the fourth step, the sides of the hexagonal prisms elements have been tilted to generate hexagonal pyramids (H4), which feature the same dimensions (width and height) of the previous step. Since the pyramidal elements feature facets inclined at various angles, this modification was expected to reflect the incident soundwaves towards different directions and promote diffusion, as suggested in Cox and D’Antonio. 30 To conclude, in the panels developed in the fifth step the top of the pyramids was cut by a randomly inclined plane to generated truncated hexagonal pyramids. This enables to further variate the inclination angles of the facets of the elements, thus enhancing diffusion. 30 All the 10 surface samples generated at the various optimization step have been analyzed using the qualitative and quantitative methods described in section 2.1. Figure 5 shows the workflow followed in the design and evaluation processes. It also highlights the further steps (Fabrication and Measurements) that can be implemented in order to fabricate samples that could be used to tune the design parameters or to fully characterize the final solution ahead its application in-field. 30 As it was shown, the fabrication process for prototyping purposes can include different techniques that can be chosen based on fabrication accuracy and costs, while the acoustic characterization can be faced in a more sustainable way through scaled samples and reduced dimensions.10,30,38 These two last steps of the workflow have not been pursued in this work given the focus of the research on the second step (Digital Tools) and due to budget limitations. As it was described above, the computational design system (Digital tools) contains two main clusters related to the geometry generation and to the acoustic analyses.

Workflow: design rules, digital tools, fabrication and measurements systems.
Results
Qualitative analyses
The qualitative analysis is based on the visual inspection of the rays reflected by the sample over the boundary hemisphere surrounding the panel shown in Figure 1(a). As it has been reported above, this method can be useful for a first screening of the design alternatives.
The top and lateral views of the reflected rays for the different surface samples from H1 to H5 are shown in Figure 6. It can be noticed that panels H4 and H5 provide a more uniform distribution of sound reflections and could be chosen for a further investigation based on quantitative data with more accurate methods when this approach is used in the design process. Due to the research character of this paper, all the configurations have been further investigated with the subsequent quantitative method.

Qualitative and quantitative analyses of five different optimization steps based on the arrangement and/or shape variation of the scattering elements. The red dot shows the location of the sound source. The radial axis is given in decibels.
Quantitative analyses
The quantitative analysis is based on a visual inspection of the polar distribution of the reflected energy generated by interpolating the Li values calculated at the receivers over the two orthogonal semi-circles (xz and yz planes) and the uniformity index (uθ) evaluation for the ten panels resulting from the five different geometrical arrangements (H1–H5) and the two different coverage densities (Figures 6 and 7). Figure 6 shows the polar graphs (xz and yz planes) of the Li for each panel related to a sound source location of θ = 30° on the xz plane. It can be noticed that the method is sensitive to the surface performance improvements obtained at the various optimization steps, which involve the coverage density variations, as well as changes in the arrangement and inclination of the faces of the scattering elements. The method seems less sensitive to the variation of the size of the scattering elements. This finding is coherent to the limitations of this study, since the variation of the dimensions of the scattering elements is expected to influence the specific frequency of scattering performance, that is, the effective frequency f0, that is not considered in the RT method implemented.
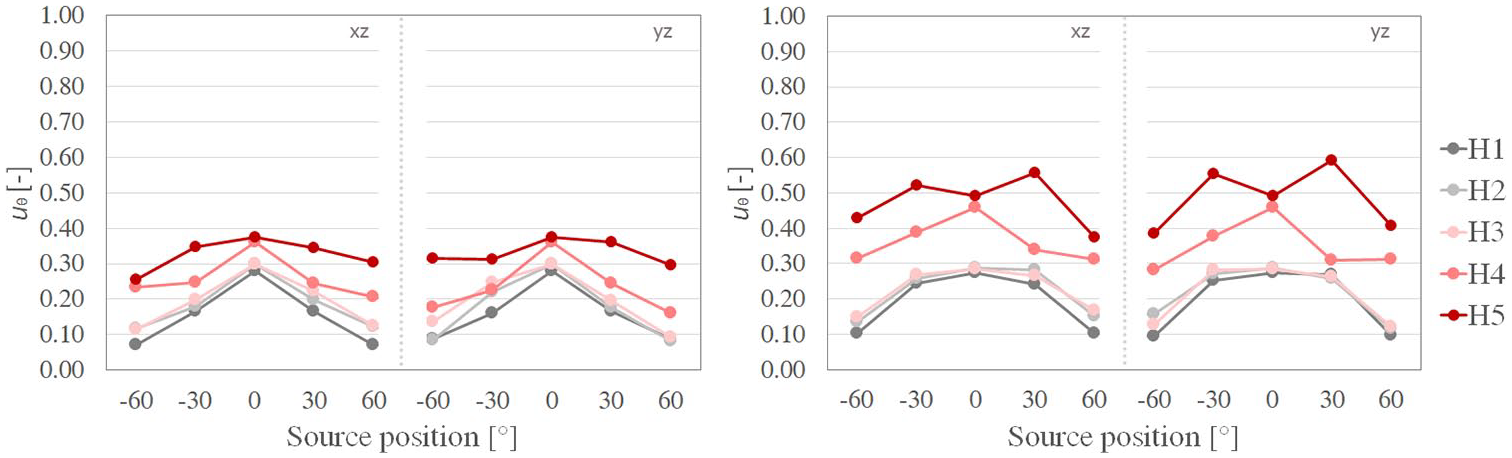
The uniformity index (uθ) for different positions of the source on the xz and yz planes (θ = 0°, ±30°, ±60°) evaluated for five different diffusive surfaces (H1-H5) at a coverage density of 26% to 30% (left) and 60% to 65% (right).
As in the previous paragraph, the polar graphs highlight that it is not possible to distinguish a specific direction of the specularly reflected energy. However, it can be observed that in the optimization steps from H1 to H5, the reflected sound energy is taken away from the specular zone and redirected randomly in space. The uniformity index uθ is useful for a quantification of the quality of this redirection.
Figure 7 shows the extent to which uθ is sensitive to the variations of coverage density, arrangement, size and inclination of the faces of the scattering elements. Five sound source locations have been taken into account at elevation angles θ = 0°, ±30° and ±60° on the xz and yz planes. A slight increase of u0° for H1 to H3 is reported when the coverage density is increased. However, it is not significant at source locations θ = ±60°. H4 also shows to be sensitive to the coverage density variation with uniformity index values of about 0.25 and 0.35 for the 30% and 60% coverage density, respectively. H5 panel outperforms the other ones, achieving uθ values of about 0.35 and 0.50 for the 30% and 60% coverage density, respectively. It is noteworthy that actual diffusers rarely reach values of diffusion coefficients higher than 0.70 as shown in ISO 17497-211. Moreover, H5 shows also more similar uniformity index values between the xz and yz planes, particularly for the lower coverage density. Therefore, the design strategies applied to define H5 could be considered efficient.
Conclusion
In this paper, a simplified performance evaluation methodology for sound diffusive surfaces has been presented, based on a qualitative and quantitative ray-tracing approach. The proposed approach is intended as a tool that could contribute to ease the work of designers during the preliminary stage of the design process and that could benefit the project by reducing the risks of generating acoustic defects to address in later design phases. Indeed, the tool enables to get rapid feedbacks of the acoustic performance of the surface while its geometric features are modified. However, tests on the suitability for architects and professionals alike should be extensively performed, for example, through the administration of questionnaires.
The method should be used with caution, bearing in mind that the application of the RT method is limited to results in mid-high frequencies range and that wave-based phenomena such as phase, edge scattering and diffraction are neglected. These limitations also led to a reduced sensitivity towards the size variation of the scattering elements of the panels tested here. However, the results have shown that the proposed method is sensitive to the performance optimization strategies applied by varying the coverage density, the arrangement and the inclination of the faces of the scattering elements. Given these considerations and aspects related to budget and computational resources limitations at a preliminary exploratory phase of the design process, the proposed method could be a useful tool for relative comparisons between design alternatives which could be further investigated with more complex simulations or measurements.
Further validation and improvements of the proposed methodology will be performed through comparisons with scattering and diffusion coefficient measurements and 3D wave-based simulations and laboratory measurements. A parallel solution can be the implementation of accurate simulation methods (FDTD, BEM, FEM etc.), which would be as fast (or faster) than the ray-tracing methods and can be easily integrated into the common design tools. Furthermore, a hybrid approach as the one proposed in Vorländer, 39 would improve geometric acoustic models by extensions that include wave models for the low frequency range. Both these perspectives do not seem to be immediate at the current state of the art given the available computational power.
Moreover, a cluster of auralizations could be included in the Digital tools part of the workflow in order to determine perceptual differences between the different design alternatives, which could strongly influence the final design decisions.
Footnotes
Declaration of Conflicting Interests
The author(s) declared no potential conflicts of interest with respect to the research, authorship, and/or publication of this article.
Funding
The author(s) received no financial support for the research, authorship, and/or publication of this article.