
Abstract
People’s interactions with the environment shape their experiences. Thus, understanding these interactions is critical to enhancing human well-being. Aural attributes play a significant role in shaping the perception of space in addition to visual attributes. It is well known that sounds evoke an emotional response, but less is known about how the acoustic characteristics of environments reinforce such an emotional impact. By adopting virtual reality as a platform for recreating 3D sounds and 360° visuals of built environments of worship spaces as case studies, this study aims to investigate the influence of the acoustic environment considering audiovisual congruency on enhancing the human experience through self-report and physiological response analysis. It also examines the role of cultural background in terms of familiarity with the acoustic environment. The convergent mixed-methods approach, merging both quantitative and qualitative analysis, provides a deep understanding of the role of the acoustic environment in enhancing the auditory experience. The results show that the acoustic environment and audiovisual congruency amplify the intensity of the emotional impact, and the amplification of the impact can vary depending on the acoustic environment of the building. They also reveal that familiarity with sound and acoustic characteristics can increase this impact.
Keywords
Introduction
The design of the built environment plays a significant role in shaping the human experience.1–6 Blesser and Salter 7 stated that the human experience is shaped by interaction with the environment: “As human beings, we interact with both our social and our physical environment by using all our senses. . . Each of our senses plays a unique and complementary role in creating our internal experience of the external world.” However, architectural characteristics in a building not only result in visual attributes that affect how the occupants see the space, but also create auditory environments that impact what those occupants hear based on sound propagation and reflections from surfaces. Nevertheless, the physical measurements of architectural acoustics do not precisely reflect the human auditory experience 8 ; other perceptual and cultural aspects contribute to it, as the aural architecture approach suggests. 7 The perceptual aspect of auditory experience deals with the psychological and physiological effects of sound and its relation to human cognition and emotions, while the cultural aspect focuses on the role of cultural background in sound perception. 9
Related research in the perceptual and cultural aspects of acoustic environments
Research in architectural acoustics has significantly improved, but the area continues to face some challenges, and further studies are required to answer questions beyond the physical aspects of acoustics, including the perceptual and cultural aspects. 7 While many researchers have studied audience responses to acoustics to analyze how acoustic attributes contribute to sound perception in concert halls, such as Beranek, 10 who established a foundation for the perceptual aspects of acoustic environments, there are still questions that require answering to understand the auditory experiences regarding their emotional impact on the occupants. Pätynen and Lokki 11 investigated the connection between the acoustic environment and perception in several concert halls using psychophysiological data and subjective response, and their study showed that the characteristics of the acoustic environment (such as lateral reflection), which is shaped by the architectural features (such as room shape), can impact the emotions of the listeners. Nevertheless, researchers have argued for the need to account for cultural aspects in studying acoustic perception, 12 mainly because the acoustic environment produced by architectural design is considered as part of the intangible cultural heritage.13–16
The experience of acoustic environments is linked to culture, as stated by Blesser and Salter 7 —“Cultural values convert physical phenomenon to experiential phenomenon.” Aural architectural analysis, which includes perceptual and cultural aspects in addition to the physical aspects, provides a more holistic approach to understanding the auditory experience. Since worship spaces require acoustic environments that support spiritual needs and enhance faith, 17 such spaces offer an example in which the human experience is dependent on the acoustic environment. In addition, worship spaces are buildings where cultural aspects are highly influential in space design and usage. Researchers claim that the design of worship spaces has responded to the acoustic needs of the worship activity; the architecture of Catholic churches, as an example, has changed on grounds of change in liturgy, 18 while the design of Orthodox churches changed very little because liturgy that is practiced in those spaces did not undergo similar changes. 14 A detailed review of the aural architecture aspects that shape such experience in worship spaces has been discussed in a previous research, 19 including the perceptual and cultural aspects. The above reasons make worship spaces an ideal building type to adopt as a case study to investigate how the acoustic environment influences human experience and emotions.
Many worship activities involve musical performance, and music has always been associated with emotion. Emotion is a complex topic that has been defined differently by several researchers; however, scholars agree that the emotional response is usually associated with physiological actions such as sweat, flush, muscle tension or relaxation, and change in heart rate. 20
Researchers have extensively studied the emotional impact of music and developed methods including psychological and physiological measures to assess it.21–23 Since it is well established that sound can create an emotional effect, and since buildings’ interiors create acoustic environments that manipulate the original sounds, is it possible for spaces to enhance the emotional impact created by the sounds performed in them?
The architectural features of spaces can affect the physical acoustic aspects of space—such as sound amplification, filtering, enveloping, note blending, and source location manipulation. Such influences enhance the emotional experience, and in many cases, may increase the intensity of the emotional impact.7,24 For example, Hale 25 stated that the resonance effect of some historic buildings influences both the state of mind and the emotions; this can appear as a physiological effect (e.g. change in heart rate, breathing rhythm). Another example of this relationship is how the physical environment can influence sound characteristics by creating an echo. The echo, which contains multiple sound reflections from the architectural surfaces, makes identifying the sound source difficult—the sound source may appear to be invisible, which influences listeners’ emotions.25,26
Research in the soundscape, which deals with acoustic environments’ perception, has investigated the emotional impact of soundscapes. Li and Kang 27 studied the physiological response to soundscapes. They stated that natural sounds influenced heart rate response and called for further studies to investigate the emotional impact of soundscapes based on their characteristics. Medvedev et al. 28 also studied the emotional impact of soundscapes, focusing on restoration and stress recovery using subjective and physiological responses, including heart rate and skin conductance. The research revealed that soundscapes characterized as less eventful showed a link with a decrease in heart rate. Cain et al. 29 stated the importance of studying the emotional impact of soundscapes and developed emotional dimensions to evaluate the positive impact of soundscapes: calmness and vibrancy. They asserted the importance of conducting further studies to develop indicators for the emotional influence of soundscapes, especially when considering the conservation of the acoustic environment with cultural value.
Other researchers in soundscape pointed out that considering the cultural aspects is essential. Yilmazer and Acun 30 studied the subjective response to the soundscape of a historic religious building and its impact on people’s perception of place identity through a grounded theory approach. The results showed that people’s soundscape expectations and preferences depend on the space’s context and function. When the soundscape meets the expectation based on the context, it enhances the sense of space identity.
The studies mentioned above investigated (1) the emotional impact of soundscape through analyzing quantitative data that includes physiological response and self-report rating of the acoustic environment; (2) the cultural impact in the perception of the acoustic environment through analyzing qualitative data. Hence, there is a need for research that links the cultural aspect with the emotional impact of the acoustic environment by integrating quantitative and qualitative methods to provide more robust evidence on such impact.
Research problem
While previous research studied some aspects of the impact of the indoor acoustic environment on the occupant’s experience and emotions, many studies were based on simulated acoustic environments (opposite to recorded from the real environment) and linked to the general emotional impact and did not necessarily explain details about the experience and the type of elicited emotions. Additionally, although previous research emphasized the significance of considering the cultural aspects in studying the acoustic environments, providing an evidence based on analyzing the impact of the cultural background on the auditory experience and emotions is still necessary.
Moreover, even though researchers have demonstrated the connection between visual and audio perception and the significance of considering the visuals in studying acoustic environments,7,31–33 studies in the perception in architectural acoustics tend only to include audio representations.
The acoustic environments are a result of sound reflection from architectural features that has visual aspects. Therefore, even if certain acoustic characteristics can be produced through artificial sound systems, the occupant experience will not be the same, and therefore, neglecting the visual aspect in studying the acoustic environment shaped by the architectural features may impact the results. One of the motivations for this study is to demonstrate the role of the acoustic environments (resulted from the architectural design) in supporting the emotional experience in buildings such as worship spaces. Many worship spaces include reinforcement sound systems that, in some cases, used excessively to artificially manipulate reverberation, resulting in an acoustic environment that does not match what is expected based on the architectural design, which has the potential in impacting the occupant experience and emotions. Thus, including the visuals is a unique feature of this study that both provides a more realistic experience of listening to the sound in a worship space and demonstrates the impact of the match between the acoustic environments and the architectural features (audiovisual congruency).
The current research fills the mentioned gaps by offering a comprehensive approach that allows for a deeper understanding of auditory experience by studying the emotional impact of acoustic environments and how they shape the auditory experience using a mixed-methods approach, merging qualitative and quantitative methods to answer the following questions:
(1) Does the acoustic environment enhance the emotional impact considering the match between acoustic and visual features of the built environment?
(2) Does the intensity of the emotional impact vary based on different acoustic environments?
(3) Does the intensity of the emotional impact differ based on the cultural background and familiarity of the sound (chant) and acoustic environment?
Consequently, this study explains how acoustic environments can impact the occupants’ emotions and enhance their experience and connect the experience and emotional impact with the cultural background. It also demonstrates the importance of considering the audiovisual congruency during the design process, to enhance the emotional impact. *
The paper is structured as follows: Section 2 consists of the research methodology, including experimental design and data analysis method. Section 3 presents the results of self-report and physiological responses organized as quantitative and qualitative results. Section 4 includes discussions on the role of the acoustic environments in enhancing the emotional impact with explanations of the influence of familiarity. Lastly, section 5 provides a conclusion and points out the direction for future research.
Methodology
Experimental design
This research studies the human experience that can result from the acoustic features of a space. It adopts a within-subject experiment design by collecting the emotional response (self-report and physiological response) when the subjects experience a dry and wet recording of the same chant while visualizing the same building interior, then the process is repeated with the other buildings. The dry recording refers to the baseline scenario (the sound that does not include the effect of the acoustic environment), and the wet recording refers to the one that was recorded in the case study (the sound that includes the effect of the acoustic environment).
Since research on the acoustics of worship spaces from diverse cultures is limited, 34 we included two types of worship space in the study to it examine links to the cultural background in terms of familiarity and associations surrounding the sound and acoustic environment.
Stimuli preparation
For the present research, four religious buildings with historical and social significance to the community in the Detroit metropolitan area were selected (Figure 1), including two mosques and two churches, to explore emotional impact with a variety of volumes and architectural characteristics. The buildings included A1—the Islamic Center of America (volume ±5500.26 m3), A2—the Islamic Center of Detroit (volume ±1888.801 m3), B1—New Bethel Baptist Church (volume ±7560 m3), and B2—Breakers Covenant Church International (volume ±15,114 m3).

Interior views of the studied buildings. Top-left: Islamic Center of America (A1). Top-right: Islamic Center of Detroit (A2). Bottom-left: New Bethel Baptist Church (B1). Bottom-right: Breakers Covenant Church International (B2).
First, dry recordings of Quran recitations were captured at the anechoic chamber of Imam Abdul Rahman bin Faisal University, and dry recordings Christian hymn were obtained at the recording studio of the University of Michigan. Then the dry recordings of Quran recitations were played in the mosques and Christian hymns in the churches using the same loudspeakers (specifications in Table 1) connected to a PC through Focusrite Scarlett 2i2.
Specifications of the devices used in stimuli preparation.

The loudspeakers were placed at the front side of each space, which is the typical location of the sound source. Then, the played sounds were recorded again using a binaural dummy head (specifications in Table 1), following the recording procedure by Schroeder et al. 35 Then visuals of the buildings’ interiors were collected using a 360°camera (specifications in Table 1). The audio and visual recordings were conducted at the receiver locations indicated in Figure 2.
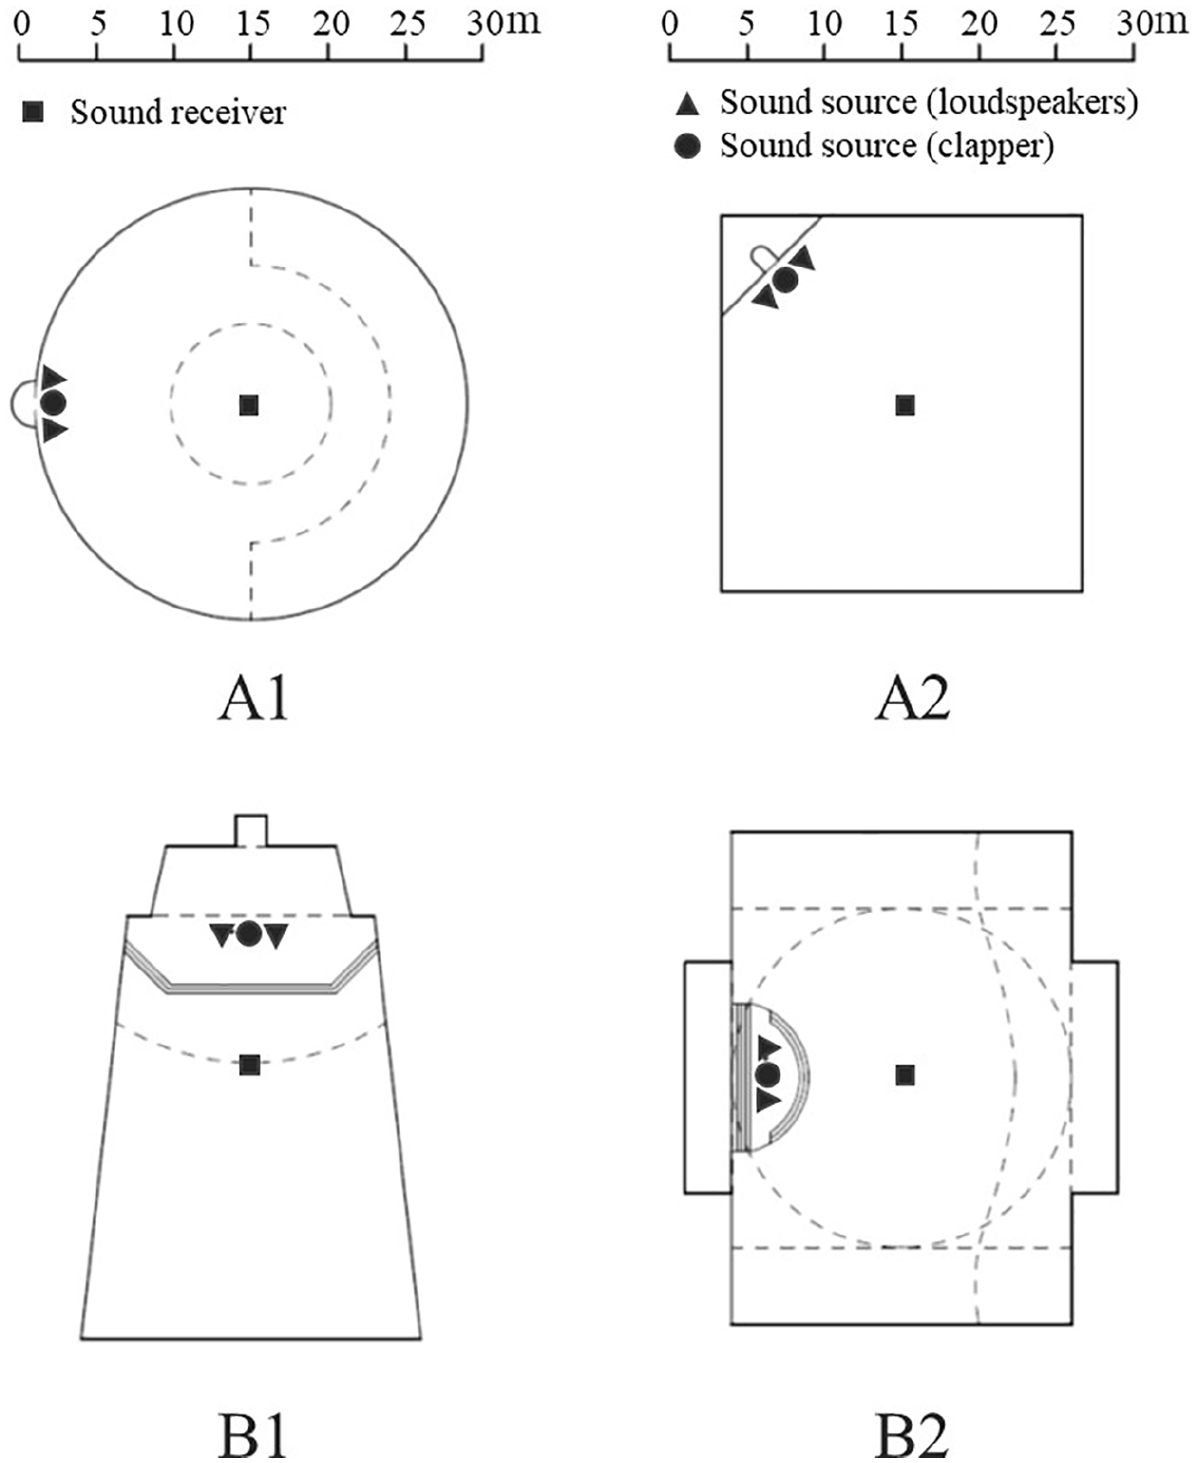
Floor plan drawings of the case study buildings.
The length of each stimulus was ±75 s (sampling rate: 44,100 Hz, bit depth: 32 bit). The reverberation time T30 at 1000 Hz where each of the dry recordings were conducted was <0.4 s. Table 2 shows the values of T30 where the wet recordings were conducted. The reverberation time was calculated after capturing the impulse response of each building. The IRs were recorded based on the standard ISO 3382-1:2009 (E). An impulse sound was generated using a wooden clapper at the front of the space at the height of 1.5 m above the floor. 36 The spaces were unoccupied during the measurements (Figure 2 shows the locations of the sound source and the receiver).
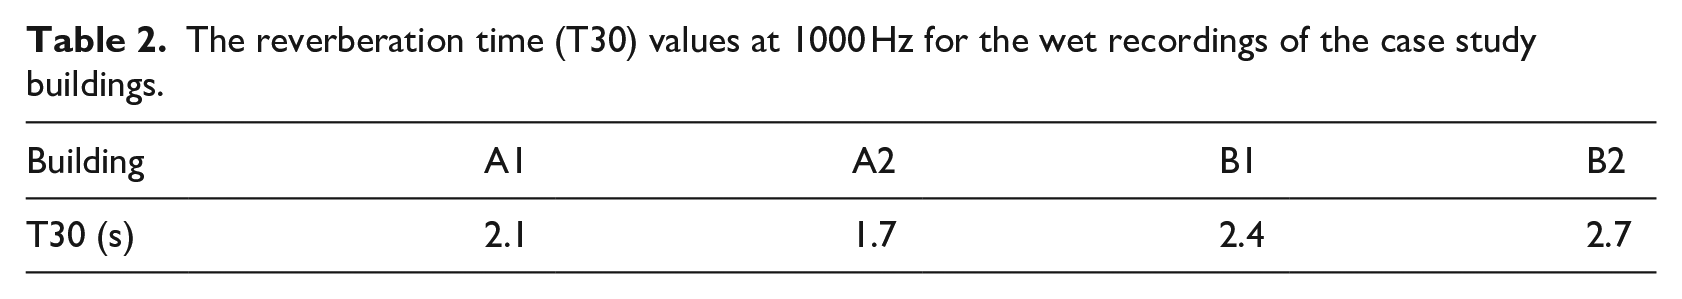
The reverberation time (T30) values at 1000 Hz for the wet recordings of the case study buildings.
In addition to the reverberation time, acoustic parameters such as early decay time (EDT), clarity (C80), and sound strength (G) were also calculated using SMAART software; however, the analysis of the mentioned parameters and the correlation between the acoustic characteristics of each space and the collected emotional impact indicators is out of the scope of this paper. It will be published in a following paper to allow for a detailed discussion on the correlation.
Experimental configurations
The scenes were played back to the participants through headphones and a wireless virtual reality headset (specifications in Table 3). To ensure that the focus was on the acoustics, the questions asked to the participants were related to acoustics, as will be demonstrated in the questionnaire explanation in the next section. Besides, to control the visuals’ impact as suggested by Galiana et al., 37 the visuals were identical for each dry and wet recording associated with the same building. It is also worth mentioning that previous research demonstrated that audio is more influential than visual when using a representation that includes both to assess an environment. 38 Also, playing back the dry and wet recordings using the same visuals for each building allows to consider the audiovisual congruency.
Specifications of the devices used in the experiment.

The study adopted a within-subject experimental approach for playing back the scene both audio and visual; then the emotional response was collected through self-report and physiological response Figure 3. Self-report is a post-performance evaluation, while the physiological measurement is considered a continuous (time-dependent) response. Both self-report and physiological data have advantages and disadvantages; combining them allows us to take advantage of the strengths of each method to provide a robust understanding. Although physiological measurements can be complicated to analyze due to the potential effects of other factors unrelated to the stimulus, they allow emotions to be captured that might not be evident to the participant or might be challenging to express. In addition, a physiological response is an unconscious process that can limit the bias that might accompany self-report evaluation. 39 In any case, it provides rich information about dynamic changes in the emotional state during the listening session. Heart rate and skin conductance signals are the most commonly used physiological measurements to study the emotional impact in response to music. 39 For more reliable results, researchers recommend a multi-signal approach that combines more than one physiological response.39,40 Researchers have previously used a combination of heart rate HRR and electrodermal responses EDR to study the human perception of built environment characteristics such as façade and sunlight pattern geometry, 41 noise, 42 and thermal-acoustic comfort. 43 Thus, a multi-signal approach using HRR and EDR was selected for this study. The increase in heart rate and electrodermal activity is an indicator of an increase in emotional arousal; however, additional factors need to be considered to understand the type of elicited emotion. 39 To illustrate, changes in the tonic level of EDR are an indicator of strong emotional response regardless whether it was positive or negative, 20 which is another reason for the importance of combining physiological measurements with self-report.
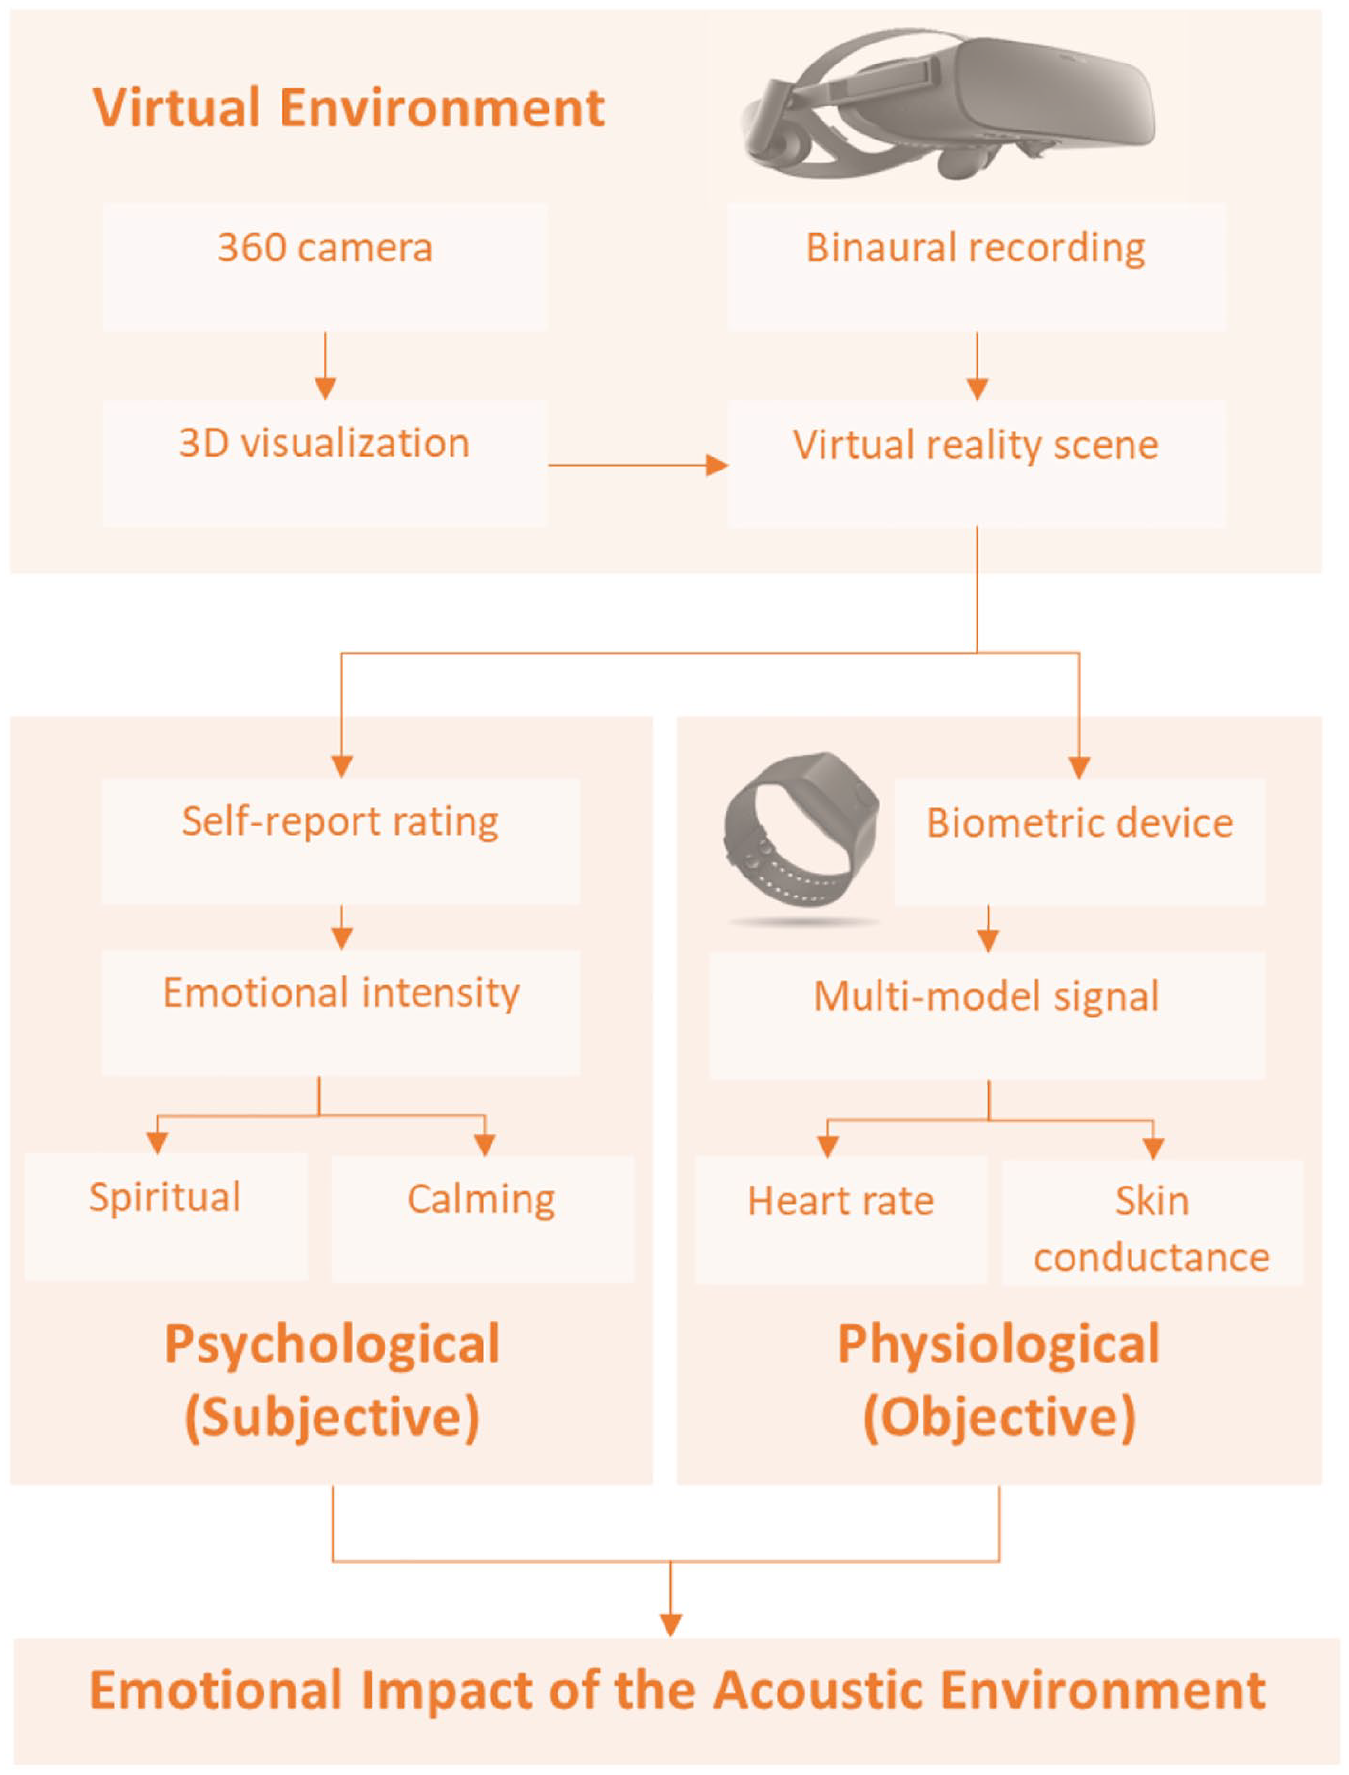
Research design.
The study was approved by the authors’ institution Review Board. It included 20 participants (9 males and 11 females) from diverse cultural backgrounds (religious affiliation, nationalities, etc.) and an average age of 29 (SD = 4.9; Min = 20; Max = 40). The sample size was calculated using (G*Power 3.1.9.7) software with statistical power (1−β) = 90, α = 0.05, and effect size of 0.8. The sample size satisfies the International Organization for Standardization recommendations in data collection and reporting requirements for human evaluation of acoustic environment ISO/TS 12913-2:2018 33 and was also based on the studies.32,33,35,43,44 The participants reported no hearing problems and an online audiogram hearing test (https://hearingtest.online/) that uses the ISO 389-7:2005 standard was conducted to confirm normal hearing for all participants.
Each participant experienced eight scenes: a dry and a wet recording for each of the four buildings. The dry recording in this experiment is considered as a baseline that allows for analyzing the emotional impact with and without the impact of the acoustic environment of each building. The order of buildings’ recordings and the order of the dry and wet recordings for each building were randomized. The sound levels were calibrated for the headphones. Then, the participants were instructed to keep the sound level fixed during the experiment and to look toward the same direction that the binaural head was oriented during the recording.
The data collection included a questionnaire and physiological measurements. After each scene, the participants were asked about their experience, using self-report evaluation as an indicator of the emotional impact on the listener of the combined chant and space acoustics. The self-report included asking the participants to describe their auditory experience while listening to the recordings and rate the intensity of the emotional impact (broken down into spiritual and calming) they felt listening to each one using a five-point ordinal-category scale (1. None, 2. A little, 3. Moderately, 4. Quite a bit, and 5. Highly). Spiritual and calming emotion categories were selected because they are both linked to the spiritual experience in the literature, and they represent different levels of emotional arousal (the first is associated with high and the second with low arousal). 23
The participants were also asked to select words that best represented their experience from the following list: sad, tense, nostalgic, spiritual, inspired, cheerful, and thrilled; the order of the words was randomized.
Next, the participants were asked to report their familiarity with Islamic recitation and with Christian hymns (1. Not familiar, 2. Familiar, 3. Very familiar). They were also asked to report the frequency with which they attended events at which they listened to similar religious chants as an indicator of familiarity with similar acoustic environments by selecting from the following list: (1. Never, 2. Rarely, 3. Occasionally, 4. Frequently).
Previous research on the emotional effect of music suggests that there are aspects that depend on the individual’s cultural background and their past association with such music alongside some common aspects of human experiences that result from listening to a piece of music. 45 Thus, an open-ended question that asked the participants to describe their experience freely in their own words was included to collect more subjective data about their experiences.
In addition to the questionnaire, physiological measurements were collected using a wristband biometric device (E4-Empatica). It includes two sensors; (1) a photoplethysmography (PPG) sensor that measures blood volume pulse (BVP) to calculate heart rate response (HRR) and (2) an electrodermal activity (EDA) sensor that measures sympathetic nervous system activity, which is linked to psychological arousal 46 (specifications in Table 3).
Data analysis
The study adopted a convergent mixed-methods approach, 47 merging quantitative and qualitative analysis. The quantitative data included the participants’ self-report ratings and the physiological responses, while the qualitative data included the participants’ self-report descriptions of their experiences while playing the recordings.
Data reliability and preparation for the physiological response measurement
Heart rate response (HRR)
To determine the most reliable section of the recording during the sessions, which lasted ±75 s, in the HRR analysis and to examine heteroskedasticity in the data, a second-order deviation threshold analysis was conducted following Schubert’s approach.23,48 The reliability evaluation involved calculating the first standard deviation (SD1) of sample-by-sample HRR, then calculating the mean of SD1 and SD2 from this mean, which is called the second-order standard deviation. Then, a threshold of significance was calculated based on the following equation:

In which M is the mean of SD1; SD2 is the second-order standard deviation, and K is a coefficient that is less than or equal to one. K can be adjusted based on the principle of evaluation conservation: the larger the number, the more conservative the evaluation. For this research, the reliability threshold was calculated considering that K = 0.5. After calculating the threshold, a sample-by-sample HRR was inspected to determine which section best satisfied the threshold limit. Based on the analysis, a section that starts after 20 s from the onset and lasts for 30 s was selected. The selected length of time is sufficient to capture possible physiological responses, based on previous studies. 42
Furthermore, additional analysis was conducted after standardizing the initial heart rate and calculating the increase and decrease of HRR based on the initial measure for each session. To minimize the possible autocorrelation effect, another analysis was conducted after down-sampling the data, similar to the process described in previous research by Luck et al. 44 For this study, the data were down-sampled by selecting a sample every 3 s.
Electrodermal response (EDR)
To assess the reliability of the EDR data, the results were inspected to ensure that there was no value of less than .01 μS, which is the minimum EDR valid value. 46 Accordingly, the data for participant 19 was excluded from the EDR analysis after finding results of 0 μS in one of the sessions, which might have been the result of a movement that caused the electrodermal activity sensor to disconnect for a short period.
Researchers used electrodermal tonic and phasic responses to indicate the existence and intensity of emotional impact. 49 The electrodermal response is dependent on many individual variables, which include the basic tonic level. 21 A significant difference in responses among participants was found. For example, the responses for the eight sessions within one participant might be different but cluster around a low EDR, while they might cluster around a high EDR level for another. Since EDR is sensitive to the participant’s hydration level, 46 this could have been the reason for the vast difference in EDR between subjects. Since this research is a within-subject study, the data were standardized following the guidelines of previous studies,40,49 using the following equation:

where EDR x1 is the electrodermal response for the participant at a particular sample, EDR x2 is the electrodermal response for the participant after standardization, and EDRmin and EDRmax are the minimum and maximum electrodermal responses for the same participant over all eight sessions.
Quantitative data
The quantitative data for this study component consisted of self-report, heart rate response (HRR), and Electrodermal response (EDR). The independent variable was represented in the acoustic characteristics added to the base case (dry recording), which resulted in the wet recording. The dependent variables included the ratings in the self-report and the heart rate and electrodermal activity for the physiological response. Using R-studio software, Wilcoxon Rank-Sum tests were conducted, with paired comparisons for the self-report ratings of dry and wet recordings, and Kruskal–Wallis tests to compare the self-report ratings for the wet recordings of all the buildings. Then, the same analysis was repeated for the physiological responses. In addition to the statistical analysis, which provided an interpretive approach to the physiological results, the research included a descriptive approach that included inspection of sample-by-sample central tendency, and individual response inspections to examine the dynamics and patterns of the physiological response as an indication of emotional impact, as recommended by Schubert. 50
The study also included keywords analysis representing selected emotions from the survey. The number of selections of each word was compared between dry and wet recordings and among the four buildings.
Qualitative data
The qualitative data were analyzed using thematic analysis; a method used to analyze qualitative data by identifying common themes within the data. 51 It involves developing codes that correspond to the emerging themes, then analyzing the relationship between the codes to interpret the data. 51
After reading the participants’ descriptions of the dry and wet recordings of all the buildings (160 answers) and coding them elaborately, more than 20 codes emerged. Then, clusters of the codes were identified and grouped based on their common broader concepts, creating three main themes “the influence on auditory perception,” “audiovisual congruency,” and “the emotional impact and familiarity.”
Next, another investigation phase was conducted on the data to explore any additional links and gathered the participants’ answers within each theme and placed them in two groups; the dry recordings and the wet recordings. This step allowed to examine the respective effects of listening to the dry and wet recordings across all buildings. Later, the data within each theme were analyzed to highlight the most critical factors that the participants explained.
Lastly, after analyzing the qualitative data, they were combined with the quantitative data for possible new insights, and the qualitative data were used to explain some of the results from the quantitative data.
Results
The following sections present the quantitative and qualitative results that answer the research questions related to studying (1) the impact of the acoustic environments on emotion considering audiovisual congruency; (2) the intensity of the emotional impact in different acoustic environments; (3) the intensity of the emotional impact based on the cultural background and familiarity.
Quantitative results
The impact of acoustic environments on emotion
Self-report
The results from the self-reports showed that the ratings of the wet recordings were higher than the dry recordings in all buildings (Figure 4). The average rating for spiritual emotion category in dry recordings in each building ranged between 2.4 and 2.6. The average ratings for the wet recordings showed larger variation between the buildings (20%) than ratings of the dry recordings (4%). For example, the average rating for the wet recordings were (4 for A1) and (3 for A2), and for the dry recordings (2.5 for A1) and (2.6 for A2). This confirms the control of the impact of the visuals in the ratings and indicates that the variation in the ratings of the wet recordings mainly was based on the acoustics because if the influence of the visuals was dominant, it would have resulted in a significant difference in the ratings of the dry recordings as well.
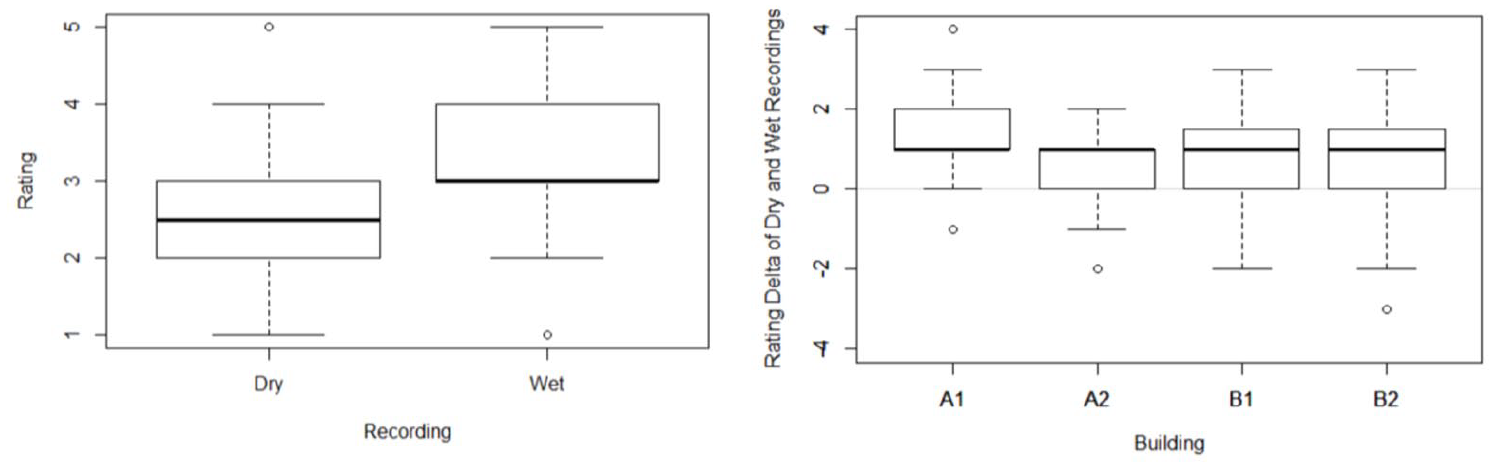
Boxplot of the ratings. Left: the intensity of spiritual emotions for wet recordings for all buildings combined. Right: the delta of ratings of the intensity of spiritual emotions for each building.
Comparing the ratings of the intensity of spiritual emotions while listening to the dry and wet recordings using Wilcoxon Rank-Sum test showed significant differences for all buildings except B2 (A1: p-value <0.001, A2: p-value <0.05, B1: p-value <0.05, B2: p-value >0.05). However, comparing the ratings of the intensity in the calming emotion category did not show significant differences except for A1 (A1: p-value <0.01, A2: p-value >0.05, B1: p-value >0.05, B2: p-value >0.05).
The results of the keyword self-report showed that participants reported more positive emotions such as “inspired,” “cheerful,” and “thrilled” while listening to the wet recordings in comparison to dry recordings (Figure 5). Spiritual emotion showed the most significant difference in the number of times reported after listening to dry and wet recordings, respectively, with the higher number associated with wet recordings.
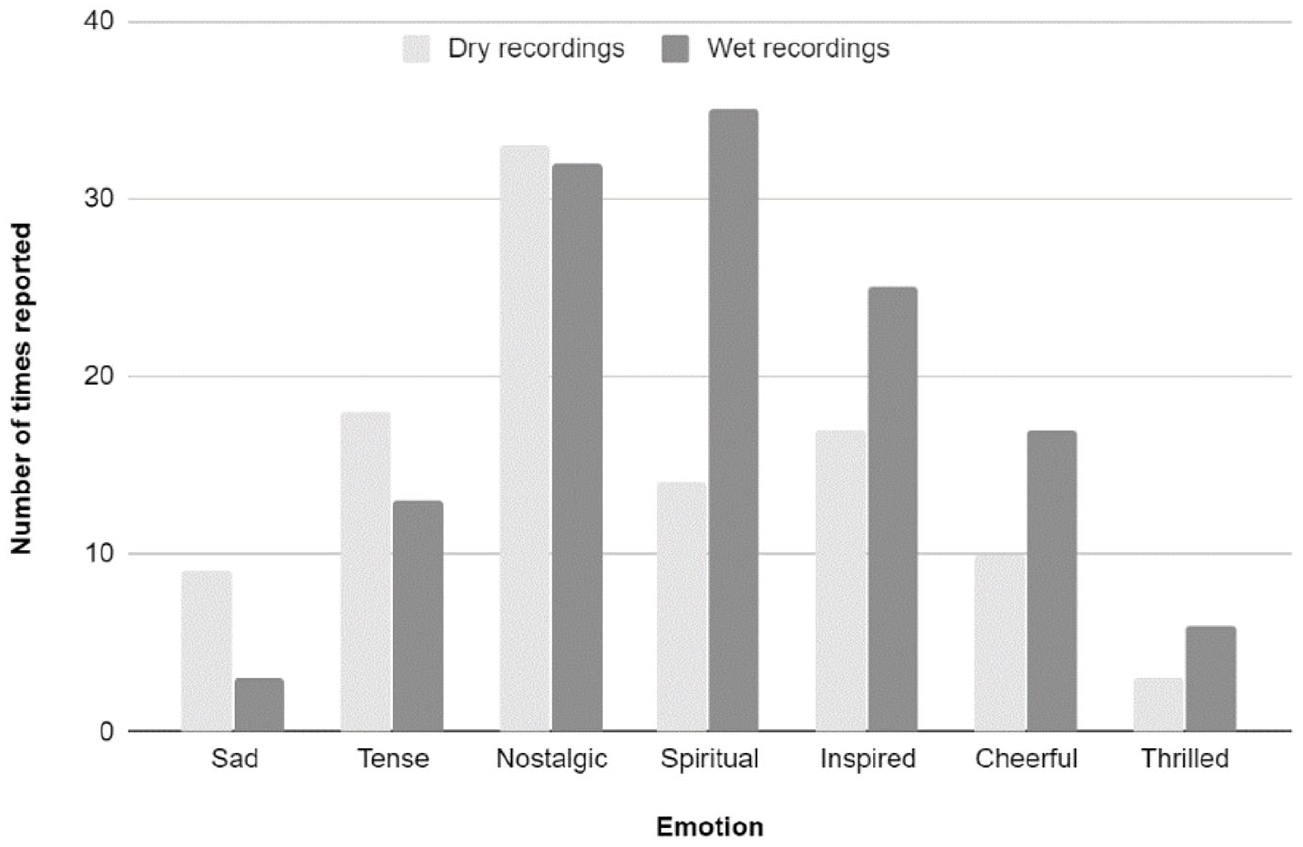
Bar-chart of the cumulative number of times each emotion keyword was reported by participants while listing to the dry and wet recordings in all buildings.
Physiological response
The results for the physiological response sample-by-sample central tendency showed that the average heart rate of the participants while listening to the wet recordings was in general higher than while listening to the dry recordings.
Comparing the participants’ heart rates while listening to the dry and wet recordings using Wilcoxon Rank-Sum test showed significant differences for all buildings (A1: p-value <0.05, A2: p-value <0.05, B1: p-value <0.001, B2: p-value <0.001); approximate median differences in HRR were A1: 2, A2: −1, B1: 5, B2: 3. These results represent the most reliable section of session time, which starts 20 s after the beginning of the session and lasts for 30 s.
The results for of the standardized initial start heart rate for the whole session while listening to the dry and wet recordings, analyzed using the Wilcoxon Rank-Sum test, were also significant (A1: p-value <0.001, A2: p-value <0.001, B1: p-value <0.005, B2: p-value <0.001), and after down-sampling (A1: p-value <0.005, A2: p-value <0.05, B1: p-value >0.05, B2: p-value <0.05).
The analysis of the skin conductance tonic level in each session while listening to the dry and wet recordings using the Wilcoxon Rank-Sum test showed significant differences for A1 and B2 (A1: p-value <0.001, A2: p-value >0.05, B1: p-value >0.05, B2: p-value <0.001).
Pearson correlation has been conducted to study the correlation between the physiological responses (HRR/EDR) and self-report responses, and the results showed no significant correlation (p-value >0.05). A possible explanation is that self-report is a post-performance evaluation, while the physiological measurement (HRR/EDR) is considered a continuous (time-dependent) response.
The intensity of the emotional impact in different acoustic environments
The result of comparing the self-report ratings of wet recordings in all buildings using the Kruskal–Wallis test was p > 0.05 for spiritual and p < 0.05 for calming. A1 received the highest rating for both spiritual and calming emotions.
When comparing the HRR and EDR while listening to the wet recordings of each building for the same selected time section, the Kruskal–Wallis test showed a significant difference (p-value <0.001), with medians ranged from highest to lowest as follows: B2 > B1 > A2 > A1 for HRR and A2 > B1 > B2 > A1 for EDR.
When analyzing the number of times the participants reported the same keyword (spiritual) while listening to the wet recordings of each worship space, the results showed that they reported the spiritual emotion the most significant number of times while listening to the wet recordings of A1 (Figure 6).
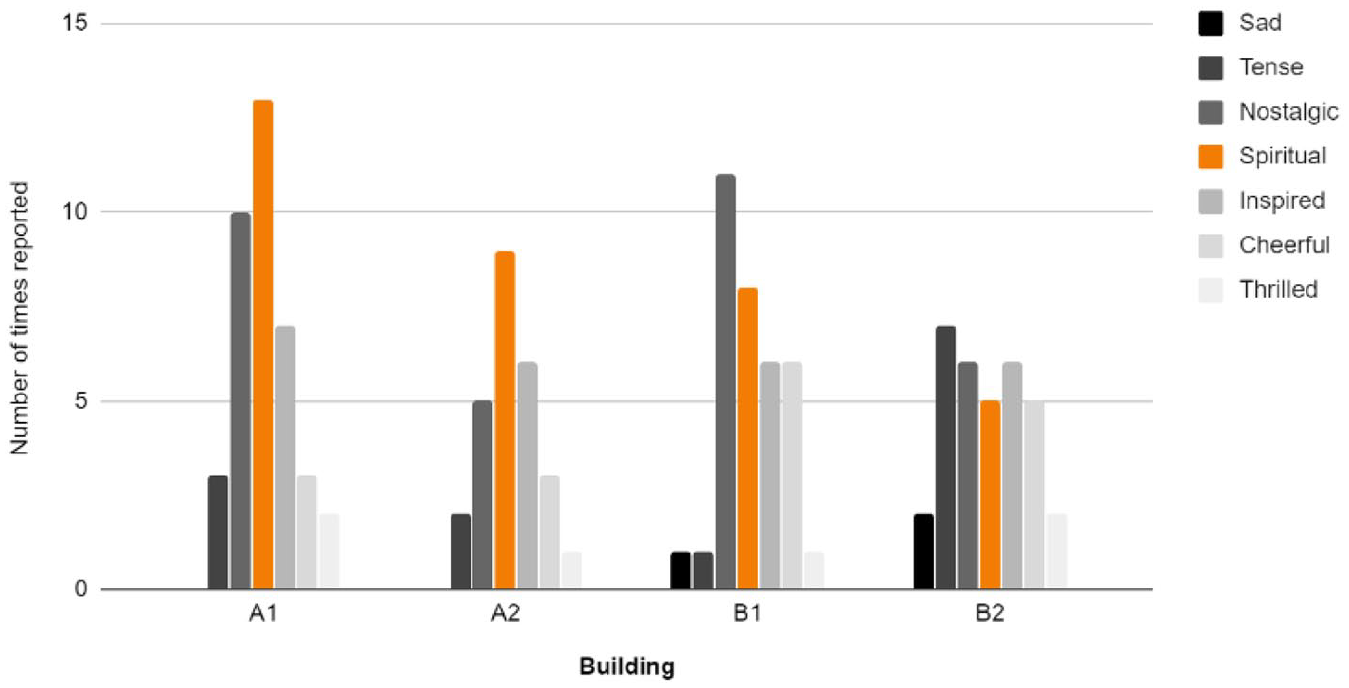
Bar chart of the number of times each emotion keyword was reported by the study participants while listing to the dry and wet recordings in all buildings separated.
The intensity of the emotional impact based on the cultural background and familiarity
In terms of familiarity with the recording content, the results for the Islamic recitation were (not familiar = 50%, familiar = 20%, very familiar = 30%), and with the Christian hymn (not familiar = 15%, familiar = 45%, very familiar = 40%). The results for familiarity with the space and acoustic environment showed that the participants’ frequency visiting the same kind of worship space for mosques was (never = 50%, rarely = 25%, occasionally = 0%, frequently = 25%), and for churches (never = 35%, rarely = 30%, occasionally = 30%, frequently = 5%). A correlation analysis was conducted to check possible bias in the data, and no significant correlation was found between familiarity and demographic information of the participants, including gender and age group.
The results of the familiarity questions, which were intended to address cultural background influence on emotional impact, showed that participants who reported high familiarity with the recorded content (recitation/chant) reported a higher level of emotional impact (Figure 7) and responded with a higher HRR (±10 points higher).
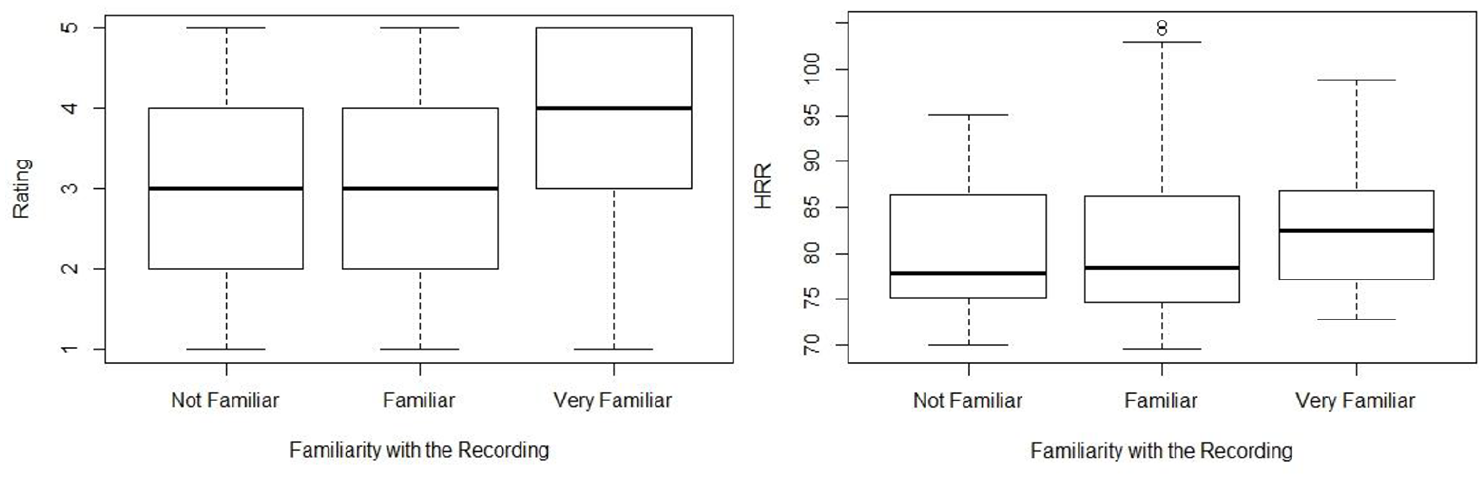
Boxplot of the ratings of the intensity of spiritual emotions (left) and heartrate response (right) based on familiarity with the same kind of religious recording.
Self-report results were similar for participants familiar with the space/acoustic environment (Figure 8). HRR results showed that participants who reported they never or rarely visited a similar religious space responded with a higher heart rate than those who occasionally visited by ±4 points. Meanwhile, participants who visited frequently responded with a heart rate close to those who never or rarely visited such a space.

Boxplot of the ratings of the intensity of spiritual emotions based on familiarity with the same kind of worship spaces.
Another observation that can be analyzed further in future research is the similarity in the patterns of HRR while listening to the dry and wet recordings despite the difference in their level (Figure 9). Given that the dry recording was used as a baseline to study the emotional impact resulting from the acoustic environment, Figure 9 provides evidence that the acoustic environment increased the intensity of the emotional impact. This can be explained by considering that the pattern represents the emotional response that results from the musical characteristics of the chant, and the difference in the response level represents the intensity of the emotional impact, which is higher with the wet recordings.
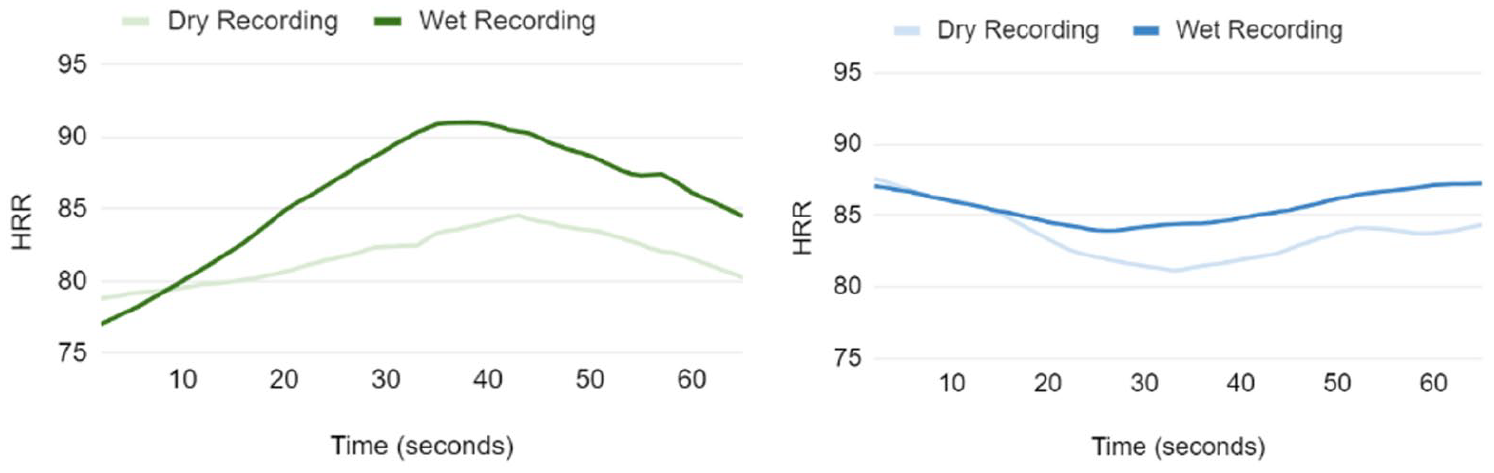
Left: The heart rate response of participant 20 during the dry and wet recordings of A1. Right: The heart rate response of participant 4 during the dry and wet recordings of B2.
Qualitative results
The themes that emerged from the analysis included “the influence on auditory perception,” “audiovisual congruency,” and “the emotional impact and familiarity” (Table 4). In addition, the analysis showed that the participants focused more on describing emotions (such as spiritual, calming, nostalgic) when listening to the wet recordings more than the dry recordings.
The emerging codes, concepts, and themes resulted from the thematic analysis.

The following provides more details about each of the themes that appeared, based on the participants’ descriptions:
The influence on auditory perception
With the wet recordings, the participants described the sound as echoey. Some also mentioned that the echo added more harmony to the piece; as participant 17 described it, “because of the echo—although they are not very good singers—I felt more harmonized about the songs.” In one case, the subject thought that there was a musical instrument in the wet recording. Others thought that the speed of the performance was different, as participant 5 mentioned: “This singer was slower and he was taking time while praying while the first was more rushed. I felt I was praying with him. I felt very spiritual.” In some cases, the participants thought that the dry and wet recordings included different pieces, which calls for further research on the possible effects of reflection-based sound illusions.
The audiovisual congruency
The participants mentioned the disconnection between audio and visuals because it did not fit the space. In contrast, when they listened to the wet recordings, they described the sound as surrounding them, making it hard to localize the sound source, as it seemed to be coming from everywhere. They also mentioned that the echo made it feel spacious, and described the experience as immersive, providing a sense of belonging and inviting to participate.
The emotional impact and familiarity
The majority of participants described their experience with the wet recording as more calming and spiritual, and in many cases, nostalgic, as one of the participants stated: “The sound felt more holy and sacred. Nostalgic. Reminded me of my own church experience. It was holy because of the ambiance and echoing by the wall.” Although the participants had diverse cultural backgrounds, they mentioned that listening to the wet recording brought memories of religious events even when listening to unfamiliar chanting from a different religion. Some of the participants expressed intense although varied emotions (uplifting, awe-inspiring, mysterious, and in one case, horrific).
Discussion
This study adopted an integrated, mixed-methods approach that included collecting self-report and physiological responses to investigate the emotional impact of acoustic environments, using worship spaces as a case study as they allow for additional exploration of the role of cultural background in the intensity of the emotional impact.
The role of the acoustic environment in enhancing the emotional impact
The results showed that wet recordings were generally rated higher in terms of intensity of spiritual emotions than dry recordings. This result was confirmed by the physiological response data, using both HRR and EDR. The average sample-by-sample HRR for the wet recordings was higher than for the dry, in general. Additionally, studying the dynamics of the HRR showed that heart rate continues to increase above the initial point for at least the first 20 s with the wet recording, to levels larger than with the dry recordings. The statistical analysis also showed a significant difference between HRR during the dry and wet recordings.
Although it is possible that the result of the comparison between the emotional impact of the dry and wet recordings may have been impacted by audiovisual congruency in addition to the characteristics of the acoustic environment, the researchers considered including the visual an acceptable compromise since there is no conflict between the two points. To illustrate, in worship spaces where artificial sound systems are used excessively to treat sound defects such as improving clarity or reverberation, the result is an auditory experience that lacks audiovisual congruency. The first research question of this study aims to investigate the emotional impact of the acoustic environment resulting from the sound reflections from the space’s architectural surfaces (which will naturally result in audiovisual congruency). The researchers are comparing it with the emotional impact when there is a lack of acoustic characteristics of the space and, therefore, a lack of audiovisual congruency. Thus, although the visuals do not match the dry recordings, holding the visuals constant while listening to the dry and wet recordings was necessary to control the possible effect of changing two variables. Alternatively, the researchers would have to eliminate the visuals. Since this research aims to study the acoustic environment resulting from architectural surfaces with visual attributes, including them was necessary. Previous research has followed a similar protocol by using simulation. Västfjäll et al. 52 studied the emotional impact resulting from different reverberation times while holding the visual render of the space constant. The present study follows a similar approach using 3D recorded audio and 360° visuals captured from the real environment.
Furthermore, the comparison of wet recordings of the four buildings showed a statistically significant difference in physiological response and self-reported rating of the emotion “spiritual.” However, it was less significant for the emotion “calming.” Since the acoustic environment of each building caused a different response, this result encourages further exploration of the contribution of architectural design in creating acoustic environments that impact the emotional intensity and possibly emotional category. Considering that each of the buildings has a specific reverberation time based on its architectural design, and given that researchers stated that varying the length of the reverberation time using simulation models is shown to evoke different emotional responses, 52 studying other acoustic parameters associated with specific emotional responses will provide guidance for designing spaces that enhance the occupants’ experience. The results of analyzing the acoustic parameters of the case studies used in this research (such as reverberation time, sound strength, resonance), and their correlation with reported emotional impact have been analyzed and will be published in a future paper.
In addition, the analysis of keywords showed that wet recordings evoked more positive emotions than dry recordings. This result was confirmed by the participants’ descriptions of their experiences in the qualitative analysis. Positive emotions mentioned, such as calming, uplifting, awe-inspiring, and, mostly, spiritual dominated while listening to the wet recordings. Furthermore, the keyword analysis revealed additional information related to the type of emotional impact in addition to the intensity. To illustrate, the building for which the highest intensity of spiritual emotional impact was reported was A1; however, the one that showed the most significant results for the physiological response was B2. When looking at the keyword analysis, we notice that for A1, the word “spiritual” was reported 13 times while it was reported only five times for B2. This difference does not necessarily mean a conflict between the results of the self-report and the physiological response. In fact, it shows the value of combining both for a deeper understanding of emotional impact. The physiological responses show the intensity of the emotional impact, and the self-report results provide details about the type of emotion, as will be explained next.
We mentioned earlier that physiological response provides an indicator of emotional arousal 39 without giving detailed information on the relevant emotional categories. Emotional arousal includes emotions such as excitement, inspiration, and even tension in addition to spirituality, and these emotions vary in terms of their level of arousal, with spiritual emotions generally lower than excitement. The physiological response might be an indication of such a combination of emotions, and the level of physiological response to B2 might be explained by other high arousal emotions. This also calls for consideration of the impact of acoustics to amplify the intensity of the emotion based on the background and memory related to it. For example, the participant who had a feeling of horror mentioned that the echo was similar to (one in) horror movies. In contrast, another participant mentioned that the wet recording brings back memories of worship places, even ones that are not necessarily worship spaces of the same religion, as explained in the next section.
The role of familiarity of the acoustic environment in enhancing the emotional impact
The analysis of the impact of the cultural background revealed that high familiarity increases the intensity of the emotional impact based on the participants’ self-report and the heart rate response. These results are in agreement with research in music and emotions, which suggests that music can evoke emotions regardless of familiarity; however, the intensity of the emotional impact can increase with familiarity. 45 The self-report showed that participants who were very familiar with the recording and space rated spiritual emotion intensity higher than all others. On the other hand, the physiological response also showed that participants unfamiliar with the recording responded similarly to those who said they were “very familiar” with the material, and both responded higher than those who said they were “moderately familiar.” This result can also be explained: the high physiological response could be a result of high arousal emotions other than the spiritual emotions mentioned above, such as excitement caused by surprise or unfamiliarity.
The additional analysis of the individual responses provides more details regarding the dynamics of the emotional impact during the session. For instance, the similarity in the patterns of HRR response during listening to the dry and wet recordings despite the difference in their level calls for further research to study the dynamics of change in the physiological responses based on the characteristics of the recording in each session, such as its frequency component.
Future research can take another step forward by investigating the impact of the frequency component in the two types of recordings and its relation to the intensity and type of emotional impact. For example, some of the participants compared dry and wet recordings and mentioned that the sound reflections in the wet recording made the chant seem more harmonized. Which is in agreement with previous research that reverberation time can lead to sound harmonization created by blending musical notes. 26 The balance in blending direct and reflected sound creates an esthetically appealing aural experience that enhances the emotional effect. 7 Thus, analyzing the contribution of design and architectural features in reinforcing different ranges of frequencies may result in the creation of a sound illusion or reduction of sound defects that can also allow for the achievement of better acoustic environments, based on the improvement of the space design.
Strengths and limitations
This study provides a method for assessing the potential emotional impact of acoustic environments. It demonstrates the role of evaluating aural aspects and their impact on the occupant’s emotions and experience while designing buildings—especially when sound is an integral component of activities in the space. The research also examines the role of the cultural background in amplifying the emotional impact of a space.
While this research adopted worship spaces as case studies, this approach provides new insight into the role of cultural aspects in shaping the occupants’ experience since sound perception is influenced by the listeners’ previous experience of sound events and sound environments. 53 Further research using other building types will allow investigating the possibility of generalizing the results to other building types in which acoustic environment may impact emotions and enhance well-being.
Also, the study included binaural recording, which is according to the International Organization for Standardization ISO/TS 12913-2:2018 standard is the most well-established method for analyzing human perception. 54 The binaural recording provides a three-dimensional sensation that takes into account the sound direction and the acoustic shadow resulting from the head; however, it did not account for head movement. Since the study used the same recording method in all buildings and the participants were instructed to look in the same direction that the binaural head was oriented during the recording, it is not expected to impact comparing cases in the analysis. Nevertheless, the researchers have collected ambisonic recordings that work with head tracking for future research to provide a more realistic representation of the acoustic environment that allows for head movement. In addition to head tracking, this can be taken a step further by including an ambisonic walkthrough recording, representing the 3D sound accompanying the 360-walkthrough video to study the soundscape.
Conclusion
This study has investigated the emotional impact of the acoustic environment and how it shapes the auditory experience in addition to examining its links to its cultural background. The physiological response provided an indication of the intensity level of the emotional impact and the self-report provided a description of the emotional category. The findings showed that the acoustic characteristics of the space can increase the intensity of the emotional impact and enhance the listener’s experience considering audiovisual congruency. The self-report results revealed that the intensity of this impact can be further increased based on the listener’s familiarity with a similar acoustic environment, but the HRR results did not show the same pattern. In addition, both self-report and HRR results indicated that the familiarity with the recording (chant) enhance the emotional impact.
The study also demonstrated the significance of considering the visual attributes of the architectural design while designing an acoustic experience to support the emotional experience in buildings such as worship spaces, given that the excessive dependence on the sound system creates an acoustic environment that does not match the expected sound reflections based on the architectural design.
The method developed in this study can be used to assess the potential emotional impact of acoustic environments. Furthermore, the visual and aural documentation and playback methods applied in this study can be used to design multisensory VR representations in museums since the acoustic heritage is an integral component of cultural heritage, as suggested in previous research.53,55
In addition, given the impact of the cultural background and familiarity with the acoustic environment in enhancing the emotional impact, considering the architectural features that contribute to creating similar acoustic characteristics in designing spaces where the cultural aspect plays an important role is essential.
Since the intensity of the emotional impact varied in the studied acoustic environments, further studies linking emotional impact with acoustic parameters will allow for a better understanding of how our perception of an acoustic environment is shaped by the physical aspects of sound propagation in spaces. Besides, studies of the architectural characteristics that created such an acoustic environment, resulting in supportive emotional impact, will help architects design better spaces in which acoustics are essential to the experience, such as worship spaces, performance spaces, meditative spaces, and museums.
Footnotes
Acknowledgements
Many thanks to Professors Claire Zimmerman, John Granzow, and Upali Nanda from the University of Michigan for their guidance through the research process. Also, thanks to Professor Hany Hossam Eldein from Imam Abdulrahman Bin Faisal University for providing the anechoic recording of the Islamic recitation, to the community leaders for participating in the recording of the Christian hymn, to the participants for taking part in the experiment, to the religious centers for providing access to do the recordings in buildings, and to the reviewers for providing valuable feedback.
Declaration of conflicting interests
The author(s) declared no potential conflicts of interest with respect to the research, authorship, and/or publication of this article.
Funding
The author(s) disclosed receipt of the following financial support for the research, authorship, and/or publication of this article: This work was supported by the Andrew W. Mellon Foundation through the Michigan-Mellon Project on the Egalitarian Metropolis; the Rackham Graduate School through Barbour Scholarship; the Graham Sustainability Institute at the University of Michigan and Dow Chemical Company through the Dow Fellowship; and the Arts Engine at the University of Michigan through an Arts Integrative Interdisciplinary Research Grant.
*
This research was part of a doctoral dissertation (Algargoosh A. Aural Architecture as Affect: Understanding the Impact of Acoustic Environments on Human Experience. University of Michigan, 2021).