



Abstract
The main objective of this study is to evaluate the acoustic behaviour of composites made by mixing cellulose acetate, from recycled cigarette butts, with polymers such as polyethylene and polypropylene, from recycled plastic containers and surgical masks, respectively. For this purpose, the spectra of the measured sound absorption coefficients and the calculated NRC and SAA indices of samples with thicknesses of 1.5, 3, 4.5, 6 and 7.5 cm are analysed. The results of both experiments reveal that the studied composites present a sound absorption capacity comparable to that of fibre glass and rock wool, being even more efficient for thicknesses greater than 4.5 cm. Moreover, the acoustical properties of the composites are predicted using the Miki model over the frequency range from 100 to 6400 Hz, showing very accurate predictions of the sound absorption spectrum at normal incidence.
Keywords
Introduction
Current population growth, 1 coupled with market growth, 2 is leading to an increase in waste generation, which is a major environmental problem and a very harmful health risk. One of the most common waste products in the world is cigarette butts (CBs), with between 340 and 680 million kg of CBs generated annually. CBs generate more than 40% of the waste collected in beach and coastal environments.3 –6 The issue with these waste is the presence of toxic substances it contains, hence the need to find a sustainable alternative solution to conventional ones such as bury in a landfill or incineration.7,8 Cellulose acetate is the main component of CBs, hence the presence of studies analysing its potential as a source of cellulose derivatives. 9
Another of the most ubiquitous wastes is plastic, which is present in sectors such as medicine, construction, textile, transport, electronics and industry, among others. More than 300 million tonnes of plastic are produced annually worldwide, and this figure is expected to rise to 800 million tonnes by 2040 and 1.1 billion tonnes by 2050.10,11 One of the factors contributing to the exponential increase in plastic has been the emergence of the COVID-19 outbreak, which has led to the generation of a large amount of medical plastic waste (masks, gloves, etc). Most of these wastes, which is not incinerated, accumulates in landfills or oceans, causing severe environmental problems. 12 Polyethylene and polypropylene rank first and second in terms of use, respectively, comprising almost 30% of post-consumer use. 13
When we talk about pollution, we are not only talking about the storage of waste such as those mentioned above. There are other types of pollution such as light, electromagnetic or acoustic pollution which do not produce waste but, in the same way, generate severe environmental issues. As far as environmental noise pollution is concerned, mainly due to the global increase in industrialisation and urbanisation, one of the methods to alleviate this is using different materials for noise control applications. The most common sound absorbers used for this purpose are mineral fibres, such as rock wool14 –16 or fibre glass17,18 and different types of foams.19 –22 Moreover, there is currently a trend towards the use of recycled natural fibres as sound porous absorbers, with potentially efficient results.23 –31
The aim of this work is to generate an alternative for the recycling of these wastes. For this purpose, a series of composites are made by mixing these waste, and their acoustic behaviour is studied to analyse their efficiency with respect to existing materials on the market, such as glass fibre and rock wool. Finally, the sound absorption spectra obtained for these composites were compared with those obtained for other bio-based composites made of recycled natural fibres, currently developed and used in green building sector, and substituting the traditional ones.
Materials and methods
Composite materials
Cellulose acetate (CA), polyethylene (PE) and polypropylene (PP) were used to make the composites. The first was obtained after the collection of different cigarette butts, a first cleaning process in distilled water stirred at 50°C for 1 h, and a subsequent purification process 32 to remove chemicals absorbed by the cellulose acetate such as metals, nicotine or benzene. 33 Finally, they were shredded to expand the compressed fibres. The second was obtained by shredding waste plastic containers and bottles and then sieving them to obtain particles smaller than 1 mm. The third was obtained by shredding surgical masks that had previously undergone a process of disinfection and elimination of rubber and metal nasal fittings. The disinfection process consisted of a first heating procedure for 30 min in a vacuum oven at 70°C temperature, with a relative humidity of 80%; and a second heating procedure at 80°C and 0% relative humidity, for 12 h. 34 Once the different materials had been obtained, the different composites were made by mixing cellulose acetate with polyethylene, on the one hand, and polypropylene, on the other, with proportions of 60/40 in mass, respectively (Figure 1). Fibre glass (FG) and rock wool (RW) were also used as materials for this work. Samples of different thicknesses and densities were obtained.
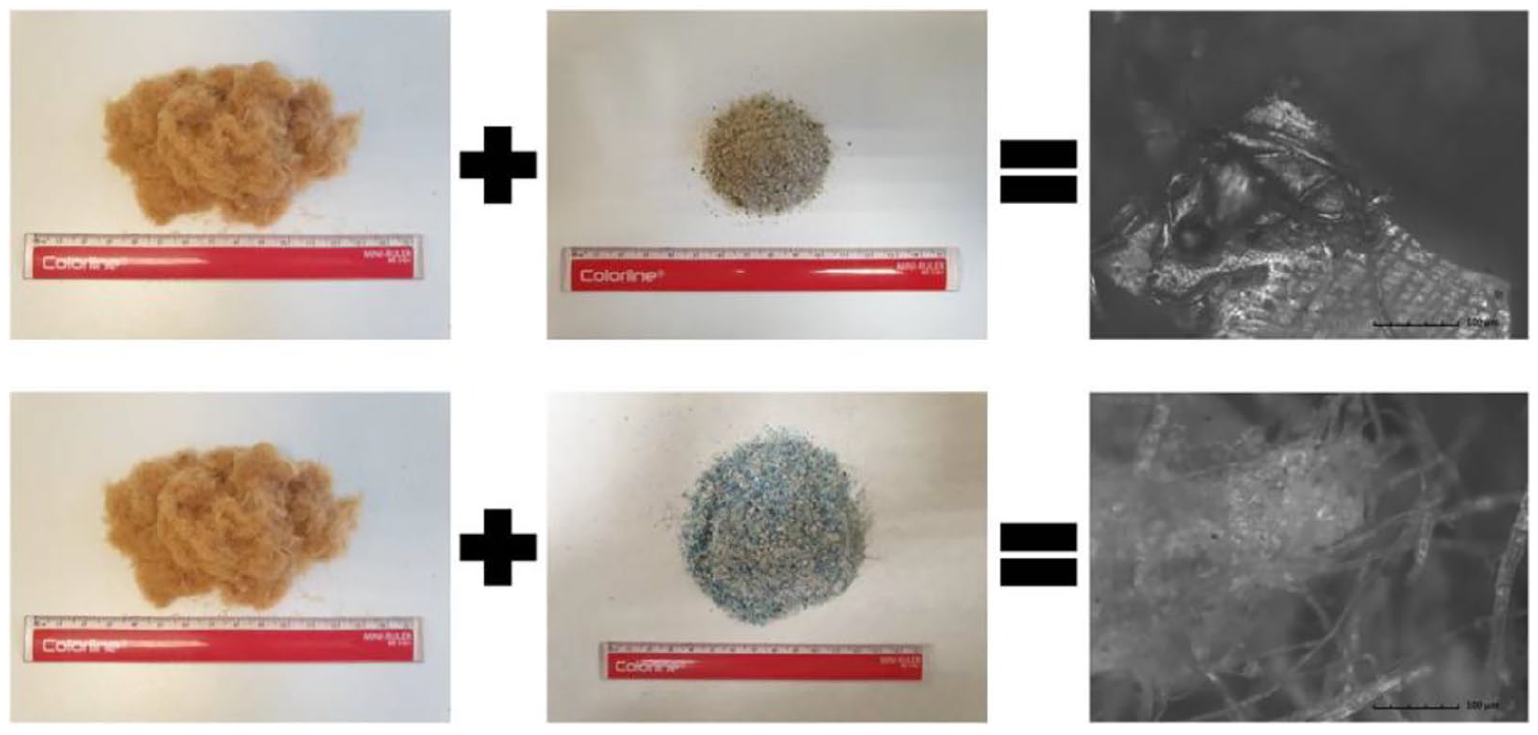
Materials used to make the composites and microscopic image of these composites.
Non-acoustical properties
Open porosity is defined by the relationship between the volumes of the material frame and the interconnected pores. It was obtained using equation (1):

ρm is the bulk density of the sample (kg/m3) and ρs is the skeletal density of the porous material (kg/m3). Bulk densities are obtained using a helium pycnometer (Quantachrome SPY-3) with a calibrated cell having a volume of 35.39 cm3. Each sample is measured three times, and the average value of the final bulk density is reported. The skeletal density was also calculated by dividing the sample’s weight by its volume. The open porosity, thus evaluated, presents very accurate values because helium, due to its small atomic dimensions, can enter into those pores where the air is not able to penetrate. The flow resistivity (FR), defined as the resistance experimented by the air flowing inside a porous material, was measured experimentally according to the method of Ingard and Dear. 35 Tortuosity, a dimensionless structural parameter that indicates how direct the path is taken by the sound wave inside the porous absorber, is evaluated using an empirical equation (2) in terms of porosity ϕ, 36 as follows:

Acoustical properties
The Sound Absorption Coefficient (SAC) of the samples was determined using the method specified in ISO 10534-2. 37 The instrumentation used was the Brüel & Kjær impedance tube type 4206 and the Brüel & Kjær PULSE signal analyser. The measurement process is based on the use of a 10 cm diameter tube, for measurements in the frequency range 100–1600 Hz, and a 2.9 cm diameter tube, for the frequency range 500–6400 Hz. The sound absorption capacity was evaluated using the Noise Reduction Coefficient (NRC) and Sound Absorption Average (SAA) indices, as defined in ASTM C423-17. 38 The NRC is defined as the average of the SACs for the 250, 500, 1000 and 2000 Hz octave bands, rounded to the nearest multiple of 0.05:

And the SAA as the average of the SACs for the 12 one-third octave bands from 200 to 2500 Hz, rounded to the nearest multiple of 0.01:

Theoretical modelling
In recent years, theoretical modelling of sound absorption coefficient has been developed to obtain the acoustical performance of sound fibrous absorbers. One of the most widely used models is the Delany-Bazley model, 39 which uses a large amount of experimental data with a wide range of flow resistivity of fibrous materials and is quite accurate for open porosities close to 1. In this model, the complex wavenumber and the characteristic impedance depend on measurements of the flow resistivity. Indeed, the unique input parameter is the flow resistivity, which highly depends on the density of the fibrous material. However, this model suffers from good accuracy, especially for frequencies below 400 Hz 40 where the model can sometimes predict non-physical results, showing negative values of the sound absorption coefficient. This important issue was resolved by the Miki model.41,42 In this model, Miki suggested some changes in the coefficients of the Delany-Bazley model, using the same experimental data from the latter, from better predictions at low frequencies regarding porosity, tortuosity and the pore shape factor ratio. 43 With the use of this model, it is possible to obtain good predictions of the sound absorption coefficient of complex fibrous media (5). It can be expressed as follows:



where σe is the effective flow resistivity.
To predict the normal-incidence sound absorption coefficient of the samples a best fit inverse methodology is used. This methodology, based on an iterative numerical method to minimise the differences between the measured and the predicted sound absorption spectra, returns the non-acoustical parameters following the next equation:

where αmeas is the measured sound absorption spectrum, αMiki is the theoretical sound absorption spectrum (obtained from the Miki model for the combination of non-acoustical parameters), and fn is the frequency in the range of 100–6400 Hz. To evaluate the accuracy of this model, the mean error, EM, between the measured and the predicted sound-absorption spectra is obtained by the equation:

Results and discussion
Non-acoustical properties
Table 1 shows the physical properties obtained for different fibrous absorbers used in this work. Open porosity influences the sound absorption capability of a sound fibrous absorber due to the energy dissipation of the sound waves inside the material occurs. Therefore, the higher porosity the higher dissipation of sound energy will be, showing the fibrous material a higher sound absorption coefficient. The obtained results showed differences between the composites studied in this work and the traditional fibrous materials, providing different porous microstructures and, therefore, different acoustical properties. The porosity values of the composites were 87.04% and 89.80%, while for traditional fibrous materials these values were 96.57% and 97.05%. It was obvious that, due to a higher number of voids in the material, the higher the porosity the lower the bulk density was, and the lower the tortuosity. 31
Physical properties of the samples of the different materials studied in this work.

Table 2 shows the values of the experimental and theoretical flow resistivities values and the mean error (%). Concerning the experimental values of flow resistivities we could see that the samples of the CA + PE composite (M1–M5) had the lowest FR values, concerning the new composites, with values ranging from 25,738 to 32,257 Pa·s/m2. The samples of the CA + PP composite (M6–M10) showed values ranging from 25,887 to 88,169 Pa·s/m2. This means that the sound wave penetrated more easily into this material. Concerning the theoretical values of flow resistivities, the errors observed ranged from 0.3% to 3.8%. These results were good enough according to previous works, where the Miki model was used to predict the airflow resistivity of fibrous materials.16,44 These differences could be associated to the uncertainties when measuring experimental values of acoustical properties such as sound absorption coefficient at normal incidence.
Experimental and theoretical flow resistivity values (Pa·s/m2) of the composite samples.

Acoustical properties
After performing the measurement process explained in the previous section, the SAC curves of the different materials were obtained (Figures 2 and 3). It could be noted two distinct behaviours in the SAC spectra. On the one hand, both composites (CA + PE and CA + PP) presented a SAC that increases until reaching a first maximum and then continued with a wave-like behaviour as we shifted to high frequencies. On the other hand, FG and RW presented a steep slope until a point was reached, from which the SAC increased slightly, maintaining a practically constant behaviour. It could also be observed, for the two composites, how, as the thickness of the samples increased, the first maximum of the SAC shifted to lower frequencies, decreasing its value. Moreover, for FG and RW samples, the spectra shifted towards low frequencies, thus harbouring a larger area below the SAC curves and, consequently, obtaining a better absorption behaviour.

Measured sound absorption spectra for CA + PE (a), CA + PP (b), FG (c) and RW (d) samples.

Sound absorption spectra measured for CA + PE, CA + PP, FG and RW samples of thicknesses 1.5 (a), 3 (b), 4.5 (c), 6 (d) and 7.5 (e).
For the CA + PE composite samples, the first maximum of the SAC shifted from a frequency of 5440 Hz and a sound absorption coefficient of 0.983 (1.5 cm in thickness), to a frequency of 2240 Hz and 0.978 (3 cm in thickness), 1360 Hz and 0.935 (4.5 cm in thickness), 1040 Hz and 0.885 (6 cm in thickness) until reaching a frequency of 720 Hz with a sound absorption coefficient of 0.864 (7.5 cm in thickness). For the CA + PP composite samples, the first maximum of the SAC shifted from 3280 to 1840, 800 and 880 Hz with values of the sound absorption coefficient equal to 0.995, 0.951, 0.900 and 0.893 respectively, disappearing for sample 7.5 cm in thickness. This behaviour might be due to the heterogeneity of the sample.
At first sight, it could be noted that for samples 1.5 cm in thicknesses, the first maximum of the SAC for the CA + PP composite (sample M6) is the closest to low frequencies, followed by the maximum of the RW sample (M16), the CA + PE composite sample (M1) and the FG sample (M11). Therefore, a priori, we could establish that the CA + PP composite had the highest sound absorption capacity for this thickness. For higher thicknesses, 3 and 4.5 cm, the acoustical behaviour would be the same as for samples 1.5 cm in thickness. For thicknesses between 6 and 7.5 cm, the maximums of the two composites (M4–5 and M9–10) and those of FG samples (M14 and M15) and RW samples (M19 and M20) are equal two to two, with those of both composites being higher at low frequencies. The effect of the tortuosity is shown in the value of the sound absorption coefficient for the first maximum, where the higher the tortuosity, the higher SAC is.
Figure 4 shows the comparison between the experimental and the theoretical sound absorption spectra for the composite samples using the Miki model. The input parameters to obtain the theoretical sound absorption spectra were the measured porosity, flow resistivity, tortuosity and thickness. The mean error between experimental and theoretical sound absorption spectra using the impedance model, obtained following the equation (9), ranged between 0.8% and 3.6%. It could be noted that these results were in good agreement with the previous work of Maderuelo-Sanz, 16 where the Miki model was used to model the sound absorption performance of cellulose acetate. The higher mean error was found for the sample M9 (Figure 4(i)), where high differences between the experimental and the theoretical sound absorption spectra were shown for frequencies below 4000 Hz. Moreover, for samples M6 and M10, the mean error, with a value of 2.8%, was due to the differences of the sound absorption spectra for frequencies higher 2000 (Figure 4(f)) and 500 Hz (Figure 4(j)), respectively. This was in accordance with the differences obtained between the measured and the predicted flow resistivity, the inhomogeneity of the samples and that experimental measurements could suffer uncertainty. Nevertheless, for samples M1, M2, M3 and M5 (Figure 4(a)–(c) and (e), respectively), the predictions of the sound absorption spectra obtained using optimised flow resistivity were mostly closer with the experimental values. In these latter cases, the Miki model predicted the frequency of the peaks and the corresponding value of the sound absorption coefficient for the samples.

Experimental and predicted sound absorption spectra for composite samples M1 to M10 ((a) to (j) respectively).
To evaluate the acoustic performance of the composites with a single number rating absorption, the NRC and SAA indices of the samples were analysed (Table 3). It could be observed that the NRC and SAA increased as the thickness of the sample increased, as was expected. This is due to a greater interaction between the sound waves and the skeletal of the porous absorber when the thickness increase. Therefore, the higher the thickness, the higher the thermal-viscous effects were, so the looses of the energy were higher. 30 It could be noted that for samples 1.5 cm in thickness (M1, M6, M11 and M16), the sample with the highest NRC and SAA, and therefore the highest sound absorption capacity, was the sample M1, with values of 0.40 and 0.38, respectively. The second best sound absorbing material was the sample M16, with values of 0.30 and 0.28, respectively. Samples M6 and M11 showed a very similar behaviour, being the lower values for samples 1.5 cm in thickness, with values of 0.20 and 0.23 for the sample M6, and 0.20 and 0.22 for the sample M11. For samples 3 cm in thickness, the samples M7 and M17 became equal in terms of sound absorption capacity, showing NRC and SAA values of 0.60 and 0.57 for the sample M17, and 0.60 and 0.59 for the sample M7. Samples M2 and M12 showed an equal sound absorption capacity, with NRC and SAA values of 0.55 and 0.53, respectively. For samples 4.5 cm in thickness, the sample M9 showed the highest sound absorption capacity, with NRC and SAA values of 0.70 and 0.71, respectively. The sample M3 substantially improved its absorption behaviour concerning the previous thicknesses, obtaining values of 0.65 and 0.67, while the sample M18 did not show an improvement with respect to the previous thickness, with values of 0.60 and 0.63. For samples 6 cm in thickness, both composites showed a very even sound absorption capacity, with NRC and SAA values of 0.75 and 0.73 for the sample M4, and 0.75 and 0.76 for the sample M9. Samples M14 and M19 showed have a worse absorption performance, with values of 0.65 and 0.65 for the sample M14, and 0.60 and 0.62 for the sample M19. For samples 7.5 cm in thickness, the samples M5 and M10 showed a very similar sound absorption performance, and no improvement compared to the samples with previous thickness. The NRC and SAA values obtained were 0.75 and 0.76 for the sample M5, and 0.75 and 0.77 for the samples M10 and M15 showed an improvement concerning the previous thickness, with NRC and SAA values of 0.65 and 0.65, respectively. However, the sample M20 did not show any improvement concerning the previous thickness. If we compare these results with those obtained for other biobased composites made of different byproducts as raw materials, 41 it could be noted that the SAA and NRC results showed similar, and in many cases higher values for both indexes. For example, the case of sample M5, where NRC and SAA values are 0.75 and 0.76, respectively, could be compared with the sample RH# 41 with NRC and SAA values of 0.60 and 059, respectively, and similar in thickness.
NRC and SAA values of the different samples studied.

Conclusions
The acoustic behaviour of two different composites, manufactured by mixing cellulose acetate with polyethylene on the one hand, and with polypropylene, on the other, has been experimentally and theoretically evaluated and compared with that of fibre glass and rock wool. Ten composite samples, having different physical properties, were acoustically characterised by using an impedance tube and optimised using the Miki model. For this purpose, the sound absorption coefficients at normal incidence for composite samples were analysed and, subsequently, a comparison of their respective Noise Reduction Coefficient and Sound Absorption Average indices were carried out. The results concluded that, for thicknesses lower than 4.5 cm, the sound absorption capacity of the composites was very similar to that of fibre glass and rock wool, being even more effective in the former from 4.5 cm thickness onwards. Nevertheless, it could be noted that, at low frequencies, these composites showed low absorption with the configurations used. The Noise Reduction Coefficient and the Sound Absorption Average results suggested that these composites showed similar acoustic performance to those fibrous absorbers and bio-based composites used actually in the building sector, even having lower thicknesses. The theoretical results suggested that values of the flow resistivity, determined by making use of an inverse calculation method based on the obtained acoustic measurement results, characteristic impedance and complex wavenumber, were in good agreement with the experimental data, showing mean errors ranging between 0.8% and 3.6%.
Footnotes
Declaration of conflicting interests
The author(s) declared no potential conflicts of interest with respect to the research, authorship and/or publication of this article.
Funding
The author(s) received no financial support for the research, authorship and/or publication of this article.
