
Abstract
Although people spend most of their night-time hours indoors, environmental noise exposure is typically assessed using outdoor levels. This study examined outdoor-to-indoor noise attenuation across 49 dwellings in Greater London using synchronized and unsupervised measurements, while noise levels were expressed via the A-weighted equivalent (
Keywords
Introduction
Environmental noise exposure has been associated with negative impacts on human health, such as annoyance,1,2 quality-of-life,3,4 and various cardiometabolic outcomes.5,6 In children, continuous noise exposure may present detrimental and irreversible effects on mental development. 7 Regarding night-time residential noise exposure, significant associations have been identified with various aspects of sleep, 6 as well as with health-related outcomes and overall quality of life.8,9 During sleep activity, people not only perceive and evaluate various sound stimuli but also react to them (e.g. stress reaction, awaking episode, and motility reaction). 10 In children, sleep can be characterized as important, 11 considering the impact of sleep quality on cognitive performance. 12
Various noise indicators have been proposed for the quantification of noise exposure.
13
However, most studies focusing on children’s noise exposure rely primarily on “traditional” energy-based metrics, such as the A-weighted equivalent (
Noise exposure studies are typically conducted using outdoor noise exposure levels rather than the levels transmitted indoors from external noise sources. 14 Particularly, outdoor exposure levels are often treated as proxies for indoor exposure levels, reflecting a challenging assumption. 18 Consequently, there is a need to develop approaches that estimate the attenuation of noise from outdoors to indoors, enabling the estimation of indoor noise exposure levels from outdoor data (e.g. noise maps). A critical factor in this attenuation process is the building façade, including its components (e.g. wall or window structures), which plays a major role in sound transmission. 14 Among façade components, windows are the most significant pathways for sound energy transmission indoors. 19 The position of the window, whether open, tilted, or closed, significantly influences the amount of sound transmitted indoors, with the most notable variability observed between buildings when the windows are closed. 20 Indoor (room) acoustic characteristics, particularly reverberation time, also impact the level of attenuation from outdoor to indoor environments. Yet, current statistical approaches have not incorporated such room acoustics predictors. 14
The objective of this study is to investigate the difference between outdoor and indoor night-time residential noise exposure levels, utilizing sound level data obtained through an unsupervised measurement methodology. Although such methodologies are frequently applied in environmental noise monitoring, they present challenges in the accurate representation of indoor acoustic environments and their correspondence outdoor levels, indicating the need of applying a proper post-processing methodology. To characterize outdoor-to-indoor noise attenuation, statistical regression models were developed, facilitating the estimation of indoor exposure from outdoor measurements. Finally, this approach is intended to support epidemiological evidence of noise-induced health effects associated with outdoor-based indoor noise exposure levels.
Regarding the structure of this study, this consists of two main components. First, a methodological framework was established to integrate valid synchronized and unsupervised indoor and outdoor measurements, accounting for the influence of dominant indoor noise sources and background noise levels, to estimate outdoor-to-indoor attenuation levels. This was based on experimental data collected from 49 dwellings in Greater London, UK. Second, statistical models, including multiple and mixed-effect linear regression, were developed to predict attenuation levels using a variety of noise indicators. These models incorporated predictors from three domains: the outdoor environment (e.g. noise levels and source type), the indoor environment (e.g. room size and occupation status), and the building façade structure (e.g. window size and type).
Methodology
Selected measurement sites
Residential buildings located in the Greater London area of the United Kingdom and close to major roads, railway, and under aircraft paths of Heathrow or London City airports were selected for the conduction of outdoor and indoor noise exposure measurements.
21
Additionally, a site survey was conducted to record the type of sound sources present in each of the selected locations. Particularly, the sites were exposed to various residential noise sources, with road traffic noise constituting the primary source of disturbance (33%), and secondary exposure to a combination of aircraft, road, and rail traffic (67%), occurring during the autumn (10%), winter (51%), spring (31%), and summer (8%) seasons. It is important to note that the considered rooms were located at the ground-floor with the windows kept closed during the measurement process. In residential façade structures, 82% of the dwellings were equipped with multi-layered windows, while the remaining 18% were fitted with single-layered windows. Finally, the window structures cover surface areas ranging from 0.75 to 11.3
Study invitations were disseminated via email to Imperial College London staff and students, with the objective of recruiting participants for the study. Some of the participants were identified through existing connections with the Heathrow Association for the Control of Aircraft Noise (HACAN). It was ensured that the selected locations were residential (furnished) dwelling rooms (bedrooms) with at least one window (facing the street). During the noise measurements, all the windows were kept closed in the chosen rooms, ensuring consistent environmental conditions. Noise measurements with open and tilted windows were therefore not conducted. However, it should be noted that opening windows for ventilation or the operation of mechanical ventilation systems may be required in practice. This may result in a significant impact to indoor noise levels. 22
The suitability of setting up the monitoring system (indoor and outdoor noise sensors) in optimal positions was verified in collaboration with the enrolled participants. The minimum distance between the outdoor and indoor sensors, the security of the equipment, and the avoidance of placing the equipment near heating or air-conditioning units was ensured. In accordance with the aforementioned criteria, out of the 67 dwellings that were evaluated, 49 met the selection criteria. The dwellings included were a mix of terraced houses (45%), mid-rise flats (14%), high-rise flats (19%), semi-detached houses (10%), and detached houses (12%). Most dwellings had two (30.6%) and three occupants (28.6%), followed by those with one occupant (24.5%). A smaller proportion of dwellings housed four occupants (6.1%), while five and 6 occupants each accounted for 4.1% of the sample. One unoccupied dwelling (2.0%) was also included in the measurement campaign. The measurement campaign obtained approval from the Imperial College Research Ethics Committee, Joint Research Compliance Office (ICREC Reference: 16IC3545).
Measurement campaign
Unsupervised and time synchronized outdoor and indoor noise exposure measurements were conducted in accordance with British Standard 23 for almost three consecutive days at each location between December 2016 and August 2017, using a measurement integration time of 1 min. In particular, outdoor noise exposure measurements were taken at a distance of at least 1 m from the most exposed façade, 3.5 m from other reflecting surfaces, and at a height of 1.5 m from the ground. None of the selected locations feature obstacles such as balconies, which could have potentially obstructed the outdoor levels. Similarly, indoor noise exposure measurements were taken in furnished rooms at a distance of at least 1 m from the main window and at a height of 1.5 m from the floor. Although noise measurements were conducted for almost three consecutive days, 21 our study focused solely on measurements during the night-time period (23:00–07:00), as the background noise levels are lower in comparison to day-time and evening period. In this way, the outdoor-to-indoor noise attenuation levels can be evaluated in a representative way using the applied unsupervised measurement methodology. No individuals were present in the selected rooms during the noise measurements.
Regarding the measurement equipment, a Class 1 sound level meter (Optimus CR: 171B) was placed inside and outside with an outdoor measurement kit (Optimus CK: 670) for the outdoor measurements. Prior to measurements, each sound level meter was gaged by the manufacturer. Furthermore, an acoustic calibrator (Optimus CR: 51) was employed for the calibration of sound level meters on-site prior to the commencement of each measurement. It should be noted that audio recordings during the course of measurements were not undertaken in accordance with the terms of the ethical committee approval agreement.
Regarding the noise exposure assessment in both indoor and outdoor environments, average noise levels were calculated over 1-h and 8-h intervals during the night-time period, defined as 23:00–07:00. In particular, the 1-h interval during the night-time period is associated with the hour ranges of 23:00–00:00, 00:00–01:00, 01:00–02:00, 02:00–03:00, 03:00–04:00, 04:00–05:00, 05:00–06:00, and 06:00–07:00, while the 8-h interval is associated with the whole night hours of 23:00–07:00. The two-studied intervals were selected to facilitate a comparison of the impact of the finer resolution (1-h) with that of the coarser resolution (8-h). Finally, the noise levels were expressed via the objective noise indicators; A-weighted equivalent (
In addition to noise measurements, supplementary data were collected on the outdoor and indoor environments, as well as building characteristics at each location, including: window size (
Processing of noise exposure measurements
To assess the sound insulation of façade structures, outdoor and indoor acoustic measurements are typically conducted under controlled conditions, following criteria that account for both recorded sound levels and (indoor) background noise, ensuring accurate representation of outdoor and indoor sound levels.25–27 According to these standards, frequency-dependent outdoor noise levels should exceed the corresponding indoor levels, and indoor levels should surpass background noise by at least 6 dB(A), and preferably 10 dB(A). These conditions ensure that background noise does not distort the evaluation of façade sound insulation.
As an unsupervised (uncontrolled) approach was employed to assess outdoor-to-indoor attenuation levels, dominant indoor sources and background noise levels may have violated the conditions typically required in controlled settings for accurately capturing attenuation levels.26,27 Therefore, a processing methodology was applied. Initially, outdoor-to-indoor level differences were calculated for equivalent, maximum, and percentile (
An evaluation procedure was implemented to account for the contribution of indoor background noise to the measured indoor levels. To assess background noise, percentile noise indicators such as
Statistical analyses
To evaluate and model the impact of various predictors on the outdoor-to-indoor noise level difference, both multiple (MLRMs) and mixed-effect linear regression models (MELRMs) were developed using Jamovi 2 software, 30 following established statistical modeling approaches. 31
The analysis considered both continuous and categorical predictors. The continuous predictors included outdoor noise levels (
Initially, the relationship between outdoor noise levels and the outdoor-to-indoor level differences was explored using the Pearson correlation coefficient (
In multiple linear regression models, the predictors were selected using a stepwise elimination process, beginning with a full model that included all predictors and removing non-significant ones in each step (
In mixed-effect linear regression models, an approach similar to the multiple linear regression models was followed for estimating the
Finally, the evaluation of both modeling approaches was conducted in RStudio using a 10-fold cross-validation procedure.
44
In this approach, the dataset was randomly partitioned into 10 (non-overlapping) folds of approximately equal size. In each iteration, approximately 90% of the data were used to refit the model and estimate the regression coefficients, while the remaining 10% were kept for validation. This process was repeated 10 times, ensuring that each data subset was used exactly once for testing. The predictive performance of the model was assessed by averaging the root mean squared error (RMSE) across all folds. The RMSE, which represents the standard deviation of the residuals, quantifies the average error between the predicted and observed
Regression modeling
Both multiple and mixed-effect linear regression models were developed to express the outdoor-to-indoor level difference in terms of the significant predictors for each time interval, background noise condition, and noise indicator. In equations (1)–(12), the multiple linear regression models are summarized per noise indicator.
– Models based on the


– Models based on the


– Models based on the


– Models based on the


– Models based on the


In these models,
Similarly, in equations (13)–(24), the mixed-effect linear regression models are summarized per noise indicator, where ID
– Models based on the


– Models based on the


– Models based on the


– Models based on the


– Models based on the


Results
Assessment of outdoor levels and outdoor-to-indoor level differences
After processing the night-time data based on the
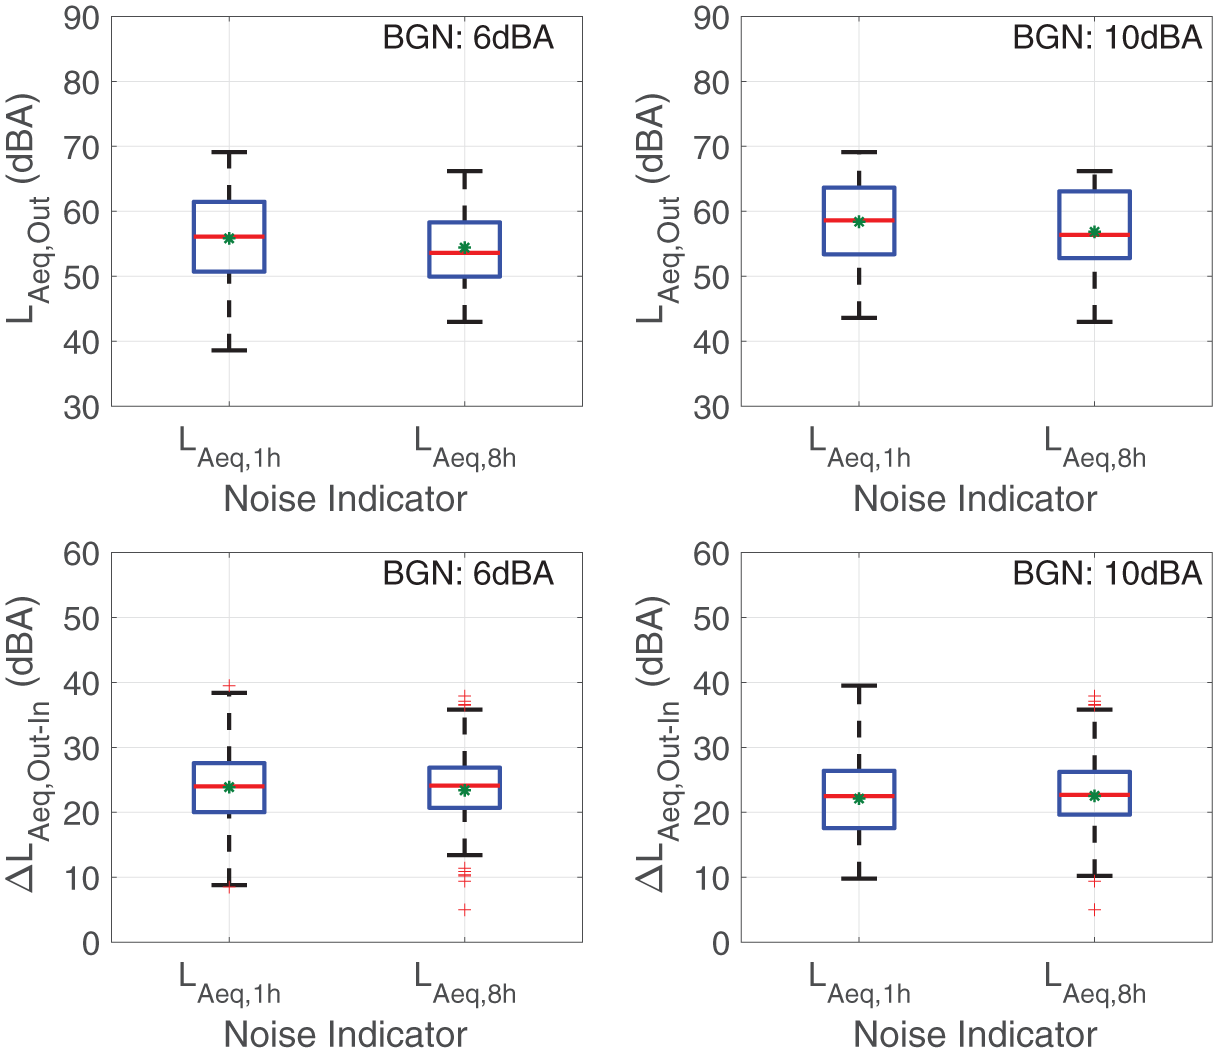
Assessment of outdoor levels (top) and outdoor-to-indoor level differences (bottom) expressed via the
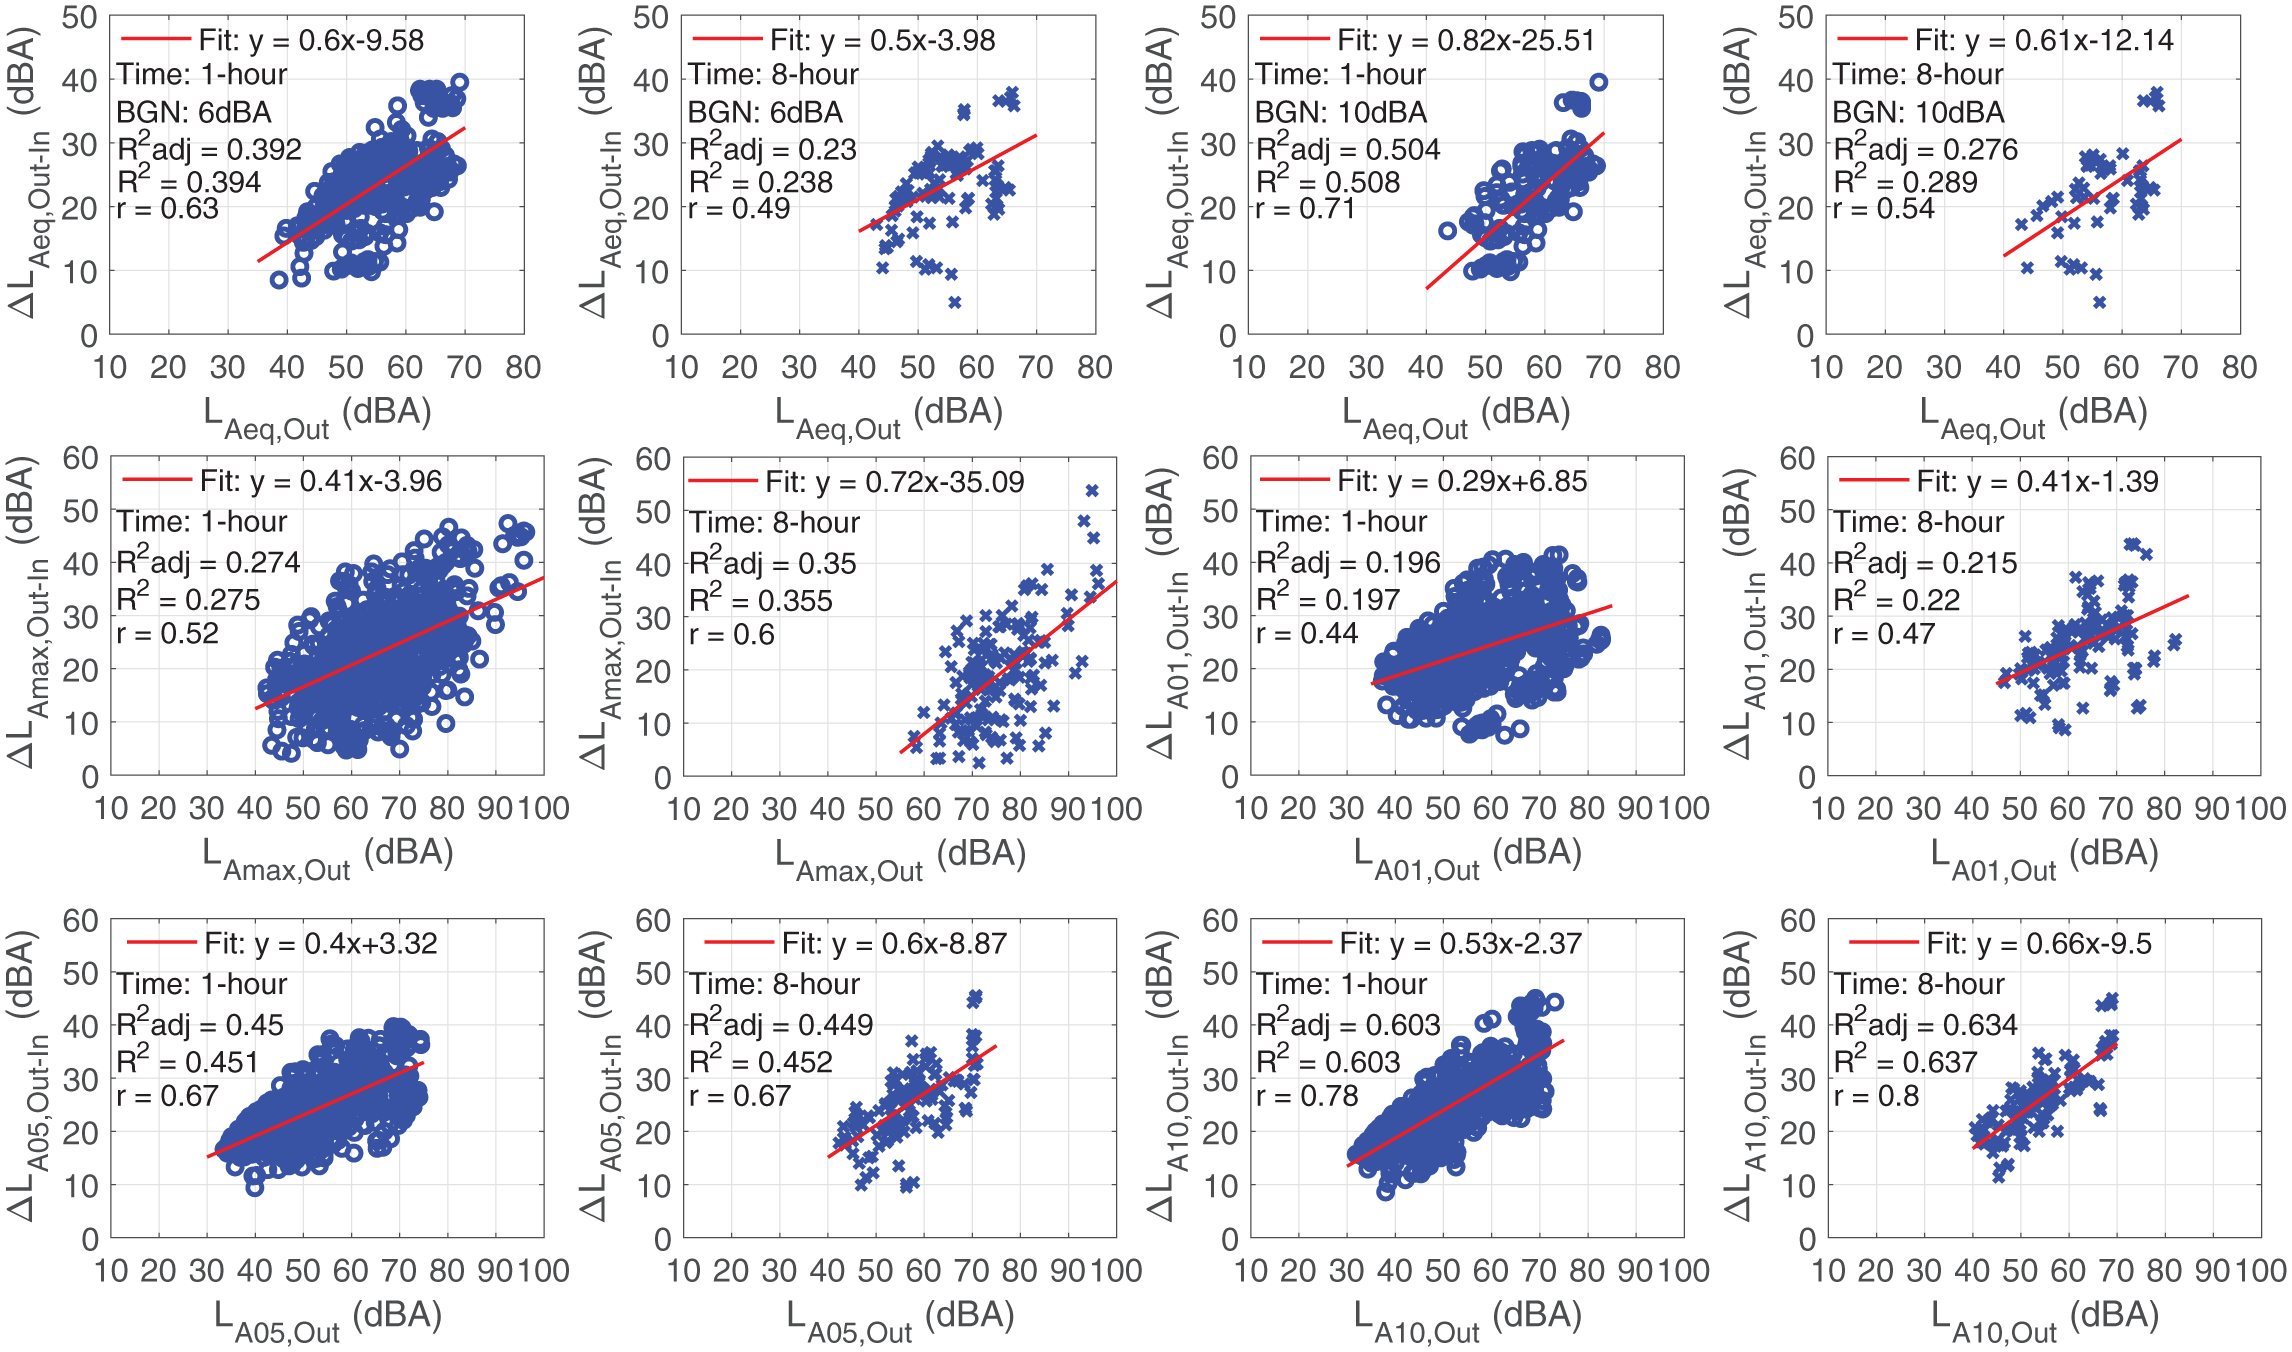
Descriptive statistics of outdoor levels and outdoor-to-indoor level differences per noise indicator with respect to background noise condition and time interval.
IQR: inter-quartile range; Std: standard deviation.
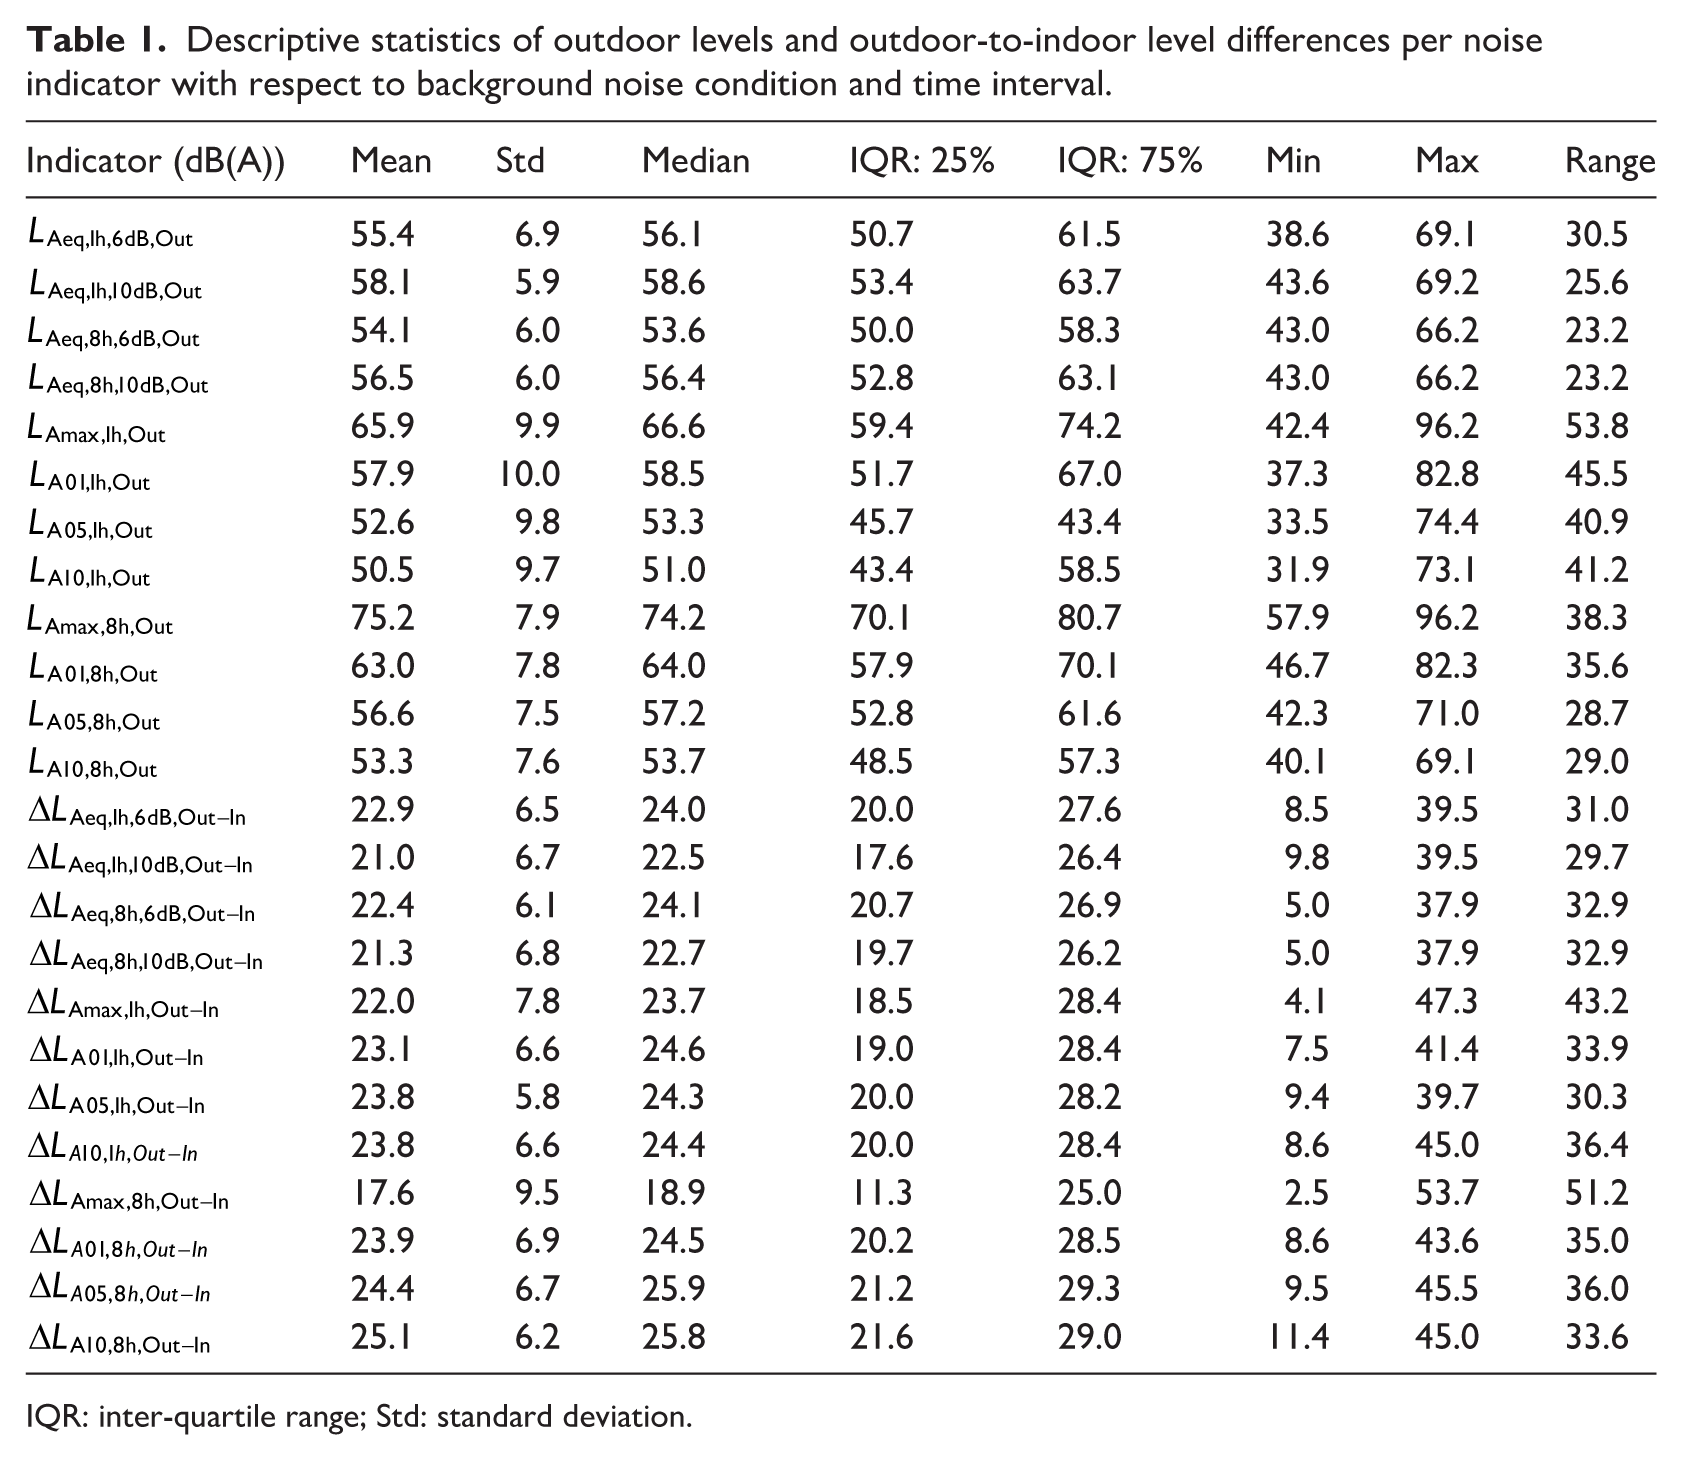
As regards the noise exposure levels expressed using the maximum (
Assessment of outdoor levels (top) and outdoor-to-indoor level differences (bottom) expressed via the
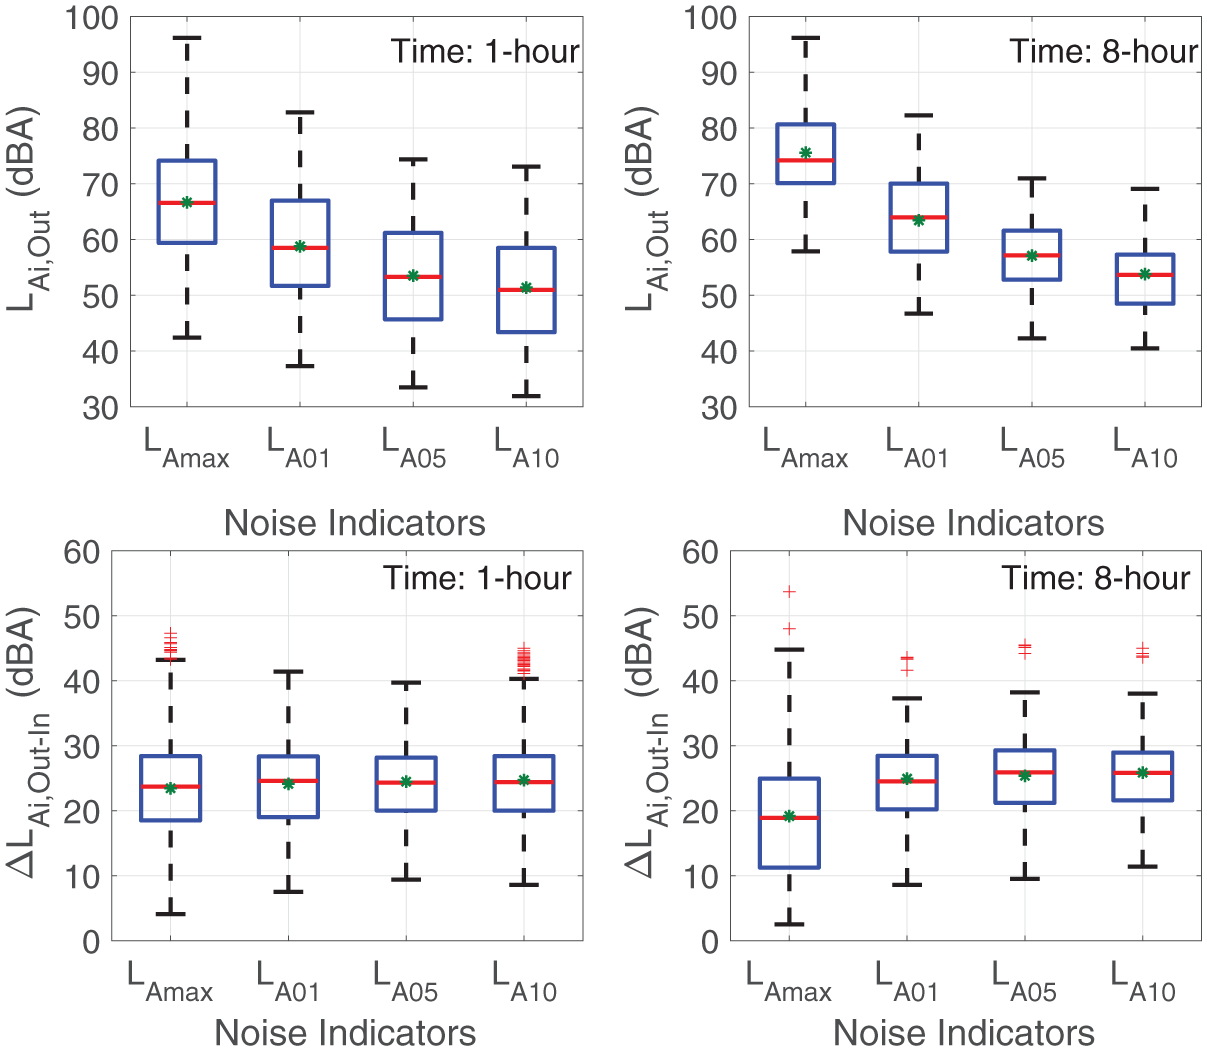
The relationships between the equivalent outdoor-to-indoor level differences (
Relationship between outdoor levels and outdoor-to-indoor level differences expressed using (top)
Similar to the equivalent noise indicator, the relationships between the outdoor noise levels and outdoor-to-indoor level differences expressed through the maximum (
Finally, cumulative probability distributions (CPDs) were analyzed to provide a comprehensive understanding of how outdoor-to-indoor noise attenuation varies, revealing distributional patterns, across outdoor noise level groups, noise indicators, temporal intervals, and background noise conditions. Specifically, CPDs of level differences were computed for grouped outdoor exposure levels (40, 50, 60, 70, 80, and 90 dB(A)), using increments of ± 5 dB(A). Because data availability differed across groups, some distributions reflect only the subsets with sufficient sample size. Figure 4 presents the resulting CPDs. For 1-h intervals, the
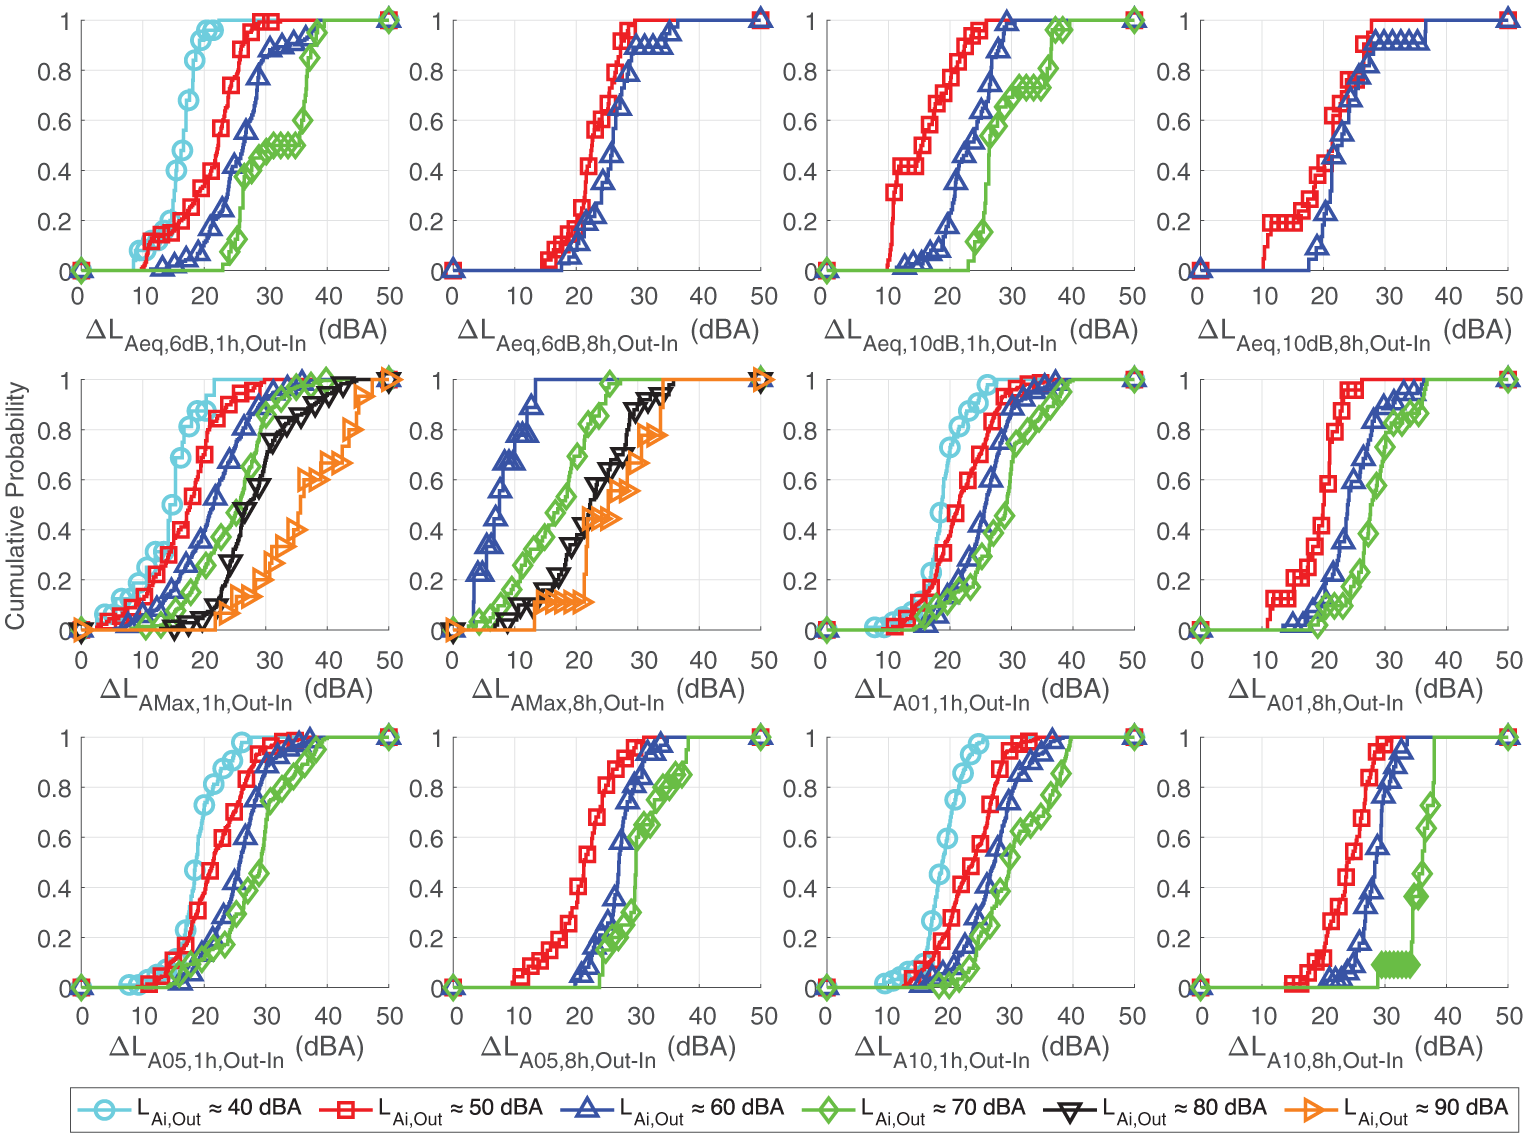
Cumulative probability distribution (CPD) of outdoor-to-indoor level differences grouped by outdoor exposure levels: 40 dB(A), 50 dB(A), 60 dB(A), 70 dB(A), 80 dB(A), and 90 dB(A), using increments of ± 5 dB(A). The rows represent: (top)
Multiple linear regression modeling
The summaries of the multiple linear regression models are presented in Table 2. As shown, increasing the time interval from 1 to 8 h led to higher explanatory power (
Estimation of the parameters for multiple linear regression models, including the modeling performance (RMSE).
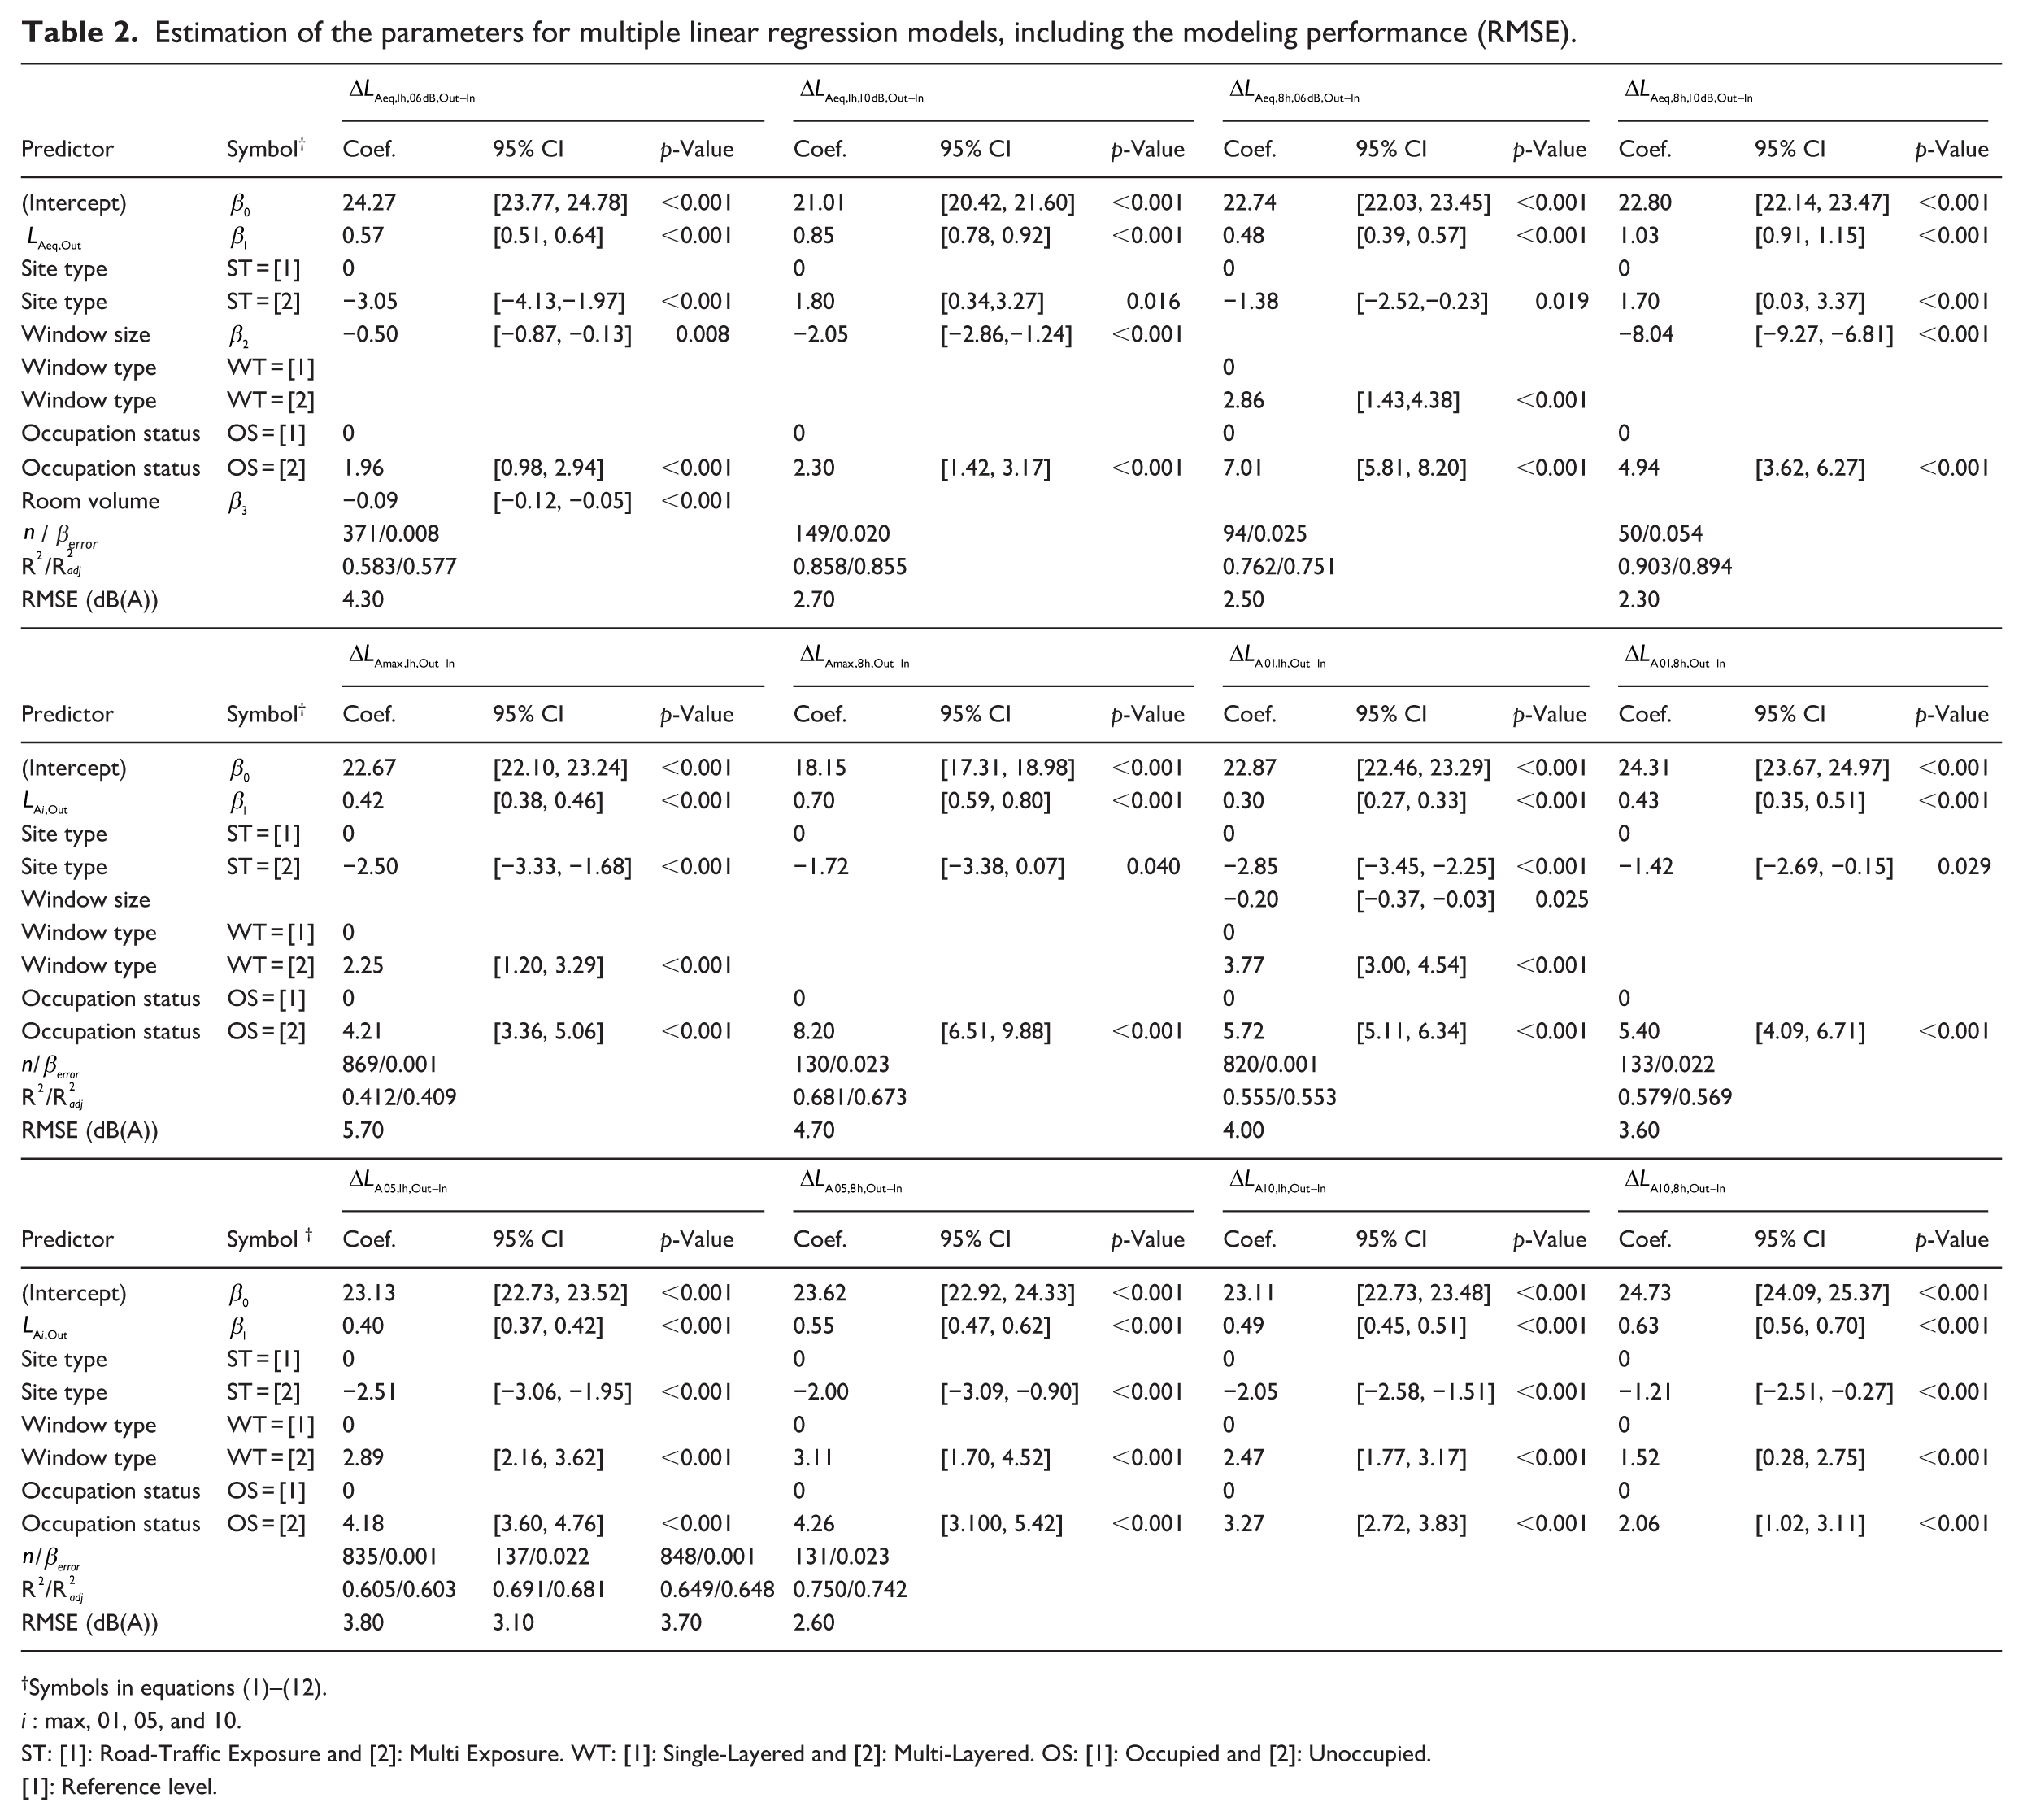
Symbols in equations (1)–(12).
i : max, 01, 05, and 10.
ST: [1]: Road-Traffic Exposure and [2]: Multi Exposure. WT: [1]: Single-Layered and [2]: Multi-Layered. OS: [1]: Occupied and [2]: Unoccupied.
[1]: Reference level.
All multiple linear regression models showed a statistically significant positive association between outdoor noise exposure and the outdoor-to-indoor level difference (
The proportion of the explained variance by each predictor in the multiple linear regression models was calculated and the results are presented in Figure 5. As it can be seen, the outdoor noise levels explained the greater percentage of variance across all the models (
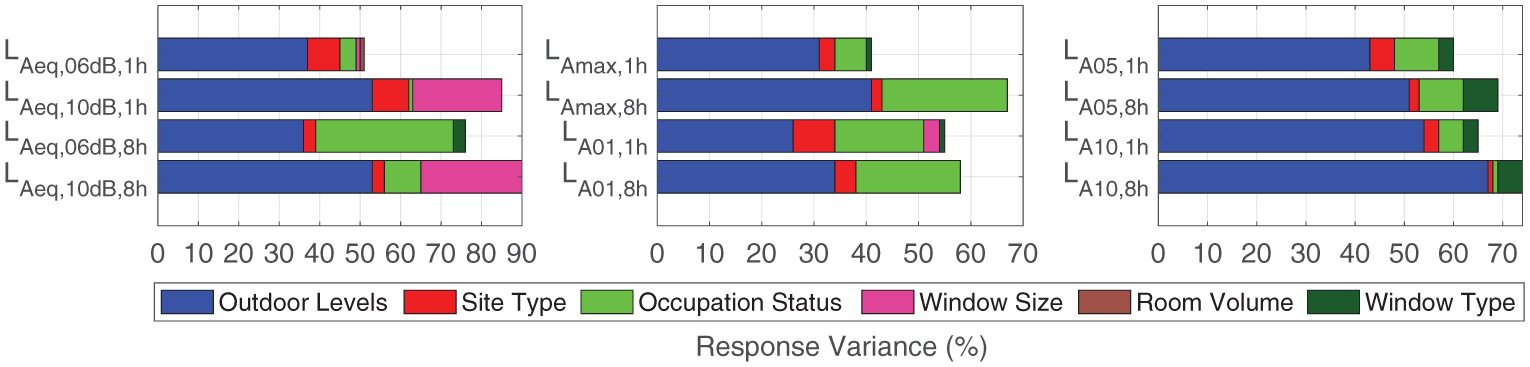
Relative importance for each predictor in multiple linear regression models.
Finally, the multiple linear regression models were validated using 10-fold cross-validation procedure, and the main diagnostic results are presented in Table 2. In addition to this, a comparison between the predicted and observed outdoor-to-indoor level differences for each noise indicator, along with corresponding diagnostics, is shown in Figure 6. Focusing on Figure 6, the models based on the equivalent noise indicator with the 10 dB(A) background noise condition exhibited lower RMSE levels (1-h: RMSE = 2.7 dB(A) and 8-h: RMSE = 2.3 dB(A)) compared to those based on the 6 dB(A) background noise condition (1-h: RMSE = 4.3 dB(A) and 8-h: RMSE = 2.5 dB(A)). When comparing the RMSE levels of the maximum and percentile indicator models, it was evident that the
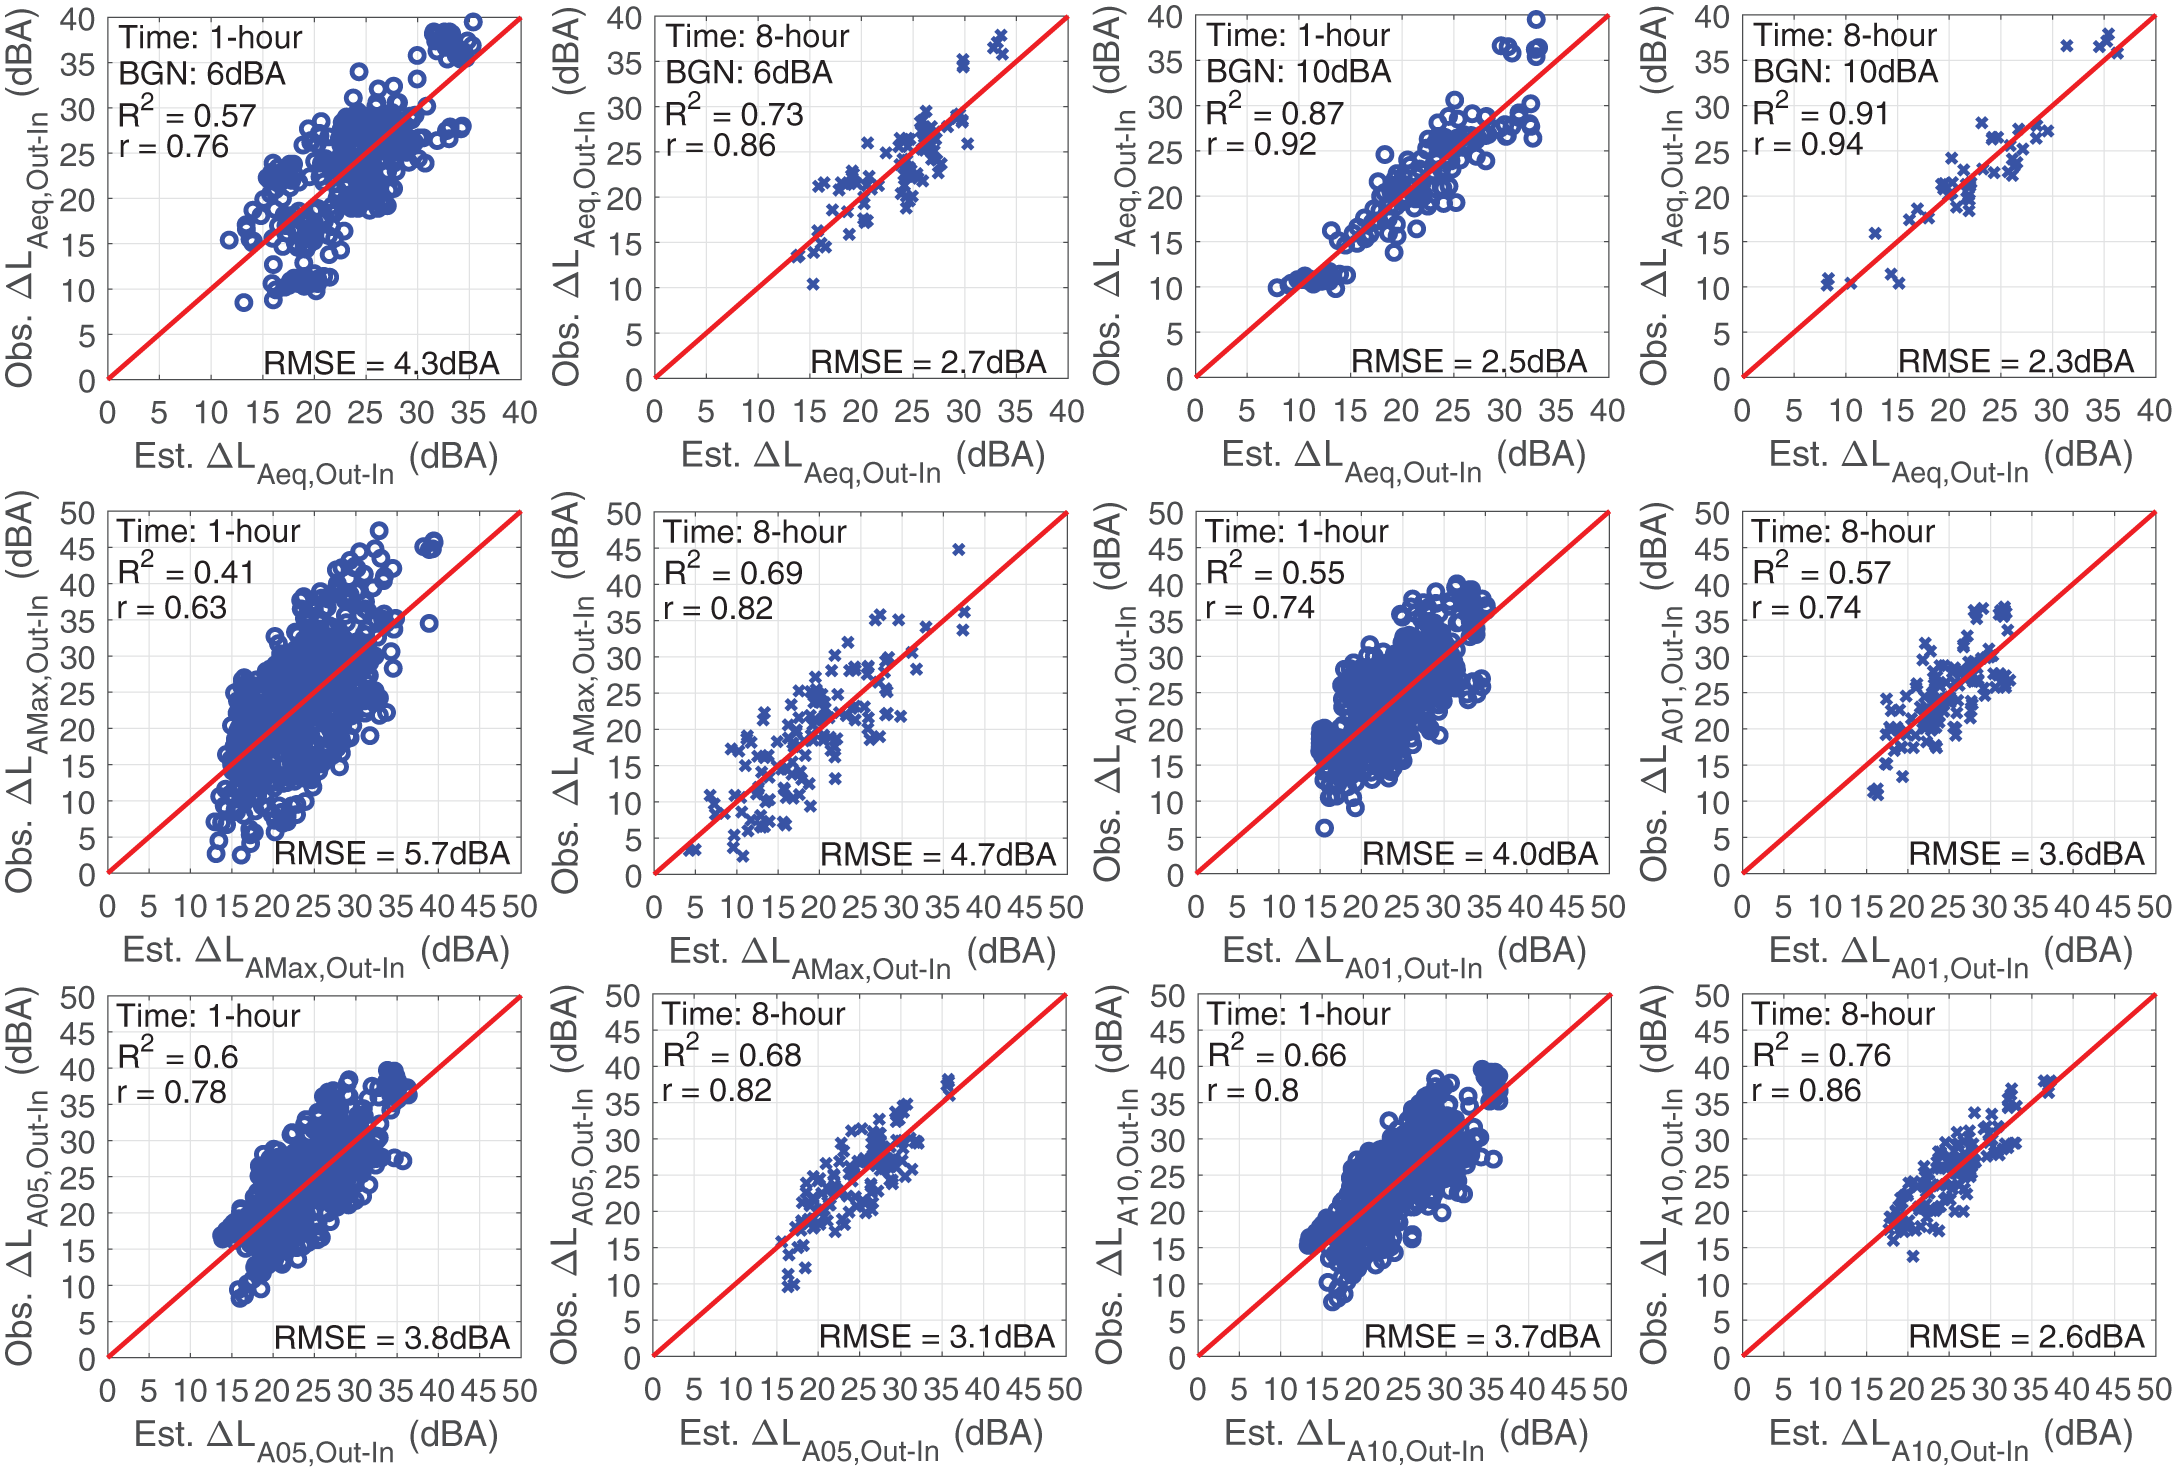
Validation of multiple linear regression models via the 10-fold cross-validation procedure, plotting the observed levels (Obs.) versus the estimated levels (Est.) with respect to (top)
Mixed-effect linear regression modeling
The summaries of mixed-effect linear regression models were extracted and are presented in Table 3. As it is seen from Table 3, the predictors vary among the
Estimation of the parameters for mixed-effect linear regression models, including the modeling performance (RMSE).
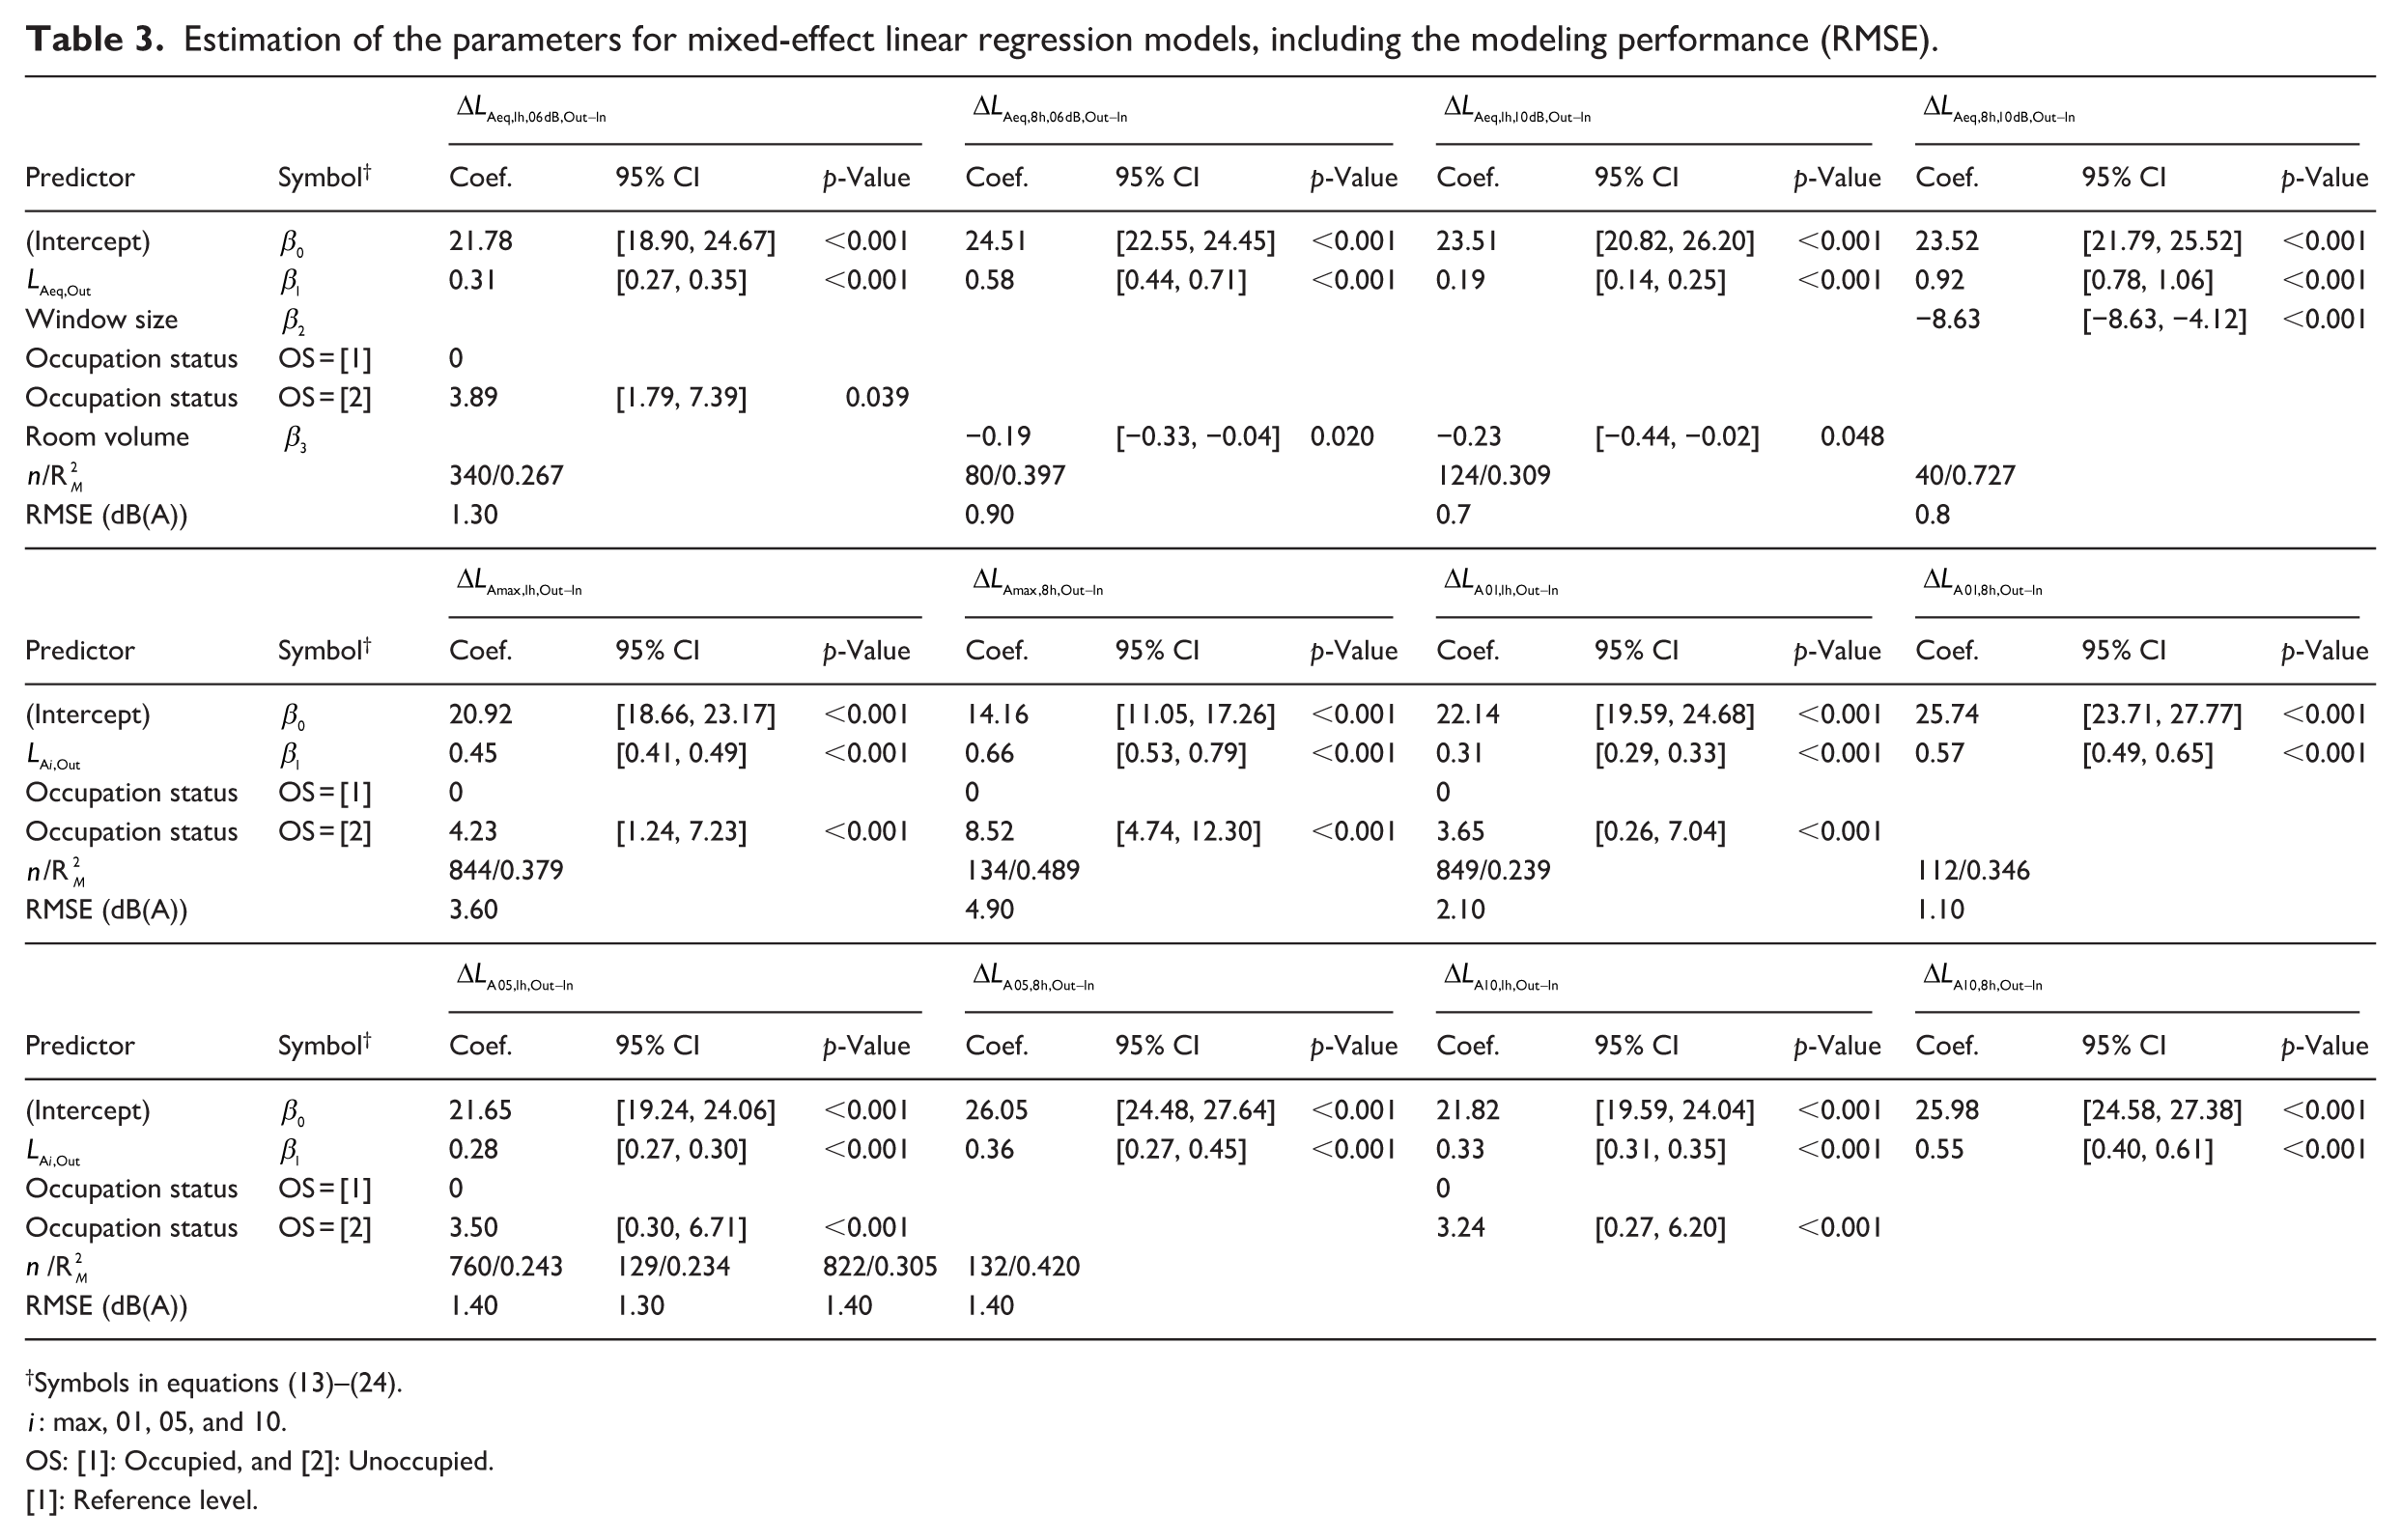
Symbols in equations (13)–(24).
OS: [1]: Occupied, and [2]: Unoccupied.
[1]: Reference level.
Across all mixed-effect linear regression models, a consistent positive association was observed between outdoor noise levels and the outdoor-to-indoor level difference (
The percentage of explained variance by each predictor (
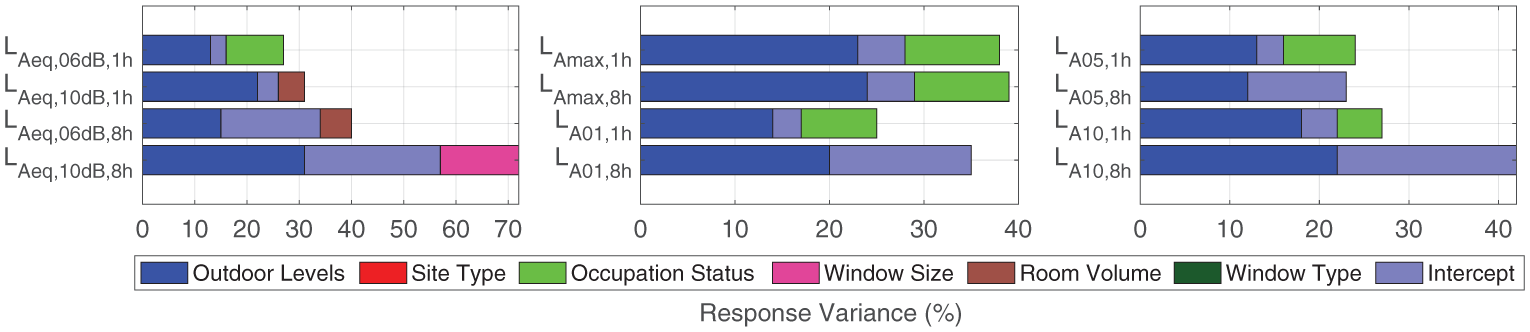
Relative importance for each predictor in mixed-effect linear regression models. Note that in the multiple linear models, the intercept is excluded from the relative importance analysis, as it does not contribute to the explained variance in the estimation of outdoor-to-indoor level differences. In contrast, the mixed-effect models include a random intercept (location ID), which captures location-level variance and is thus reflected in the proportion of explained variance.
Similar to the multiple linear regression models, the mixed-effect linear regression models were validated with respect to the 10-fold cross-validation procedure and the main diagnostic (RMSE) is included into Table 3. A comparison between the predicted and observed outdoor-to-indoor level differences for each noise indicator, along with corresponding diagnostics, is shown in Figure 8. Focusing on Figure 8, the equivalent noise indicator models with the 10 dB(A) background noise condition exhibited lower RMSE levels (1-h: RMSE = 0.7 dB(A) and 8-h: RMSE = 0.8 dB(A)) compared with those based on the 6 dB(A) background noise condition (1-h: RMSE = 1.3 dB(A) and 8-h: RMSE = 0.9 dB(A)). When comparing the RMSE levels of the maximum and percentile indicator models, it was evident that the
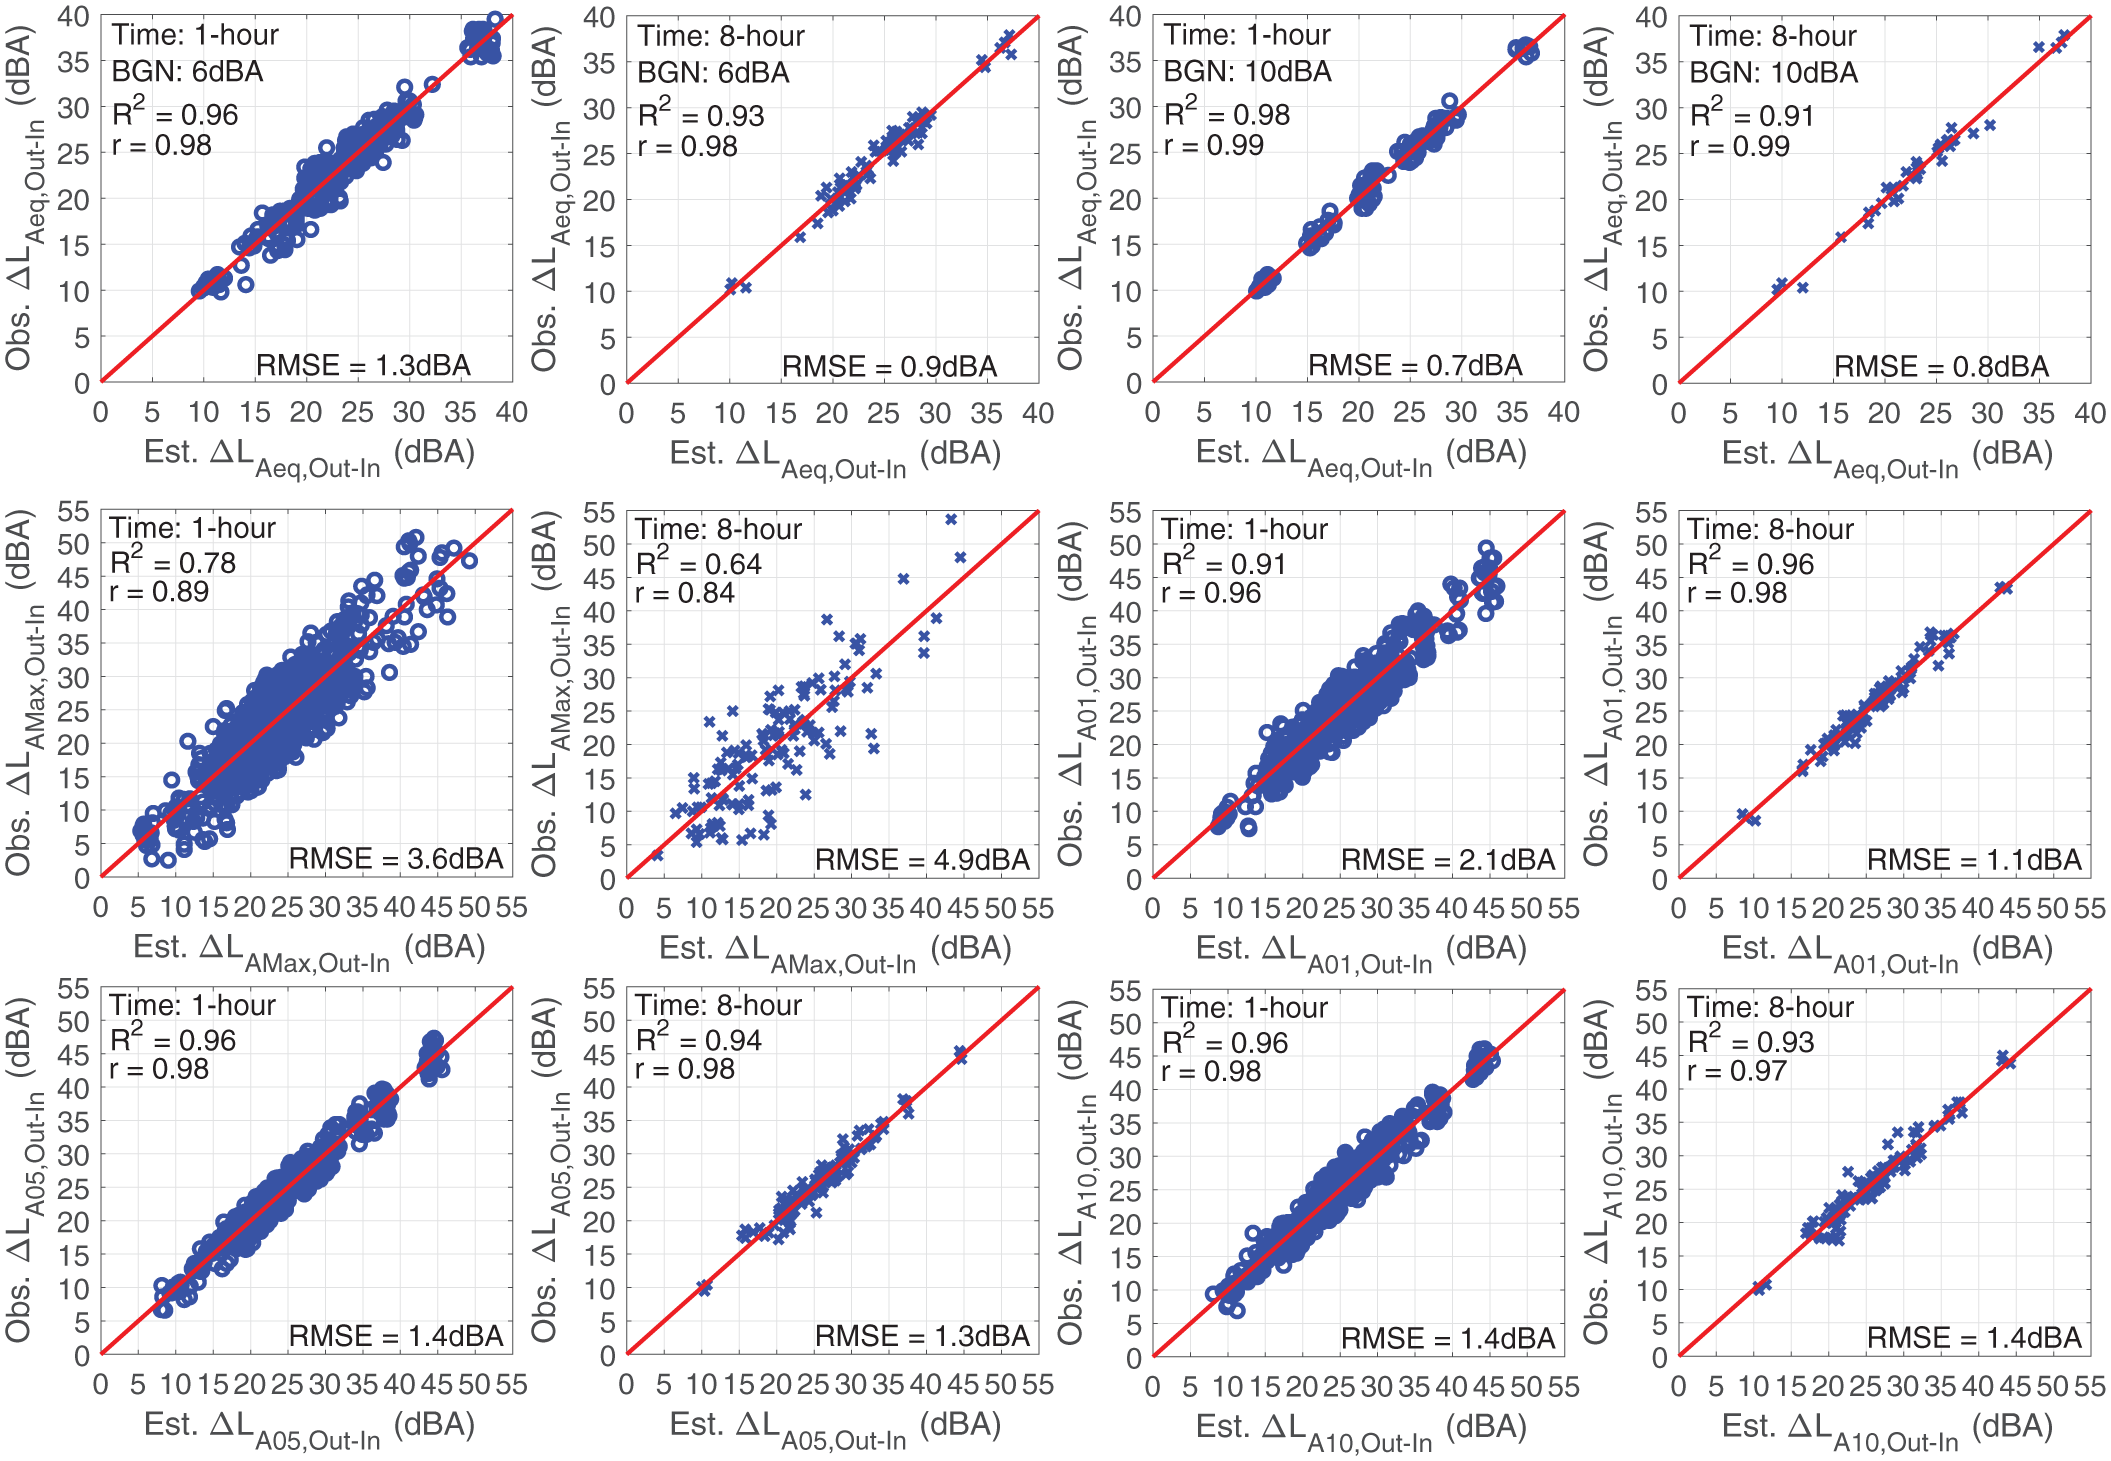
Validation of mixed-effect linear regression models via the 10-fold cross-validation procedure, plotting the observed levels (Obs.) versus the estimated levels (Est.) with respect to (top)
Finally, the lower root mean square error (RMSE) values obtained from the mixed-effect linear models, in comparison to the multiple linear regression models, suggest that the inclusion of random intercept effect enhances model performance and provides a more accurate representation of the estimated outdoor-to-indoor level differences.
Single-valued attenuation level factors
Using both modeling approaches, the mean and standard deviation of the estimated outdoor-to-indoor attenuation levels were determined as a function of the noise indicator, the background noise condition, and the time interval. Consequently, indoor noise levels can be derived from outdoor measurements by applying a single-valued outdoor-to-indoor attenuation factor. These attenuation factors are reported in Figure 9 (left), together with the absolute differences between the estimated and measured (observed) levels. Overall, the estimated attenuation factors showed only minor differences between the multiple linear regression models (MLRMs) and the mixed-effect linear regression models (MELRMs). Finally, the analysis of absolute differences between estimated and observed single-valued levels for each noise indicator in Figure 9, (right) shows patterns consistent with those in Figures 6 and 8. Both modeling approaches yield absolute mean level differences below 3 dB(A) for all indicators except the maximum noise indicator. Mixed-effects linear regression models achieve up to 2 dB(A) lower absolute mean differences than multiple linear regression models, indicating better performance. In contrast, the maximum noise indicator exhibited an absolute mean difference of approximately 3 dB(A), marking the only significant deviation from the overall trend and underscoring the difficulty in accurately obtaining predictions for this metric.
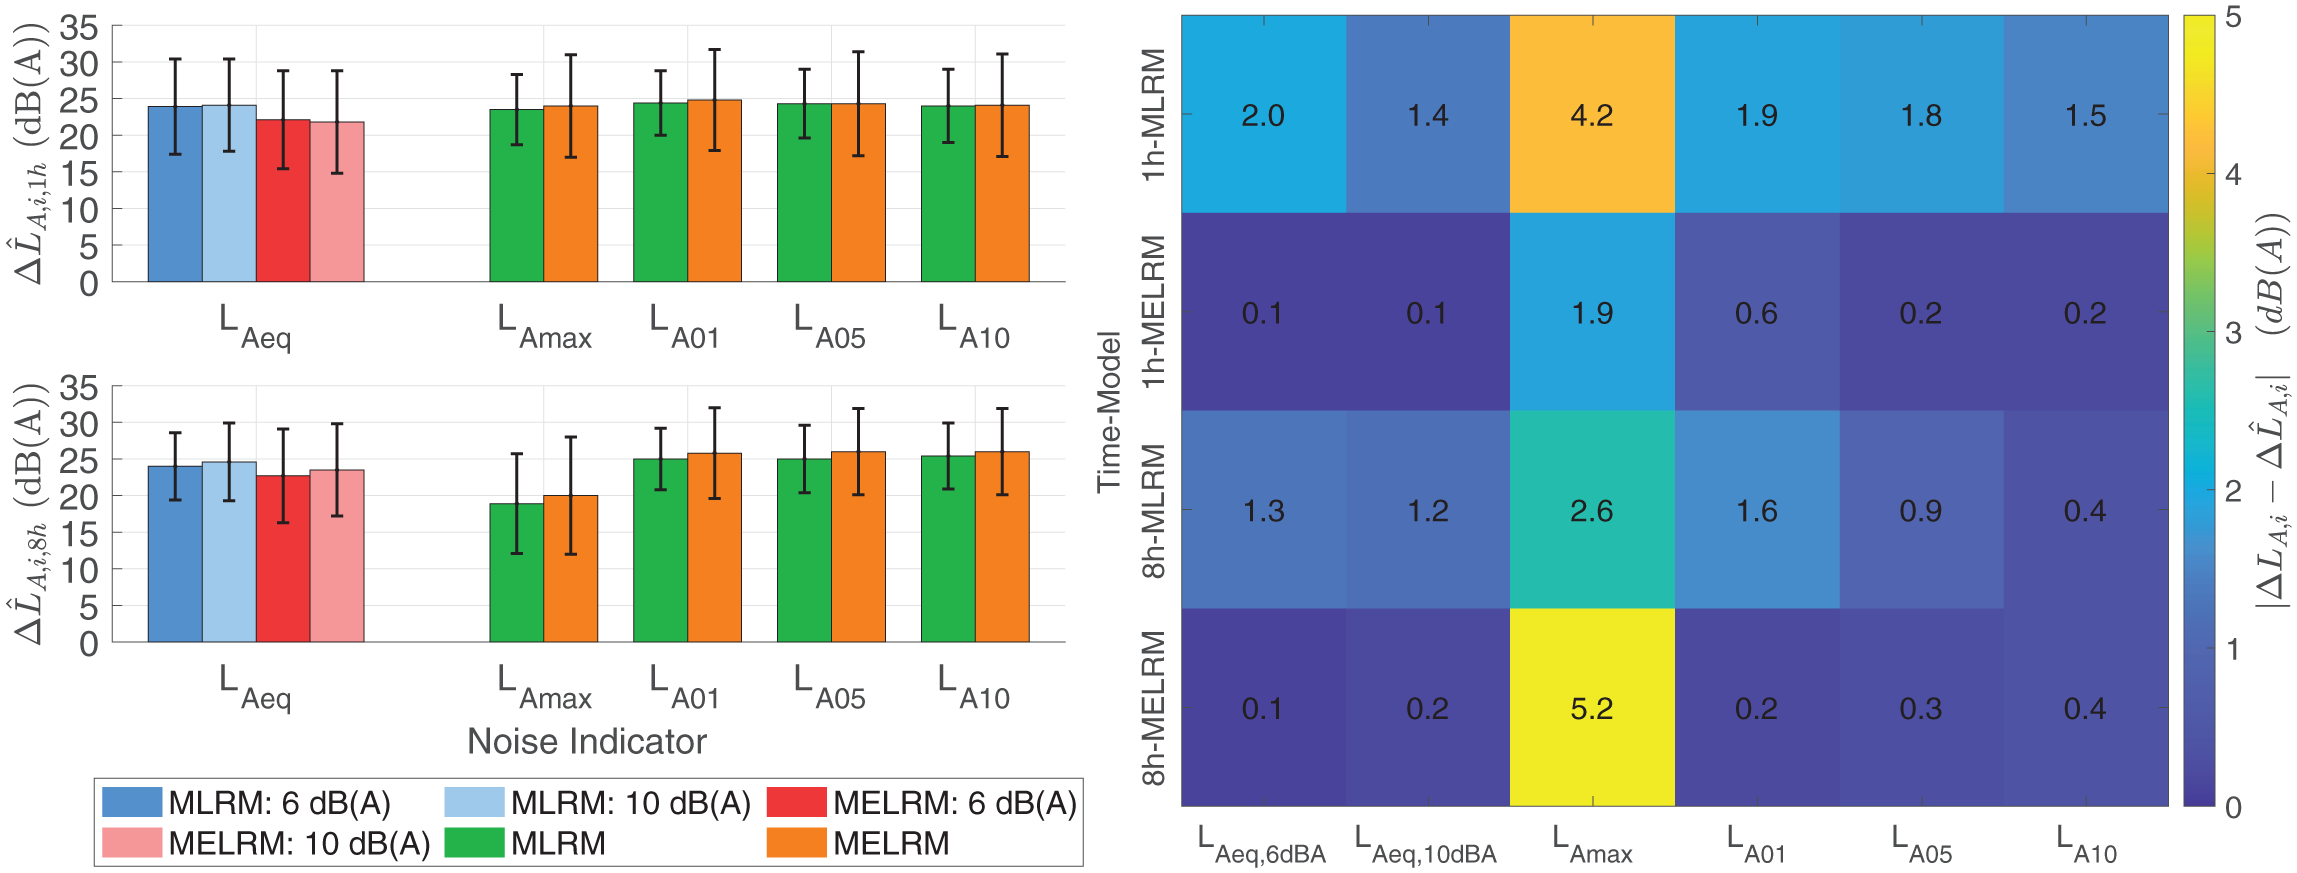
Mean and standard deviation (error-bars) of estimated attenuation level factors (left) per noise indicator and setting, accounting for background noise conditions (6 and 10 dB(A)) and time intervals (1 and 8 h), based on multiple (MLRMs) and mixed-effect linear regression models (MELRMs). Heatmap (right) denotes the absolute level difference
Discussion
To produce estimates of indoor noise exposure at night, outdoor, and indoor noise measurements from 49 dwellings in London were used to derive attenuation levels for various noise indicators with respect to two time intervals of 1-h and 8-h. The influence of indoor background noise was accounted for in the
Assessment of outdoor levels and outdoor-to-indoor level differences
Typically, short-term measurements and a short integration time (e.g. 1 s) are used to assess outdoor-to-indoor noise exposure level differences, following a supervised (controlled) approach. Locher et al. 20 conducted outdoor and indoor measurements for 3 min using an integration time of one second and employing a supervised approach. In this way, the contribution of indoor noise sources was minimized. Pirrera et al. 45 evaluated outdoor and indoor noise exposure for seven consecutive days and 7 h (23:00–07:00) using an integration time of 30 s and an unsupervised approach. Short integration time (e.g. 1 s) results in a higher resolution of noise exposure and its events during the considered time-interval period. In our study, the employed 1-min integration time results in a moderate resolution of noise exposure during the time-interval periods.
At night-time the background noise level indoors is lower than at day-time. This suggests that the quantification of indoor night-time noise exposure based on the outdoor noise exposure is likely to provide a less biased estimate of the “true” exposure due to the low degree of background noise. To ensure that only the transmitted noise from the external to the internal environment was assessed (due to unsupervised approach), indoor noise levels should not dominate the outdoor noise exposure levels. Moreover, in occupied conditions, people tend to generate noise,
46
acting as secondary sound sources, especially before and after sleeping,
47
resulting in higher indoor noise levels compared to indoor levels caused by outdoor noise sources. Our study was conducted with an average of 1–3 occupants per dwelling. This indicates that the background noise levels may have a significant impact on the noise levels recorded in the indoor environment. By quantifying indoor background noise levels via the percentile noise indicator
In captured outdoor noise exposure levels, various correction factors corresponding to the position of outdoor microphones have been applied (e.g. Locher et al., 20 Müller-Trapet, 49 and Ryan et al. 50 ). These correction factors reduce the impact of destructive and constructive wave interferences (mainly at low frequencies) that occur due to the distance between the outdoor noise receivers and the building façade across different frequency bands.51,52 In our study, we did not use any correction factor for the outdoor noise levels due to the lack of information related to the exact position of outdoor equipment from façade structures. This may result in a systematic error in outdoor measurements; and therefore, in outdoor-to-indoor level differences.
Focusing on the explored relationships between the outdoor noise exposure levels and the outdoor-to-indoor noise exposure level differences, a positive gradient is presented. Similar gradients have been also reported with respect to time-eq25 levels 20 and spectral time-equivalent levels. 48 This is associated to the variations in the façade characteristics and background noise levels as well as to the positions and the characteristics of various sound sources with respect to the positions of both outdoor and indoor microphones in the locations. Furthermore, the sound insulation is usually better at locations where there is more environmental noise. 53 This denotes the importance of further research on the explored relationships with respect to the design criteria. A recent study, 29 based on the same dataset, investigated the relationship between A-weighted equivalent outdoor-to-indoor level differences and outdoor noise levels across daytime, evening, and night-time periods, highlighting a significant influence of the time period on these relationships and indicating the importance of time-period in the assessment and estimation of attenuation levels.
In terms of noise indicators and the obtained cumulative probability distributions, the
According to the World Health Organisation (WHO), 55 the average outdoor-to-indoor level differences for closed windows is usually estimated around 25 dB(A). However, in literature,20,29,45,56 attenuation factors up to 32 dB(A) are presented. In our study, similar results to those presented by the WHO were found for the equivalent noise indicator, with the highest deviation from the WHO level being approximately 3 dB(A). The position of the equipment, the façade properties (e.g. classification) and its components (e.g. wall and window mounting characteristics) in relation to the position of sound sources (angle of incidence), as well as the type of noise source, are responsible for deviations in attenuation factors. Therefore, it is important to use the values for attenuation with caution in studies with different site, building, and exposure characteristics. This is of particular importance, when the relationship between noise exposure and health outcomes is to be investigated. These underscore the necessity of harmonized measurement protocols that are aligned with the specific objectives of the assessment (e.g. sound insulation performance, sleep disturbance, or cognitive outcomes), thereby facilitating more robust and comparable results across different studies.
Finally, indoor noise exposure levels derived from outdoor measurements by applying a single-valued outdoor-to-indoor attenuation factor are likely to provide a less biased estimate of the “true” outdoor-based indoor exposure levels than only using outdoor levels as proxy for indoor levels. However, this approach is centered to outdoor-based indoor noise exposure, thereby excluding the contribution of indoor sound sources to the overall indoor noise exposure. Hence, this approach may be of particular interest to exposure scientists and epidemiologists seeking to estimate indoor noise levels from outdoor estimates during nighttime.
Regression modeling
Both multiple and mixed-effect linear regression models were developed for estimating outdoor-to-indoor level differences. Overall, mixed-effect linear regression models presented lower RMSE levels in comparison with multiple linear regression models. The highest RMSE levels were observed in the maximum noise indicator (
Application
A methodology for estimating night-time (23:00–07:00) outdoor-to-indoor level differences based on unsupervised and (time) synchronized outdoor and indoor measurements was proposed. Based on this procedure, outdoor and indoor noise levels influenced by dominant indoor (secondary) noise sources and indoor background noise levels were minimized, especially in the case of the equivalent noise levels, where two background noise conditions were applied. The validation of this procedure based on both the time-averaged (presented in this study) and spectral-averaged (see Terzakis et al. 48 ) analyses strengthens the latter statements. The analyses based on two different background noise conditions in equivalent levels present mean differences of 1 and 2 dB(A), respectively. Finally, the analyses based on two different time intervals suggest the importance of specifying the resolution when attenuation levels need to be applied. In our case, mean differences of up to 1.5 dB(A) were obtained between the two time intervals across the equivalent and percentile noise indicators, while for the maximum level the change reached up to 4 dB(A).
Although single-valued outdoor-to-indoor attenuation factors can be used for the estimation of indoor levels based on the outdoor ones, prediction models are capable to provide more reliable attenuation factors, relying on the different building, outdoor, and indoor characteristics. The developed models are applicable to data with similar noise exposure levels and building characteristics in the United Kingdom due to the fact that all the measurements used were conducted in the Greater London area. It should, however, be noted that building façade characteristics may vary significantly in other areas. Hence, the models, and especially the mixed-effect linear regression models, should be used with caution in locations with different building characteristics. Finally, the approach for capturing the noise exposure levels should be comply with the presented methodology, since outdoor-to-indoor level differences will significantly vary.
Conclusions
In this study, a methodology to derive night-time outdoor-to-indoor attenuation levels was developed, by incorporating unsupervised and synchronized outdoor and indoor noise exposure measurements and information on building characteristics in regression modeling. The method minimized the presence of dominant indoor noise sources and background noise levels. The produced attenuation factors are from UK data reflecting local noise sources and building characteristics. The methods may be used in other countries but would benefit verification with local data/conditions. The proposed methods and resulting attenuation factors for various indicators beyond
Enhancing the reliability of outdoor-to-indoor noise characterization requires a broader dataset with more measurements per location ID, particularly for the equivalent noise indicator and under non-supervised conditions. Incorporating additional predictors describing detailed building façade structure characteristics would improve the estimation of noise transmission pathways and account for structural variability across buildings. Therefore, for future research, extensive noise exposure measurements, complemented by data on sound insulation and room acoustics, could be conducted across diverse locations and countries. Such efforts are could refine and validate the models and enable more accurate estimation of indoor noise levels from outdoor exposures and outdoor-to-indoor level differences.
Footnotes
Acknowledgements
FN acknowledges funding support for the data collection (noise measurements) from the Department of Epidemiology and Biostatistics, School of Public Health, Imperial College London, UK, Ministry of Higher Education, Malaysia and Universiti Sains Malaysia. AH acknowledges funding from the National Institute for Health and Care Research (NIHR) Leicester BRC (NIHR203327), the NIHR Health Protection Research Unit (HPRU) in Chemical Threats and Hazards at the University of Leicester, a partnership between the UK Health Security Agency, the Health and Safety Executive and the University of Leicester. The views expressed are those of the author(s) and not necessarily those of the NHS, the NIHR, the Department of Health and Social Care or the UK Health Security Agency. AH also acknowledges support from a British Heart Foundation Research Excellence Award (RE/24/130031). The funders had no role in the study design, analysis or interpretation of data, decision to publish, or preparation of the manuscript. Sincere gratitude to all participants for their time and willingness for the noise measurement activities at their homes, and HACAN for getting more participants in the study recruitment.
Author contributions
Michail Evangelos Terzakis (MT): Conceptualization, Methodology, Visualization, Software, Validation, Formal Analysis, Writing - Original Draft. Faridah Naim (FN): Investigation, Methodology, Resources, Data Curation, Writing - Review & Editing. Cédric Van hoorickx (CVh): Conceptualization, Methodology, Writing - Review & Editing, Supervision. Maarten Hornikx (MH): Resources, Writing– Review & Editing, Supervision, Project Administration, Funding Acquisition. Daniela Fecht (DF): Project administration, Supervision, Writing - Review & Editing. Anna L. Hansell (AH): Project Administration, Supervision, Writing - Review & Editing. John Gulliver (JG): Conceptualization, Methodology, Data Curation, Validation, Formal Analysis, Resources, Writing - Original Draft, Writing - Review & Editing, Supervision, Project Administration.
Funding
The authors disclosed receipt of the following financial support for the research, authorship, and/or publication of this article: This research was funded by the European Union’s Horizon 2020 research and innovation program under grant agreement No. 874724, Equal-Life Project, part of the European Human Exposome network.
Declaration of conflicting interests
The authors declared no potential conflicts of interest with respect to the research, authorship, and/or publication of this article.
Data availability statement
Data available upon request.