
Abstract
A locally resonant sonic crystal made of acoustically coupled concentric C-shaped cavities is proposed that generates multiple band gaps for usage as ventilated noise barrier. There is lack of comprehensive theoretical model for acoustic response of such concentric resonators, because the inter-scatterer coupling and variations in scatterers’ opening and orientation angles introduce complex nonlinear effects. A semi-empirical theoretical model is proposed and validated for central frequency and bandwidth of the first band gap (BG) of proposed structure. Large-scale numerical analysis evaluates the impact of these angles, and a Kriging-assisted multi-objective genetic algorithm is developed to tune these angles for achieving a target BG with broadened bandwidth. Smaller opening angle and orientation misalignment lowers the central frequency and vice versa, whereas bandwidth varies nonlinearly. Experiments show multiple tunable transmission loss peaks above 20 dB within 1500 Hz, demonstrating a dimension invariant approach for tuning the sound attenuation of this sonic crystal.
Introduction
Traditional methods of environmental noise control involve use of noise barriers and enclosures to partially cover construction site and highways. 1 However, implementing these methods is not always possible due to their visual and spatial restrictions. More specifically, low to mid-frequency sounds (usually between 0 and 1500 Hz) are difficult to attenuate by traditional materials like concrete, steel, wood, etc. In this regard, Sonic Crystals (SC) have drawn high attention as they can significantly control sound wave propagation due to their special stop band properties, simplicity of production and installation, and reduced environmental noise transmission with ventilation. 2
SC is a periodic structure with a finite array of highly dense sound reflecting scatterers embedded in air as the host medium. 3 It has demonstrated remarkable ability to manipulate sound waves and found practical uses in a variety of applications such as noise barriers, frequency filters, acoustic waveguides, and more.4–7 SC works on the principles of Bloch’s theorem and the Braggs scattering effect (details can be found in Gupta, 3 Chalurkar and Singh, 8 and Panda and Mohanty 9 ). As per these theories, periodicity of SC must be of the same order of magnitude as the wavelength of the target noise. This essentially means that the SC must be at-least several meters in size for attenuating low frequency (long-wavelength) sound waves, typically below 1500 Hz. To overcome this limitation of structural size and to improve the attenuation properties of conventional SC, recently resonance phenomena is being introduced locally at each scatterer. 10 This drastically attenuates sound waves with smaller structural sizes and fewer scatterers, and can boost the sound insulation properties in the low frequency region.5,11–14
Local resonance phenomenon can be implemented using various shaped resonators, such as C shaped resonator,15–18 the Quarter, and Helmholtz resonator,5,19 U profile resonator, 20 and other shapes that produce resonance effect. Among these scatterers, the C shaped resonators (or C-resonators) are widely studied because of their higher sound attenuation and ease of fabrication. Recent studies show that, concentric arrangement of sonic scatterers of varying geometric dimensions, enhances broadband attenuation by generating multiple band gaps, while reducing the overall dimension of the structure.12,21,22 In this paper, sonic crystals whose unit cell is composed of concentrically placed resonators that are acoustically coupled, is referred to as Concentric Coupled Resonator Sonic Crystal (CCRSC).
Each resonator within a unit cell of such CCRSC works on the principle of Helmholtz Resonator (HR). Previous attempts have been made at modeling fundamental frequency of single C-resonator, for which the classical HR equation is tuned to numerous empirical models with open-open end boundary conditions to calculate effective neck length (
In such CCRSC, the opening angle of the cavity can effectively govern the neck length and end correction of the scatterer that behaves as Helmholtz like resonator. Additionally, the orientation angles of the scatterers may modify the incident wave field and the inter scatterer coupling. Therefore, these parameters are expected to significantly influence the local resonance. Hence, determining the effects of orientation and opening angle of scatterer would be vital as it can help in tuning the frequency and bandwidth of the band gap of a CCRSC without changing the dimensions of either the unit cell or the overall structure. Although there is research on the effects of scatterer geometry and scatterer size on the band gaps of sonic crystals, the effects of opening angle and orientation angle of the resonant cavity of the scatterers of a CCRSC remain relatively unexplored.
This paper proposes a locally resonant sonic crystal whose unit cell is made of acoustically coupled concentric C-shaped cavities, that is, it proposes a C-shaped CCRSC and develops a semi-empirical theoretical model for its first band gap. It further examines the impact of orientation angle and opening angle of resonant cavity of the scatterers on the band gap. The paper also proposes a Kriging-assisted multi-objective genetic algorithm for optimizing the studied parameters for designing the proposed CCRSC with the first band gap at desired central frequency with broadened bandwidth. The structure comprises of three concentric C-shaped scatterers. Three concentric scatterer design is an engineering choice to provide trade-off between having enough scatterers for multiple resonances, and at the same time avoiding complex design and material requirements. The first band gap is studied because it occurs due to local resonance effect; hence it is heavily influenced by the scatterer’s opening and orientation of resonant cavity (details are presented in section 3).
Theoretical development
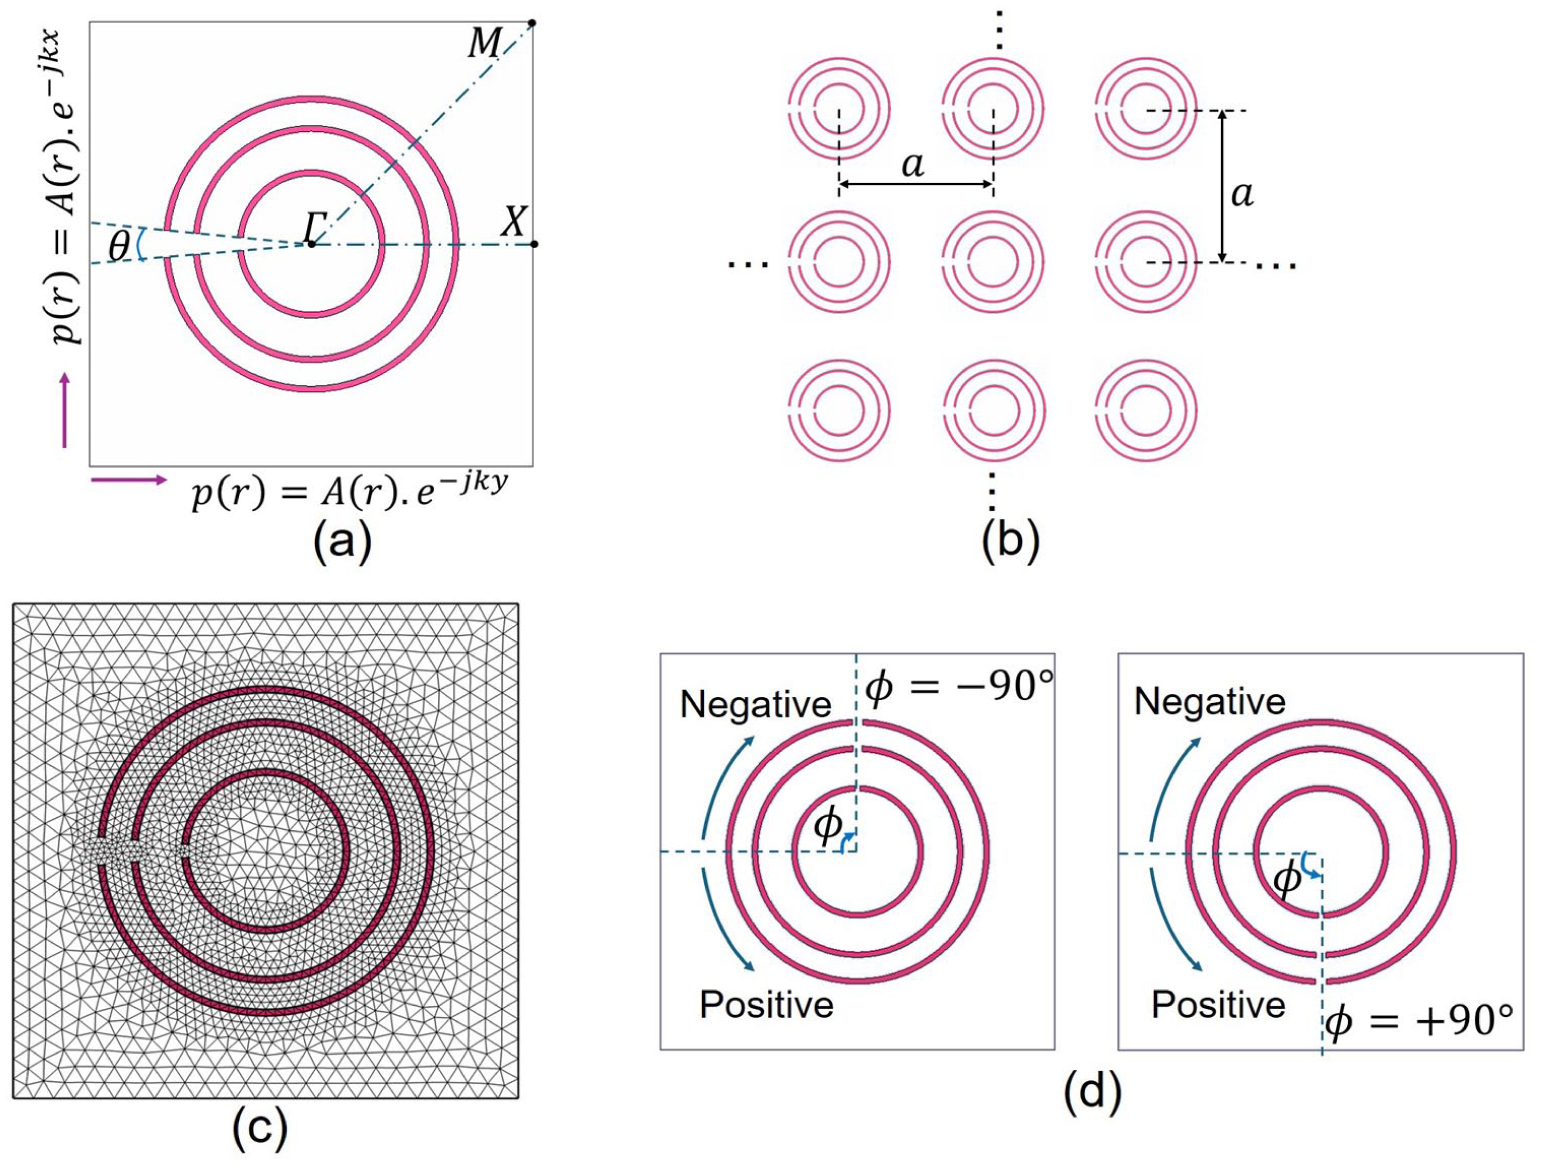
Figure 1 shows a typical unit cell of a C shaped resonator (or “C-resonator”) and the unit cell of an CCRSC made of three concentric C-resonators. For demonstration of the theoretical model for this CCRSC, let us choose the inner radii of the outer, middle and inner scatterer as

where

Schematics used for the theoretical development: (a) 3D and 2D views of a C-resonator, (b) 2D view of a unit cell of Concentric Coupled Resonator Sonic Crystal (CCRSC) made of three concentric C-resonators, (c) calculation of effective surface area inside a C-resonator, and (d) plot of end correction factor as function of opening width of the three concentric C-resonators.
To improve the theoretical model of the C-resonator, a data driven semi-empirical theoretical modeling approach is adopted with HR theory. The 3-dimensional view of the C-resonator whose cylinder’s axial depth is ‘

where
Firstly, each of the C-resonator in the unit cell of CCRSC is considered individually, and their individual end correction factors are determined using empirical data. For this purpose,

where i = 1, 2, 3 for outer, middle and inner scatterer respectively with

where

A series of models were simulated with


where,
where the equivalent cavity area

Further, a parallel impedance analogy is used to calculate the equivalent effective neck length

where
Similarly, equivalent opening width

where
Due to unavailability of theoretical models for strongly coupled CCRSC, effective geometric parameters are introduced using symbolic regression-based modeling. It is observed that the equivalent cavity area (
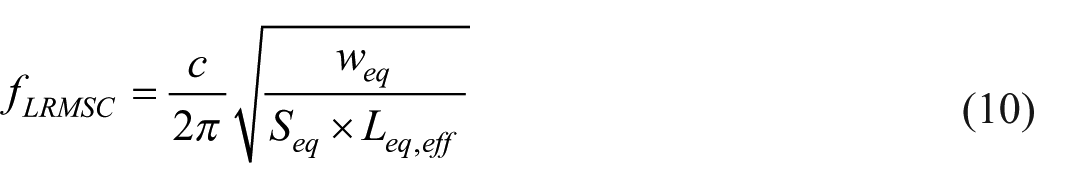
Using similar approach the bandwidth (

Methodology of numerical investigations
The CCRSC structure proposed for the studies consisted of three concentric C-shaped scatterers as unit cell as shown in Figure 2(a), whose 2D periodic layout is shown in Figure 2(b). Numerical studies were done using COMSOL Multiphysics version 6.1 to (i) derive the novel semi-empirical theoretical model for this CCRSC (presented in section 2), (ii) study the influence of the parameters (presented in section 4), and (iii) develop the optimization algorithm (presented in section 5). The basic dimensions of the scatterers were chosen to achieve the required band structure within 1000 Hz. The unit cell was meshed using edge mesh with maximum element size of 6 mm, but free triangular mesh was used for finer elements near scatterers’ boundary interface, as shown in Figure 2(c). This meshing was done as per the default mesh conversion criteria (Finer Mesh) of pressure acoustics module in COMSOL Multiphysics. However, maximum size of the element was customized to 6 mm such that it remained significantly less than the standard limit of one-sixth of the minimum incident wavelength at maximum analyzed frequency (1600 Hz), ensuring mesh-independent study.8,25 Further reduction in the selected mesh size did not significantly change the results but increased computation time, confirming convergence at the chosen meshing. This study analyzed the lower and mid frequencies between 5 and 1500 Hz. Unit cell was considered to calculate the effectiveness of entire CCRSC and its lattice constant. Lattice constant

where
Numerical modeling of CCRSC: (a) 2D view of a unit cell showing application of periodic boundary condition, (b) 2D view of periodically arranged CCRSC structure, (c) finite element meshed model of unit cell with free triangular element, and (d) 2D views of unit cell when all scatterers are oriented at the orientation angle
Geometric parameters of the studied designs
The radii of outer scatterer (
To investigate the effects of orientation of the scatterers, all three scatterers were rotated with respect to the z axis. The orientation angle (ϕ) of a scatterer was defined as the angle made by the line passing mid-way of the resonant cavity opening and direction of incoming sound waves measured anti-clockwise as shown in Figure 2(d). Orientation of each scatterer (ϕ) was varied as: −90°, −60°, −45°, −30°, 0°, 30°, 45°, 60°, and 90°, which resulted in
Band graph analysis
The band graph was investigated numerically using FEM in COMSOL Multiphysics 6.2. to solve acoustic wave propagation as given in equation (16). Applying Bloch’s Theorem for the acoustic wave propagation in structures with periodic modulation in ρ and/or


where

where,


To reduce computational cost, the band structure was calculated using one unit cell of an infinite CCRSC, by applying Floquet–Bloch’s periodic boundary condition, that is,

where [K] and [M] are Global stiffness matrix, and mass matrix, ω is angular frequency, and
Results and discussions of numerical investigations
Band gap due to local resonance
Figure 3 compares the band graph of a non-resonant solid cylinder, a resonant hollow C-shaped cylinder and the proposed CCRSC unit cell, where all unit cells have the same outer radius of 50 mm. The first band gap is found missing for solid cylinder, which is due to the absence of local resonance effect. The first band gap appears in other structures that contain resonating elements as scatterers in the unit cell, as shown in Figure 3(b) and (c).

(a) Unit cell and band graph of a solid cylinder that shows no bandgap in 400–600 Hz due to absence of local resonance. Unit cell and band graph of (b) a single C-resonator and (c) the studied CCRSC, both of which show the first band gap in 400–600 Hz due to local resonance in the scatterers.
The same observation was for all studied designs; hence it can be concluded that the first band gap in CCRSC is due to the local resonance phenomenon at the scatterers. This claim is further confirmed from the sound pressure distributions across an array of these unit cells at 497 Hz that corresponds to the first complete band gap in the proposed CCRSC, as shown in Figure 4. Here also, the local resonance, which is shown by means of the disruption in acoustic pressure inside the resonator, is found only in C-resonators as opposed to the solid cylinder. Moreover, the reduction in sound pressure level is highest when sound waves pass through the array of the proposed CCRSC structure, followed by the array of single C-resonators. Whereas, there is no reduction in sound pressure level through the array of solid cylinders. This highlights that the CCRSC structure of the same dimensions is more effective in low-frequency sound attenuation compared with sonic crystal made of single resonators or solid cylinders.
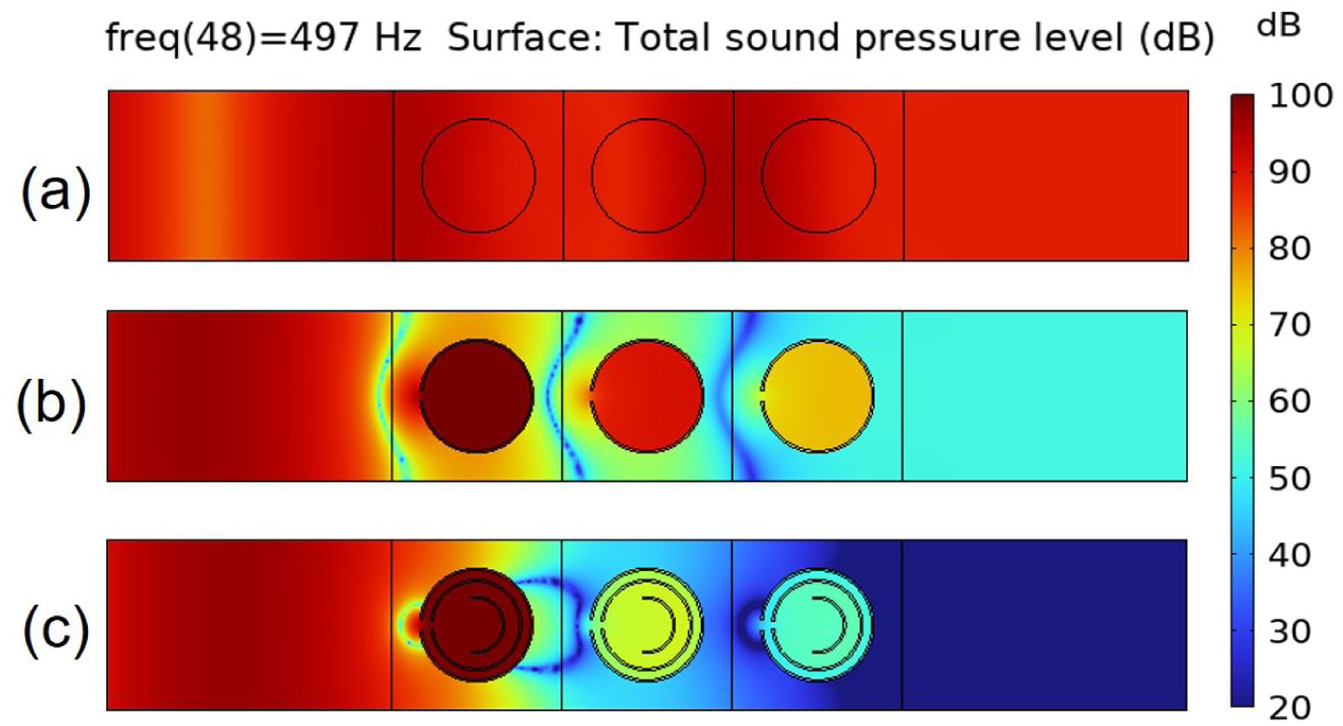
Plots of sound pressure distribution at incident frequency of 497 Hz, across an array of unit cells: (a) solid cylinder unit cells show no abrupt pressure changes indicating no acoustic resonance, (b) C-resonator unit cells, and (c) CCRSC unit cells show abrupt pressure changes near the scatterers indicative of acoustic resonance.
The variation in the opening angles and orientation angles of the C-resonators without changing the outer dimensions of the scatterers or the periodicity of the CCRSC, led to a change in the local resonance at the scatterers without significantly affecting the Bragg’s scattering effect. Hence, the variation in opening angles and orientation angles led to changes in the first band gap, which is due to local resonance at the scatterers. So, from hereon only the first band gap is studied in detail.
Validation of proposed theory
Figure 5 shows the numerical versus theoretical plots of central frequency and bandwidth of the first band gap of the studied designs
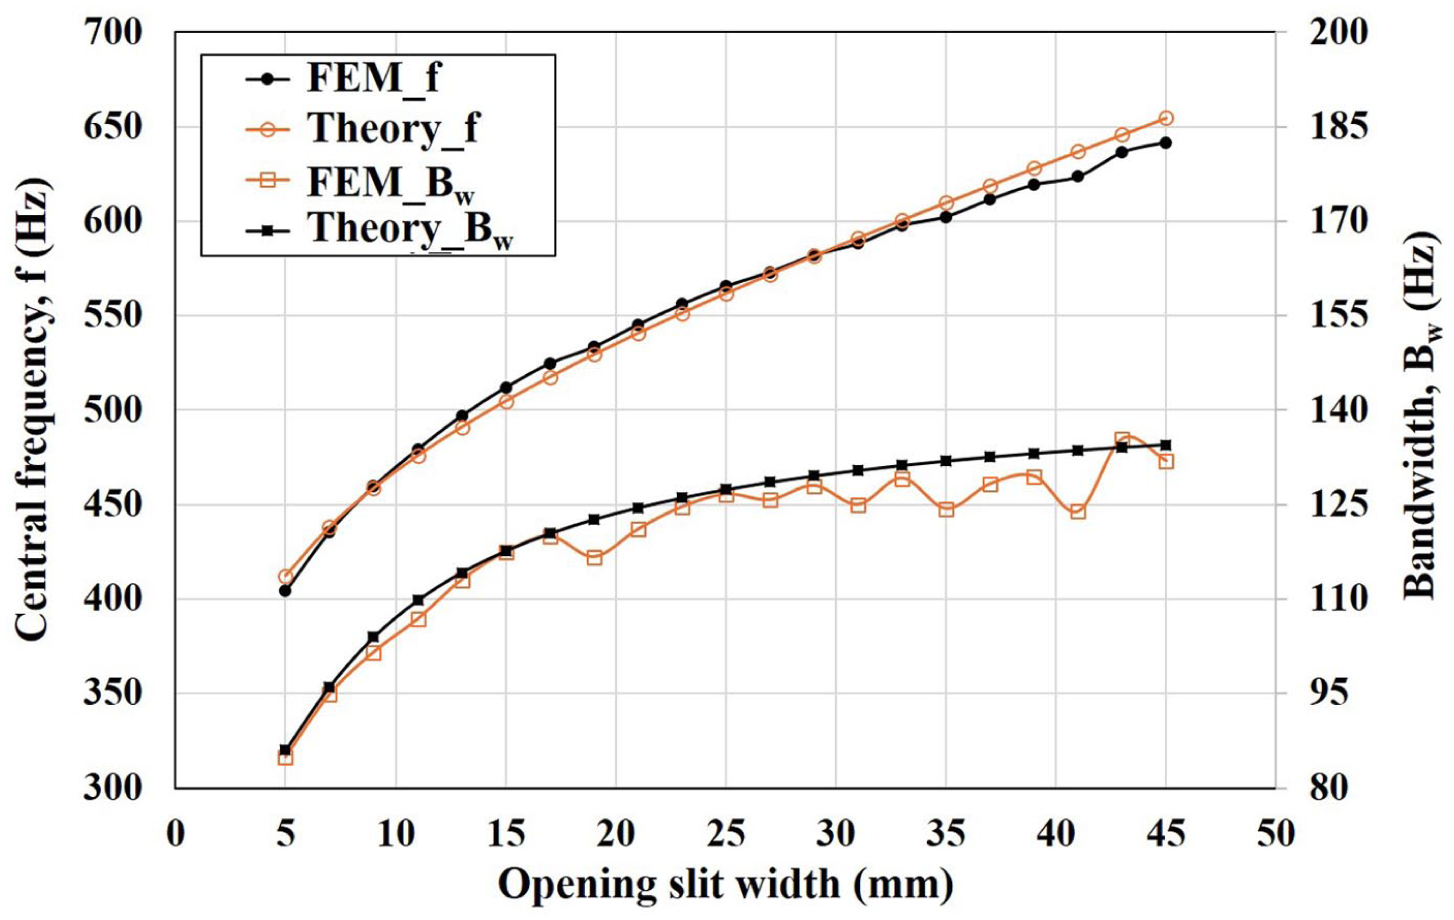
Comparisons of theoretically predicted and FEM simulation predicted central frequency and bandwidth of the first band gap of the proposed CCRSC.
Effect of opening angle of the resonant cavity
Figure 6 shows the contour plots of the variation in central frequency of the first complete band gap, for varying combinations of opening angles of the three concentric scatterers. Central frequency is strongly influenced by the opening angles, varying from 436 to 1056 Hz for the studied opening angle combinations. In general, the central frequency lowers with a decrease in the opening angles of each of the scatterers and vice versa. To get minimum central frequency of the first band gap the preferred configuration of opening angles is

Contour plots showing the variation in central frequency of the first band gap of CCRSC with variation in the opening angle of the middle and inner scatterers, when opening angle of outer scatterer is fixed.
Figure 7 shows the contour plots of the variation in bandwidth of the first complete band gap, for varying combinations of opening angles of the three scatterers. Bandwidth is strongly influenced by the opening angles, varying from 75 to 241 Hz for the studied opening angle combinations. The bandwidth of the first band gap in general increases with an increase in the opening angle of outer scatterer, except when the C-resonator becomes close to a semi-circle. The bandwidth further increases when at least one of the inner scatterer is close to a semi-circle (opening angle of
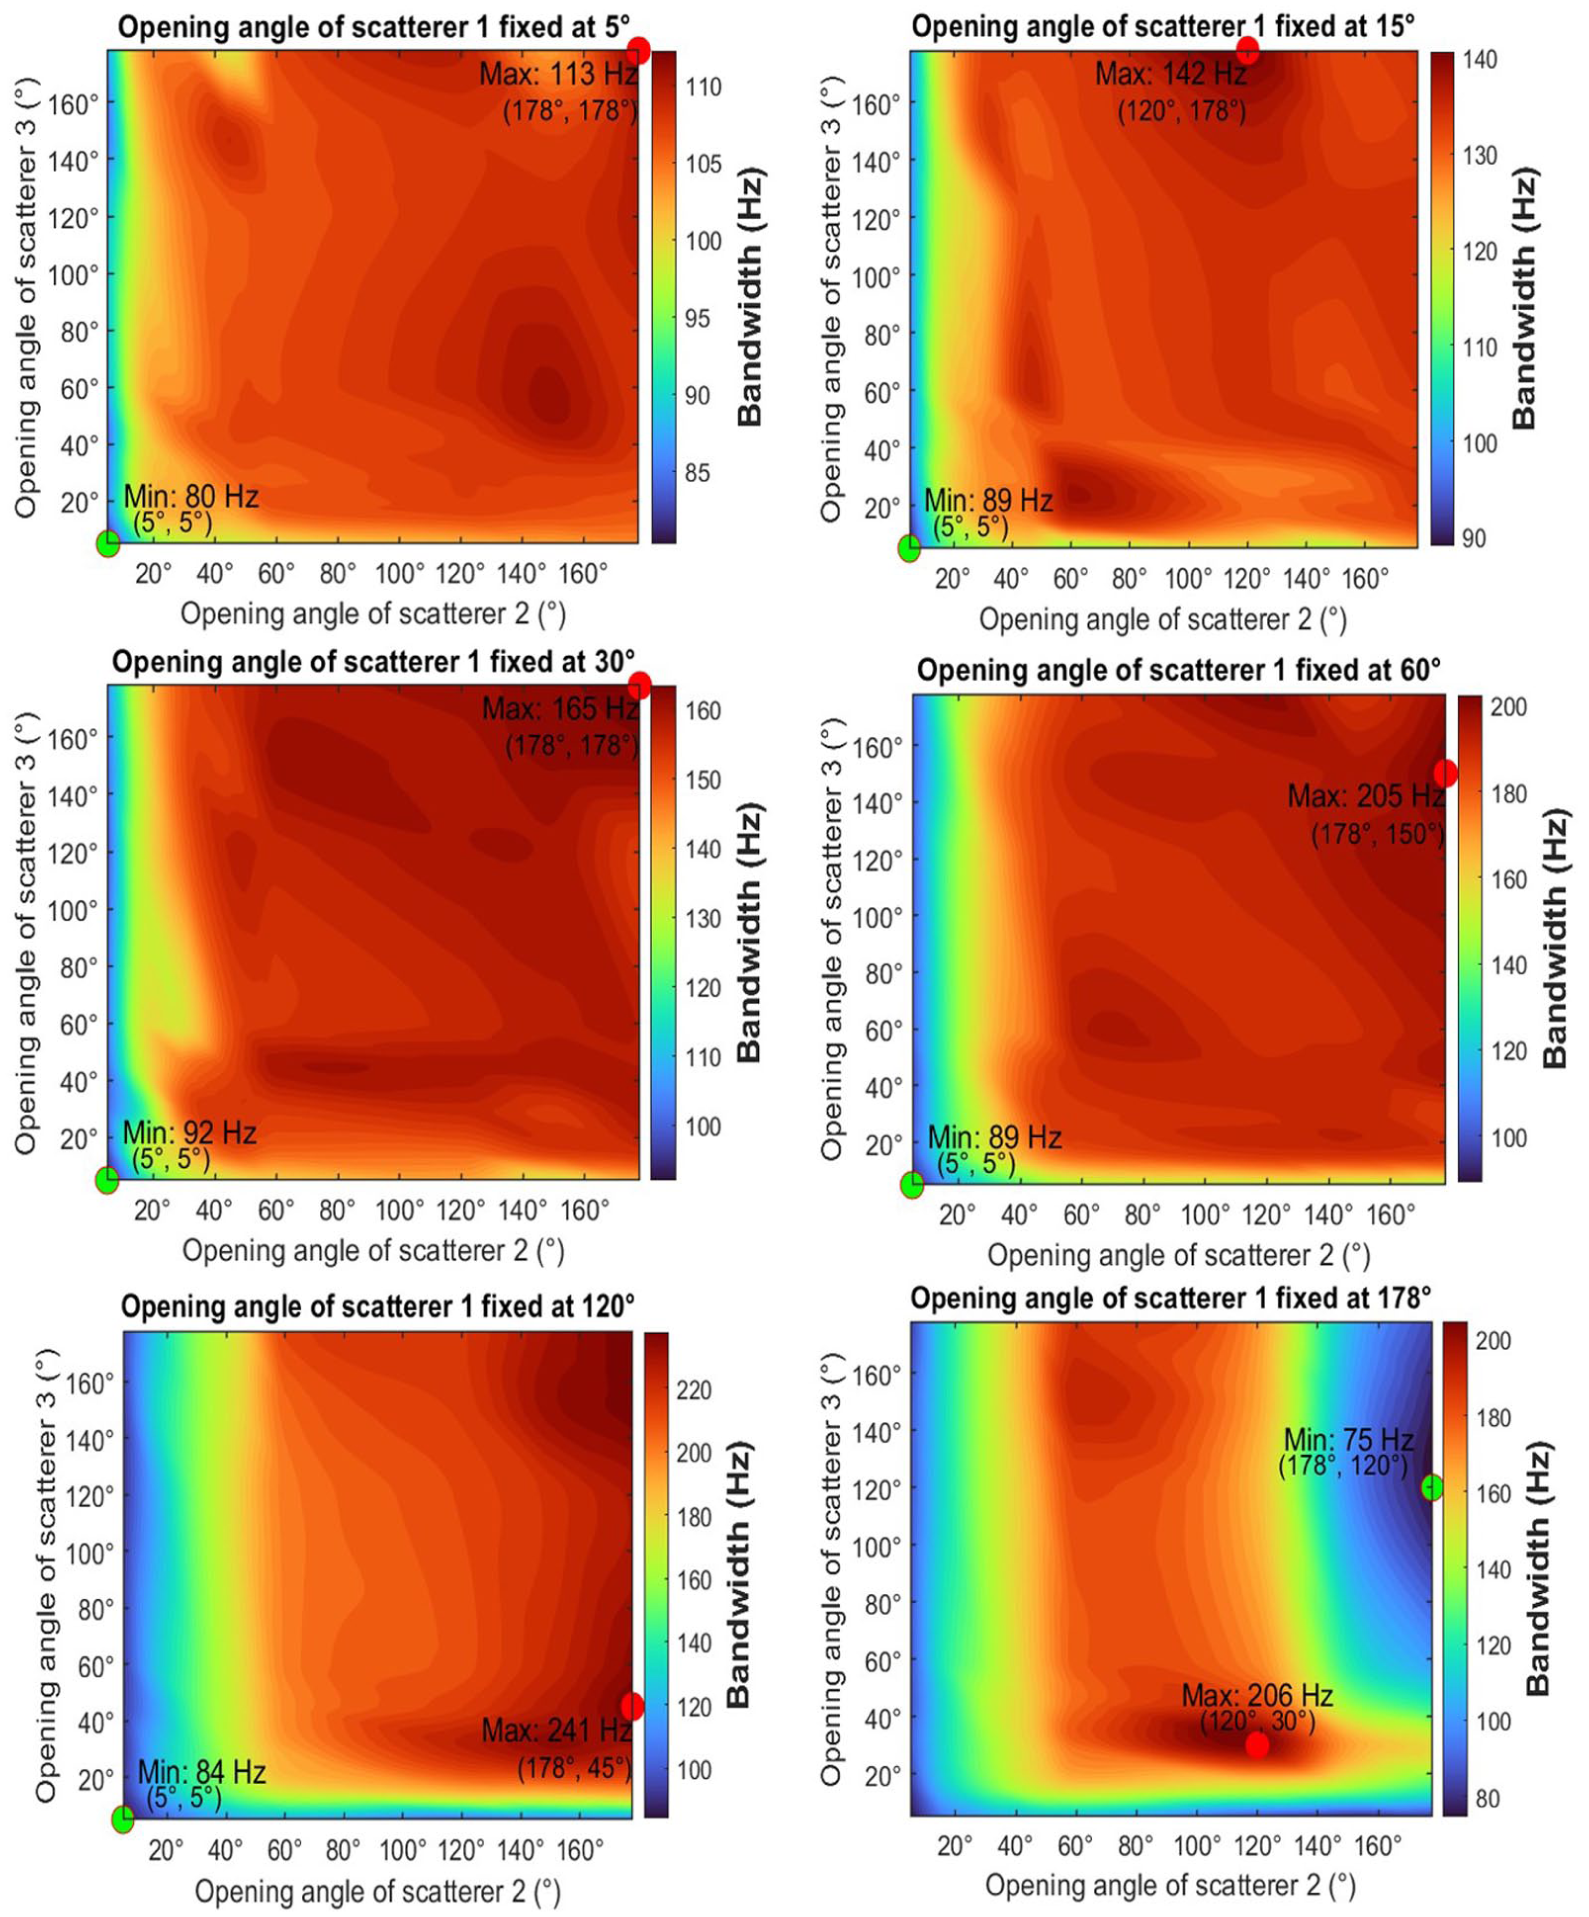
Contour plots showing the variation in bandwidth of the first band gap of CCRSC with variation in the opening angle of the middle and inner scatterers, when opening angle of outer scatterer is fixed.
Effect of scatterer orientation
The variation in the central frequency and bandwidth of the first complete bandgap with variation in orientation angle of scatterers is given in Figures 8 and 9 respectively. Central frequency is moderately influenced by the orientation angles, varying from 338 to 544 Hz for the studied orientation angle combinations. It is observed that the perfect alignment of all three scatterers, that is, when
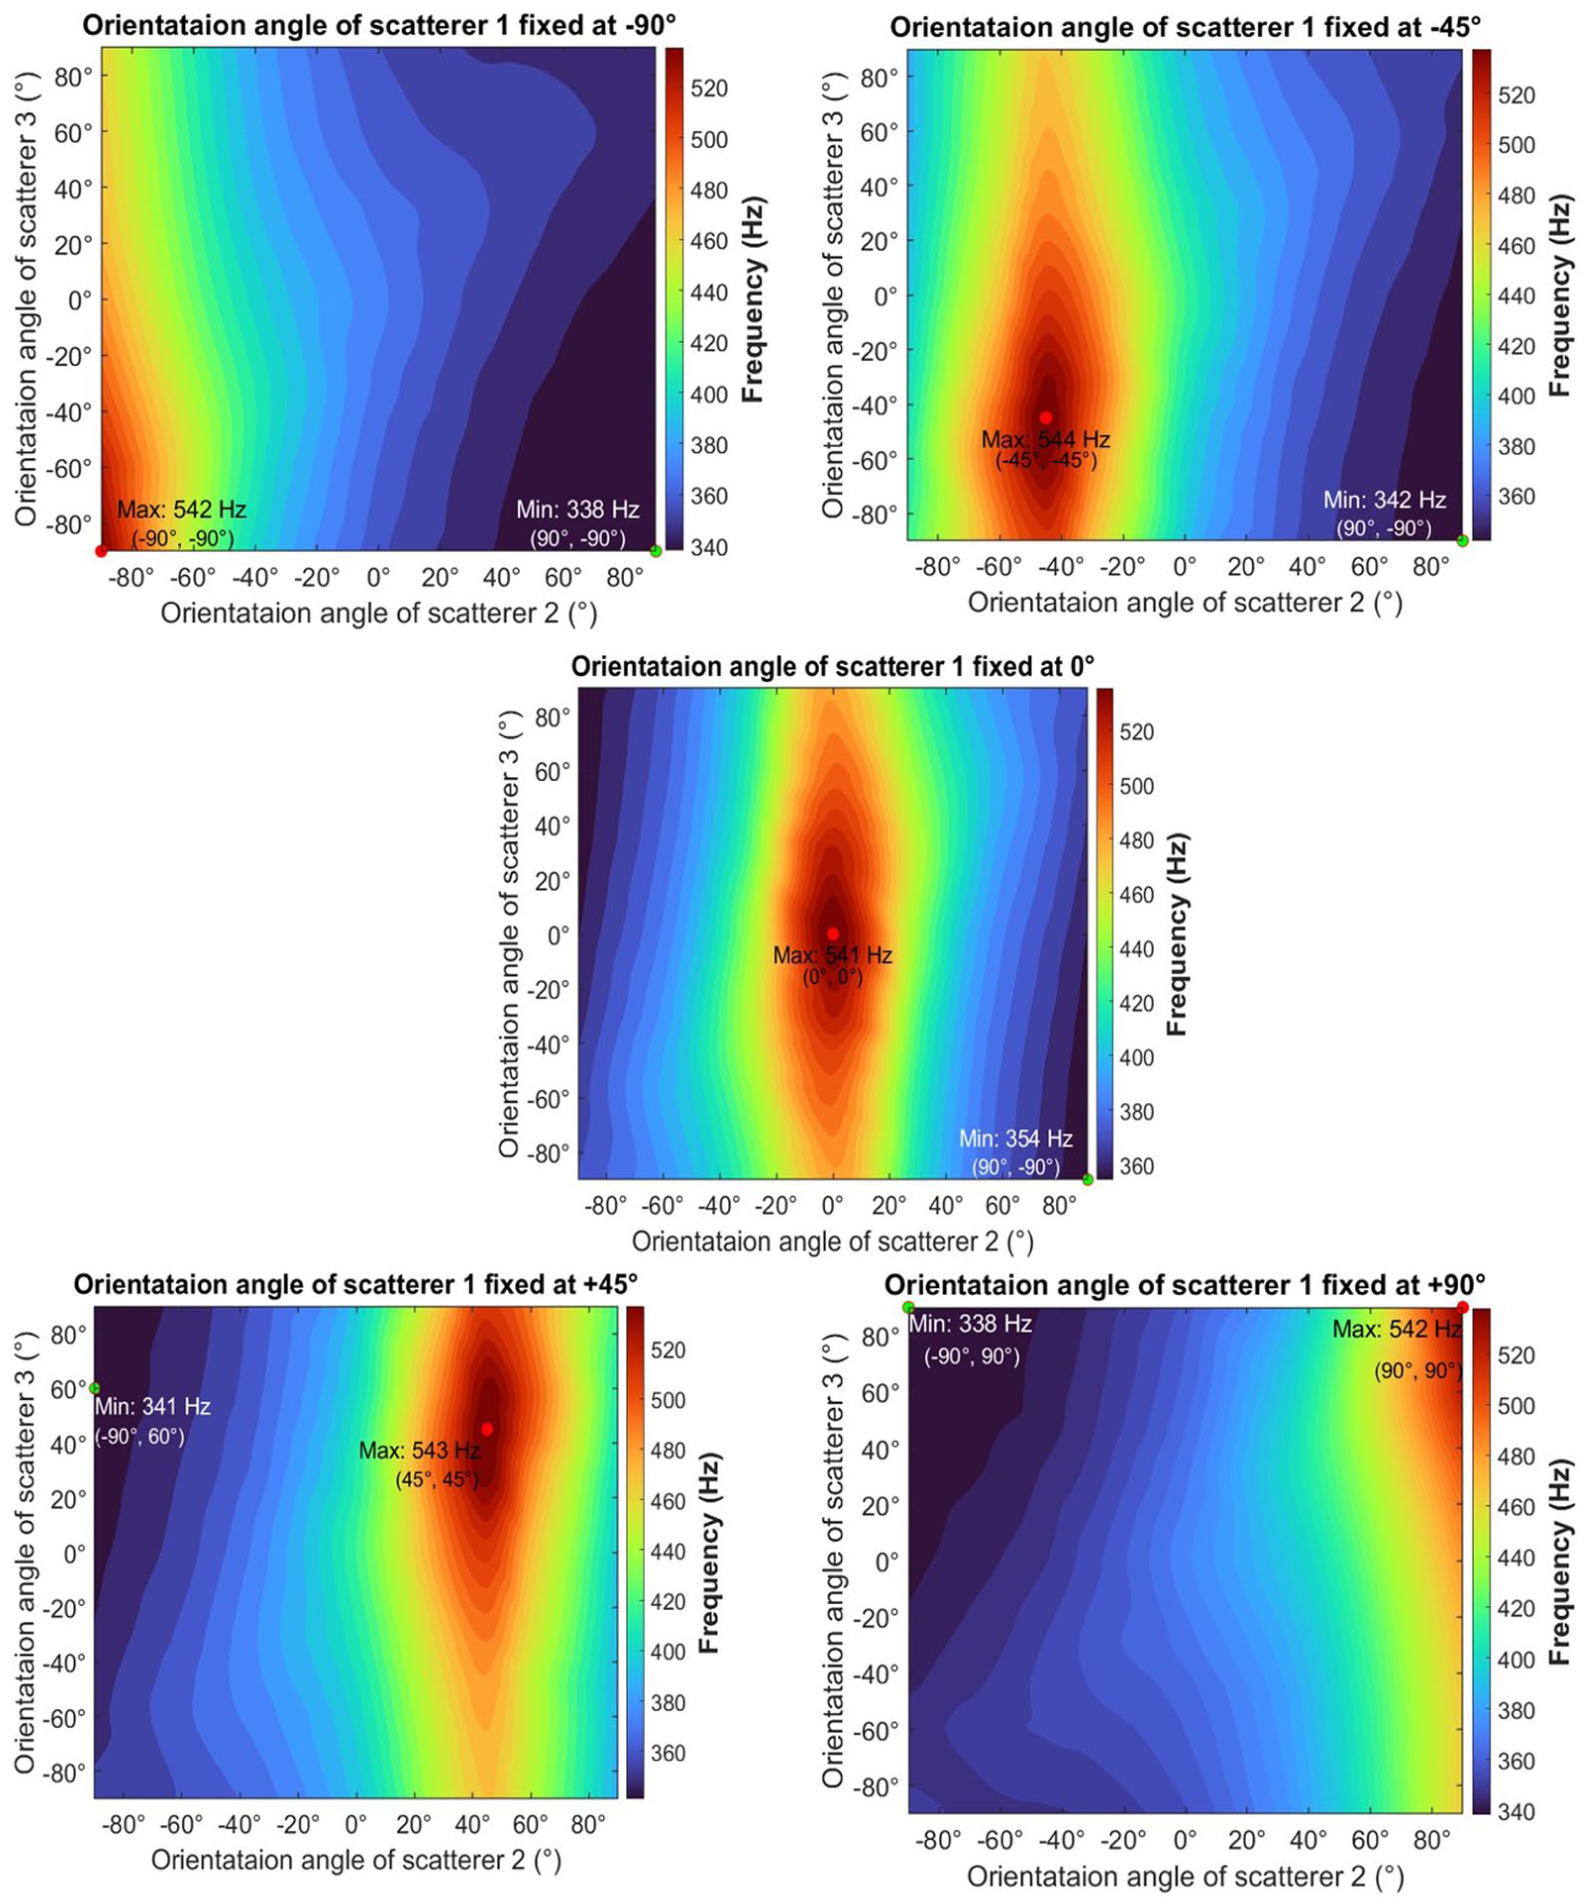
Contour plots showing the variation in central frequency of the first band gap of CCRSC with variation in the orientation angle of the middle and inner scatterers, when orientation angle of outer scatterer is fixed.
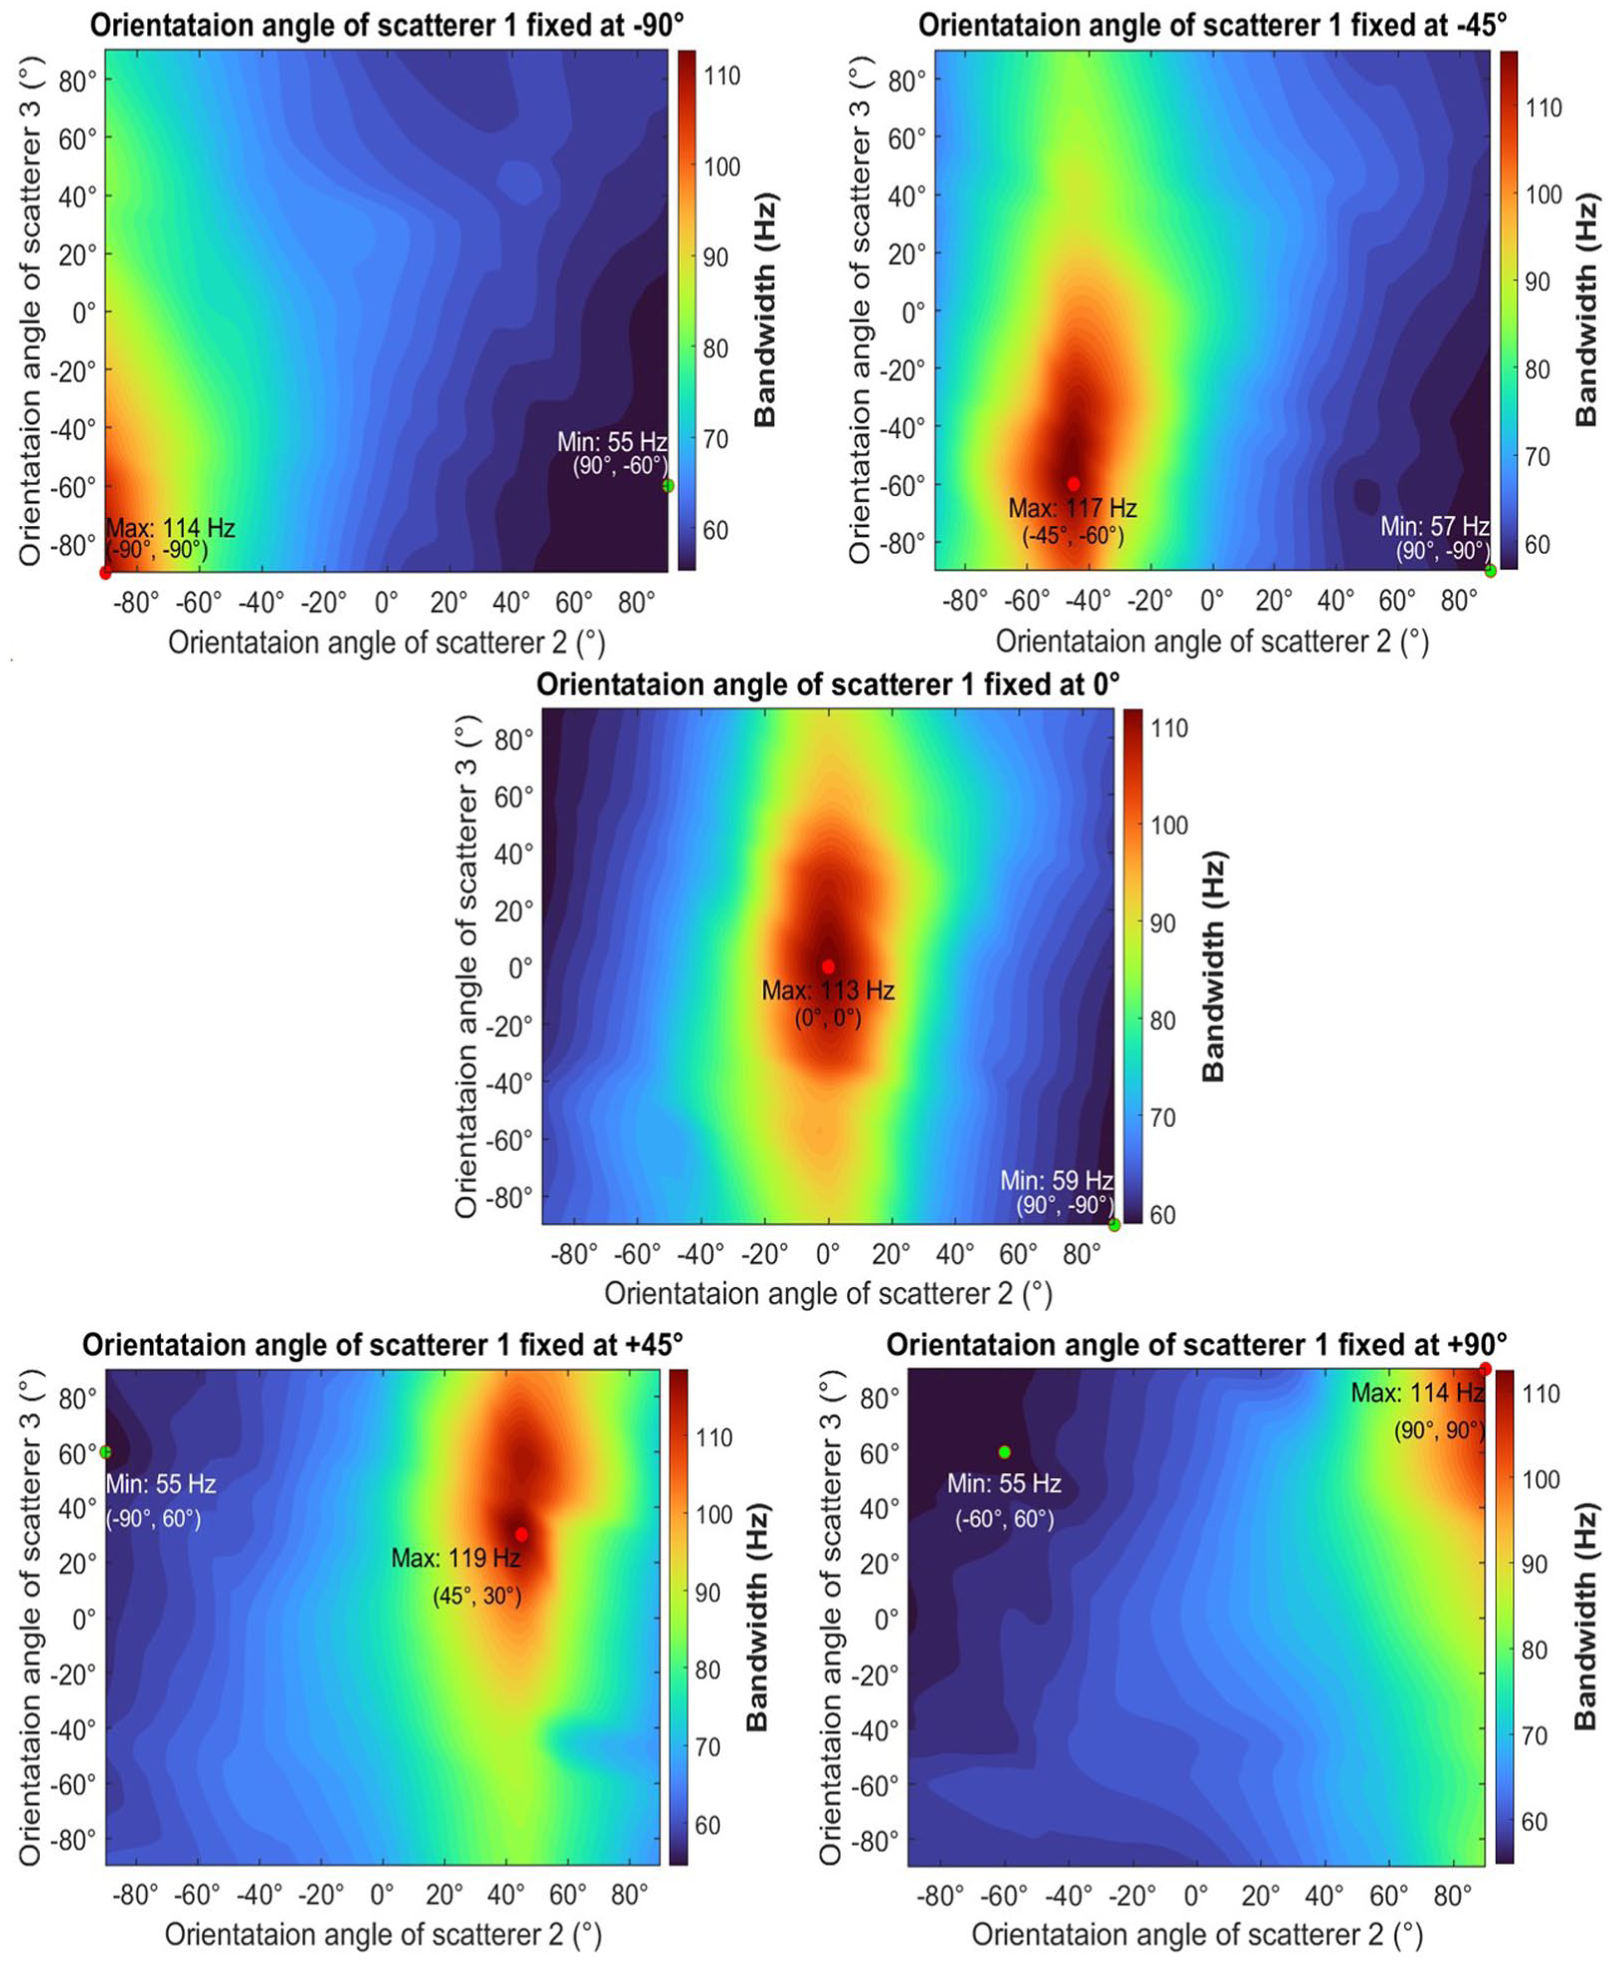
Contour plots showing the variation in bandwidth of the first band gap of CCRSC with variation in the orientation angle of the middle and inner scatterers, when orientation angle of outer scatterer is fixed.
Figure 10 shows the sound pressure distributions in aligned and misaligned configurations, where the length of adjacent rarefaction and compression that is,

Plots of sound pressure distribution at the central frequency of the first band gap, across an array of unit cells with: (a) aligned configuration and (b) misaligned configuration, which shows elongation of wave path length inside the scatterers in misaligned configuration.
Bandwidth is strongly influenced by the orientation angles, varying from 55 to 119 Hz for the studied opening angle combinations. However, the conditions for increase in bandwidth is opposite to that for decrease in central frequency. In general, the increase in alignment, that is
Optimization of the proposed C-shaped CCRSC
The massive
The optimization algorithm was demonstrated for two cases, namely, when the CCRSC needs to be implemented for (i) a low frequency noise source, and (ii) a high frequency noise source. Usually in noise control, it is desired to tune the band gap frequency of a sound attenuating structure to match the spectral peaks of the target noise source. Further, to increase the effectiveness of the sound attenuating structure, the bandwidth at the band gap needs to be broadened. Accordingly, the objectives of the optimization algorithm were set as follows, and the objectives functions are given by equations (22) and (23).
Case 1: Minimize central frequency and maximize bandwidth of the first band gap by configuring the scatterer orientations and opening angles: for low frequency noise source (typically between 100 and 500 Hz).
Case 2: Maximize central frequency and maximize bandwidth of the first band gap by configuring the scatterer orientations and opening angles: for mid to high frequency noise source (typically beyond 1000 Hz).


where,
The optimization algorithm of the proposed Kriging-assisted Multi Objective Genetic Algorithm (K-MOGA) for case 1 is given in Figure 11. K-MOGA was implemented using optimoptions(“gamultiobj”) MATLAB function, with population size as 500, maximum 2400 generations, and the function tolerance of 10−6. The lower bound (


Algorithm for optimization of scatterers’ orientation angles and opening angles in CCRSC, to minimize central frequency and maximize bandwidth of the first bandgap.
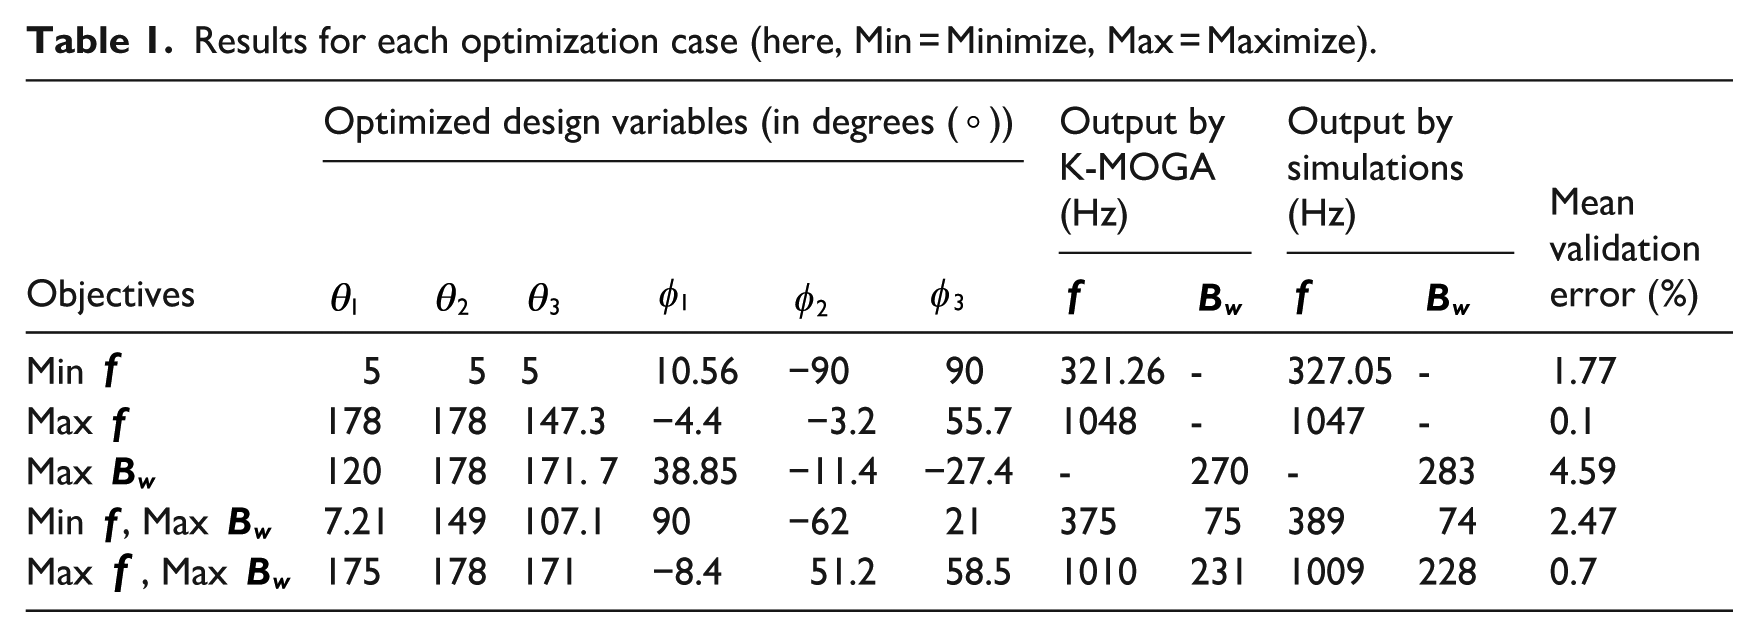
The visualizations of the optimal solutions by K-MOGA implementation in each case is shown in Figures 12 and 13. The optimized values of the response variables and design variables are presented in Table 1. In addition, Table 1 also shows the optimized configurations for individual objectives namely “minimize central frequency,” “maximize central frequency,” and “maximize bandwidth,” and their visualizations are added in Figure 14. The optimized designs were analyzed numerically in COMSOL Multiphysics and their performance compared with the K-MOGA solution.
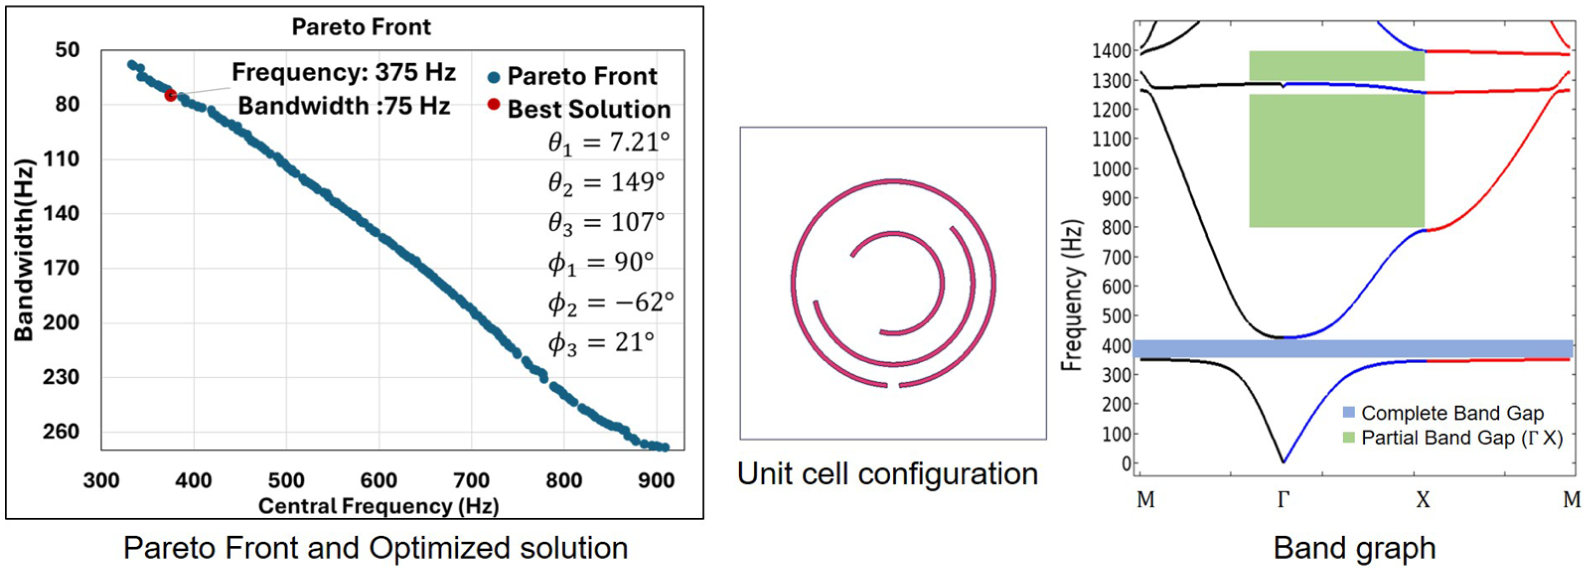
Pareto front of the optimization results, together with the optimized unit-cell configuration and its corresponding band graph for the objectives of minimizing the central frequency and maximizing the bandwidth of the first band gap of CCRSC.

Pareto front of the optimization results, together with the optimized unit-cell configuration and its corresponding band graph for the objectives of maximizing the central frequency and maximizing the bandwidth of the first band gap of CCRSC.
Results for each optimization case (here, Min = Minimize, Max = Maximize).

Optimized unit-cell configuration and its corresponding band graph for the single objectives, namely, minimizing central frequency, maximizing central frequency, and maximizing the bandwidth of the first band gap of CCRSC.
Figure 12 illustrates the optimal opening angle at 7.21°, 149°, 107° and optimal orientation angle at 90, −62, 21° of outer, middle, and inner scatterer respectively, for the combined objective of minimizing central frequency and maximizing bandwidth, which results in 375 Hz as central frequency with 75 Hz bandwidth. Numerical solution of this optimal combination gave central frequency at 389 Hz with 74 Hz bandwidth, with a relative validation error of 3.59% and 1.35% for central frequency and bandwidth respectively. The calculation of this validation error is shown in equation (25), where true value is FEM result and obtained value is optimization result. Similarly, Figure 13 shows the optimal opening angle at 175°, 178°, 171° and optimal orientation at −8.4°, 51.2°, 58.5° of outer, middle, and inner scatterer respectively, for the combined objective of maximizing central frequency and maximizing bandwidth, which gave central frequency and bandwidth of 1010 and 231 Hz respectively. Corresponding numerical results were 1009 and 228 Hz, with validation error of 0.1% and 1.31% in central frequency and bandwidth respectively.
In this way, the optimization results were numerically validated for all cases with mean relative error of 1.39% and 2.42% for central frequency and bandwidth respectively (refer to Table 1), as calculated using equation (26). It is also observed that configurations of “maximizing central frequency and maximizing bandwidth” is very similar to the single objective of just “maximizing central frequency.” It is Case 1 that is tricky due to the tradeoff between minimizing central frequency and maximizing bandwidth.


Experimental verification
To validate our developed theoretical model and the findings from FEM study, a prototype of the proposed CCRSC was fabricated using commercially available PVC pipes with inner radii of outer, middle, and inner scatterer as 55, 45, and 25 mm respectively with wall thickness of 2 mm. These radii were chosen as they were the only commercially available options that came closest to our studied radii values of 50, 40, and 25 mm respectively. Each pipe was cut to a length of 1000 mm, and a 30 mm longitudinal slot was cut along the length of the pipe using table saw to give each pipe an opening width
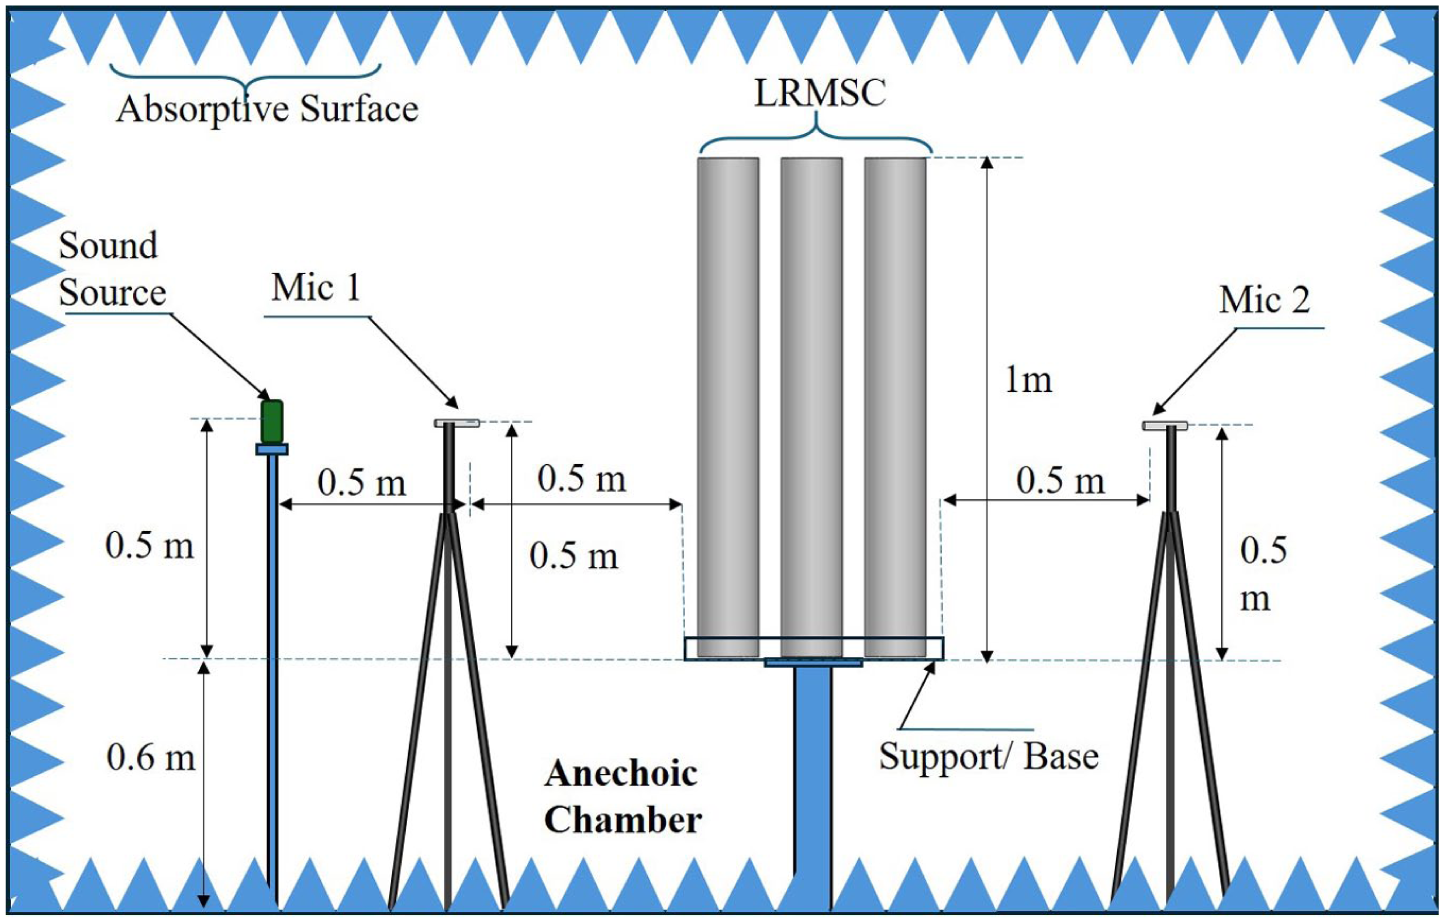
Schematic side view of the experimental transmission loss measurement setup inside the anechoic chamber.

Experimental setup for transmission loss measurement: (a) view from the source side, (b) view from the receiver side, (c) data visualization, (d) experimenter, (e) data acquisition system, (f) 3D printed sample (g) sample with configuration 1, (h) sample with configuration 2, and (i) microphones.
A single diaphragm monopole speaker was kept at a distance of 1 m from the CCRSC and it played harmonic tones at different frequencies, one at a time. The sound pressure levels from the microphone were acquired using a National Instruments make, NI cDAQ-9174 type nine channel acquisition system at the sampling rate of 10,000 samples/second (refer to Figure 16(e)). The height of source, microphones, and sound source were maintained 500 mm above from the CCRSC base as shown in Figure 15. The experiment was conducted for the targeted frequencies from 170 to 1600 Hz and transmission loss values were determined for each frequency as the difference in SPL received at microphone before and microphone after the sample. Two different experimental configurations were analyzed. First with all scatterers oriented at 0° as shown in Figure 16(g), and second with the changed orientation of outer, middle, and inner scatterer at 90°, −90°, 90° respectively as shown in Figure 16(h).
Transmission loss spectrum analysis
For a one-to-one comparison between experimental and numerical results, a 2D model of the same CCRSC structure, as used in the experiments, was modeled in COMSOL Multiphysics with inner radii of 55m, 45, and 25 mm for outer, middle, and inner scatterer respectively as shown in Figure 17. Pressure acoustic frequency module of COMSOL Multiphysics was used to calculate the TL spectra. Perfect matching layer (PML) was applied to minimize the reflection and replicate similarity with experimental study. TL spectra was analyzed using monopole sound source of amplitude 1 Pa (94 dB) with nonlocal integration couplings. The TL was then calculated using the equation (27) using acoustic pressure obtained at the output port (


2D FEM model used for transmission loss analysis for one-to-one comparison with experimentally measured transmission loss. The CCRSC array is placed surrounded by perfectly matched layer (PML) to simulate free field condition equivalent with absorptive lining in anechoic chamber.
Results and discussions
Figure 18 shows the results of experimental verification for configuration 1 and configuration 2 respectively. For configuration 1, the numerical and experimental TL spectra match very closely with each other. Moreover, all the frequency bands containing the TL peaks in the experimental and numerical results correspond to the complete and partial band gaps found in the band graph of the studied CCRSC. The first band gap is obtained between 470 and 595 Hz using numerical simulation and between 450 and 610 Hz (i.e. frequency band between first and third peak) in experimental TL spectra. This gives the central frequency of the first band gap as 532.5 Hz numerically, 530 Hz experimentally, and both of them match very closely with the central frequency predicted from our proposed theoretical model at 531 Hz. Thus, the sound attenuation performance of the proposed CCRSC configuration 1 is experimentally verified.

Comparisons of experimentally measured transmission loss (TL), FEM predicted TL and theoretically predicted central band gap frequency, of CCRSC configuration 1 (
For configuration 2 also, the numerical and experimental TL spectra match closely with each other, albeit with slight discrepancies in the first band gap, as shown in Figure 19. Moreover, the frequency bands containing the TL peaks in the experimental and numerical results for most of the cases correspond to the complete and partial band gaps found in the band graph of the studied CCRSC (with slight differences in the first band gap). Thus, the sound attenuation performance of the proposed CCRSC configuration 2 is also experimentally verified. The reason for the slight differences could be slight tilt in the sample that was supposed to be exactly vertical and slight change in orientation from the 90°, −90°, 90° configurations due to unavoidable human errors. For both configurations, experimental results show multiple TL peaks of more than 20 dB, within 1500 Hz; thus highlighting the effectiveness of the proposed CCRSC for low frequency sound attenuation. Experiments further prove that for the same fabricated samples, just a real time change in orientation can drastically change the TL peaks, which demonstrates the capability for tuning the sound attenuation performance in real time of the proposed CCRSC.

Comparisons of experimentally measured transmission loss (TL), FEM predicted TL and theoretically predicted central band gap frequency, of CCRSC configuration 2 (
Conclusions
This paper proposes and validates the semi-empirical theoretical model of the fundamental frequency of the unit cell of the proposed novel CCRSC structure. It is proved that the first band gap of CCRSC is due to local resonance, and it can be tailored by varying the opening angle and/or orientation angle of the resonant cavity of the CCRSC. This provides a crucial way of real-time tuning of the band gap frequency without changing the dimensions of either the unit cell or the overall structure. Central band gap frequency is found to decrease with decrease in opening angles of each scatterer due to decrease in the fundamental frequency of the unit cell. Whereas the increased misalignment of each adjacent pair of scatterers increases the path length of wave structure interaction, which increases resonance wavelength, lowers resonance frequency, thus the first band gap forms at lower frequencies. Band width of the first band gap follows a complex relationship, but for most cases, it increases with increase in opening angles and orientation alignment. A Kriging-assisted Multi Objective Genetic Algorithm (K-MOGA) is developed and validated for optimizing the scatterers’ opening angles and orientations to obtain desired central frequency of the first band gap with maximized bandwidth. The results are experimentally verified in an anechoic chamber where transmission loss spectra of CCRSC shows multiple tunable peaks of more than 20 dB, within 1500 Hz.
This paper provides a new theoretical model and innovative knowledge on the effects of the geometry of the scatterers’ resonant cavity on sound attenuation by CCRSC. Importantly, it proposes a novel K-MOGA optimization for real-time tuning of the sound attenuation in a Sonic Crystal without changing its dimensions. The presented findings should be interpreted in light of certain limitations. The study was restricted to the optimization of the first band gap and to configurations consisting of three concentric C-shaped scatterers with fixed sizes. Furthermore, the experimental analysis was conducted using a finite 3 × 4 array of CCRSC, and scaling the design for practical large-scale barrier implementation requires further investigation.
Footnotes
Acknowledgements
We would like to thank Professor Rajib Kumar Panigrahi for providing us the access to the Anechoic chamber facility of the Department of Electronics and Communication Engineering, IIT Roorkee. We would also like to thank Mr. Kamveer Maurya, Lab assistant, Microwave lab for his cooperation in conducting experiments done in the anechoic chamber. We also thank Mr. Siddharth Shrivastava and Miss Moh Moh Myint Thu for helping in the experiments.
Ethical considerations
This article does not contain any studies with human or animal participants.
Consent to participate
There are no human participants in this article and informed consent is not required.
Consent for publication
Authors confirm that consent has been obtained from all individuals who were directly or indirectly involved in this research work.
Author contributions
Chetan A Chalurkar: Methodology, Investigation, Analysis, Writing – Original, Visualization, Experiments. Sneha Singh: Conceptualization, Methodology, Analysis, Writing - Original, Supervision, Project administration.
Funding
The authors received no financial support for the research, authorship, and/or publication of this article.
Declaration of conflicting interests
The authors declared no potential conflicts of interest with respect to the research, authorship, and/or publication of this article.
Data availability statement
Data can be made available upon request sent to the corresponding author.