
Abstract
The room acoustics design of concert halls plays an important role in sound quality, and machine learning has been proposed as an advanced approach for predicting room acoustics. However, previous studies often use geometric (such as length, width, and height) and material parameters as features, resulting in high accuracy but limited generality when applied to different room types. Hence, this study proposed a machine learning based parametric design framework on the Rhino-Grasshopper platform. The approach used distributed equivalent absorption areas as features by considering the importance of the first reflection in concert halls, thus improving generality in the early design stage. Trained on a dataset combining two different types of concert halls, the fivefold cross-validation results demonstrated that the Mean Absolute Percentage Error (MAPE) for Reverberation time (T30) and the Root Mean Square Error (RMSE) for both Clarity 80 (C80) and Sound strength (G) remained within 1 Just Noticeable Difference (1 JND). The high accuracy highlights the advantages of this framework in comparing different types of concert halls and broadens the capability of architects to optimize design proposals in the early design stage.
Introduction
Music, space, and region were inseparable before contemporary room acoustic science was established. In the Middle Ages, music often featured slow, sustained tones, influenced by the spacious volumes of heavy stone-built churches, 1 which contributed to high reverberation times. After the Renaissance, the richly decorated churches, with their shorter reverberation times, fostered the expressive and exquisite forms of baroque music. 2 Since reverberation time was defined, 3 room acoustics have become designable.
Nowadays, acoustic simulation tools enable the prediction and evaluation of room acoustic quality before construction.4,5 Moreover, acoustic performance-based design has been applied in the design of acoustical buildings to balance different architectural requirements, including esthetics, cultural, and acoustic performance.6,7 In addition, design methods that shape spaces according to defined acoustic qualities have also been developed. 8 In the early design stage, combining parametric design allows architects to explore more possibilities for design proposals. 9 As a tool to support such exploration, Pachyderm 10 is an acoustic simulation plug-in for Rhino Grasshopper, a widely used parametric design modeling tool in architecture. It has been validated through comparisons with measurements and other simulation tools,11 –13 and has been used to study concert hall optimization, 14 evaluate the performance of narrow street façades, 15 and generate data for machine learning in the design of educational buildings. 16
Though acoustic simulation is widely used, it takes a lot of time to evaluate design proposals.17,18 To accelerate the process, recent studies have explored the potential of using machine learning as a substitute for simulations. 19 Nannariello and Fricke 20 collected datasets of 71 reverberation times from references, using maximum length, width, height, and absorption coefficient as eigenvalues for machine learning, and the prediction shows an error of 2%–38%. Broyles and Rusk 21 collected reverberation time data from 50 concert halls of different types, applying Random Forest. The MAPE of the prediction is noticeably lower than that of Sabine and Eyring equations. Yeh and Tsay 22 used a measurement-calibrated classroom model to generate datasets of 800 simulations by applying different shapes and absorption coefficients. The RMSE and MAPE of each acoustic index prediction through the GBDT model are all under 2 JND. Falcon Perez 23 proposed a machine learning framework using panoramic photo pixels multiplied by the absorption coefficient as eigenvalues to improve the limitations of the Sabine’s equation. The accuracy of the prediction is twice that of the Sabine’s equation. Manesh et al. 16 generated simulation datasets using Pachyderm in Rhino Grasshopper and employed CatBoost and Generative Adversarial Networks (GANs) models to predict acoustic indices such as T30, EDT, C80, D50, and STI, including heatmaps. Borrel-Jensen et al. 24 used transfer learning to predict sound propagation in different 3D scenes.
Although predictions of room acoustic quality have significantly diversified, architects still tend to rely on Sabine’s equation or simple acoustic simulations during the early design stages. This may be due to the fact that most of the aforementioned studies are based on constant environments, such as fixed source positions. 25 Moreover, room acoustic simulations are often employed to ensure acoustic quality after the design has been finalized. The process of translating models and exchanging information between architects and acoustic engineers, 26 even in cases of good collaboration, can be time-consuming.
For concert hall design in the early design stage, estimating room acoustic quality is essential to support architects’ free-spirited design ideas. The aim of this study is to propose a machine learning framework that streamlines the process between architects and acousticians, allowing architects to explore more possibilities in concert hall design. With the advancement of acoustic simulation and machine learning technologies, the concert hall design can become more unrestricted, allowing architects to break from traditional typologies and explore spatial forms and esthetics. By moving beyond the constraints of typological rules, concert hall design can transcend limitations and inspire new realms of creativity.
Method
The workflow of this study is shown in Figure 1. The following steps were all conducted on Rhino-Grasshopper platform to integrate with parametric design for architectural applications. First, two parametric models, representing shoebox and surround-type concert halls, were developed and used to perform acoustic simulations. The resulting acoustic indices, combined with normalized geometric features obtained by splitting the parametric models, were prepared as datasets, intermixed and shuffled to ensure diversity and minimize potential biases. Following fivefold cross-validation, the datasets were split into 80% for training and 20% for validation. Finally, the prediction accuracy, assessed through Mean Absolute Percentage Error (MAPE) and Root Mean Squared Error (RMSE), was compared with Sabine’s equation, and evaluated using the Just Noticeable Difference (JND).
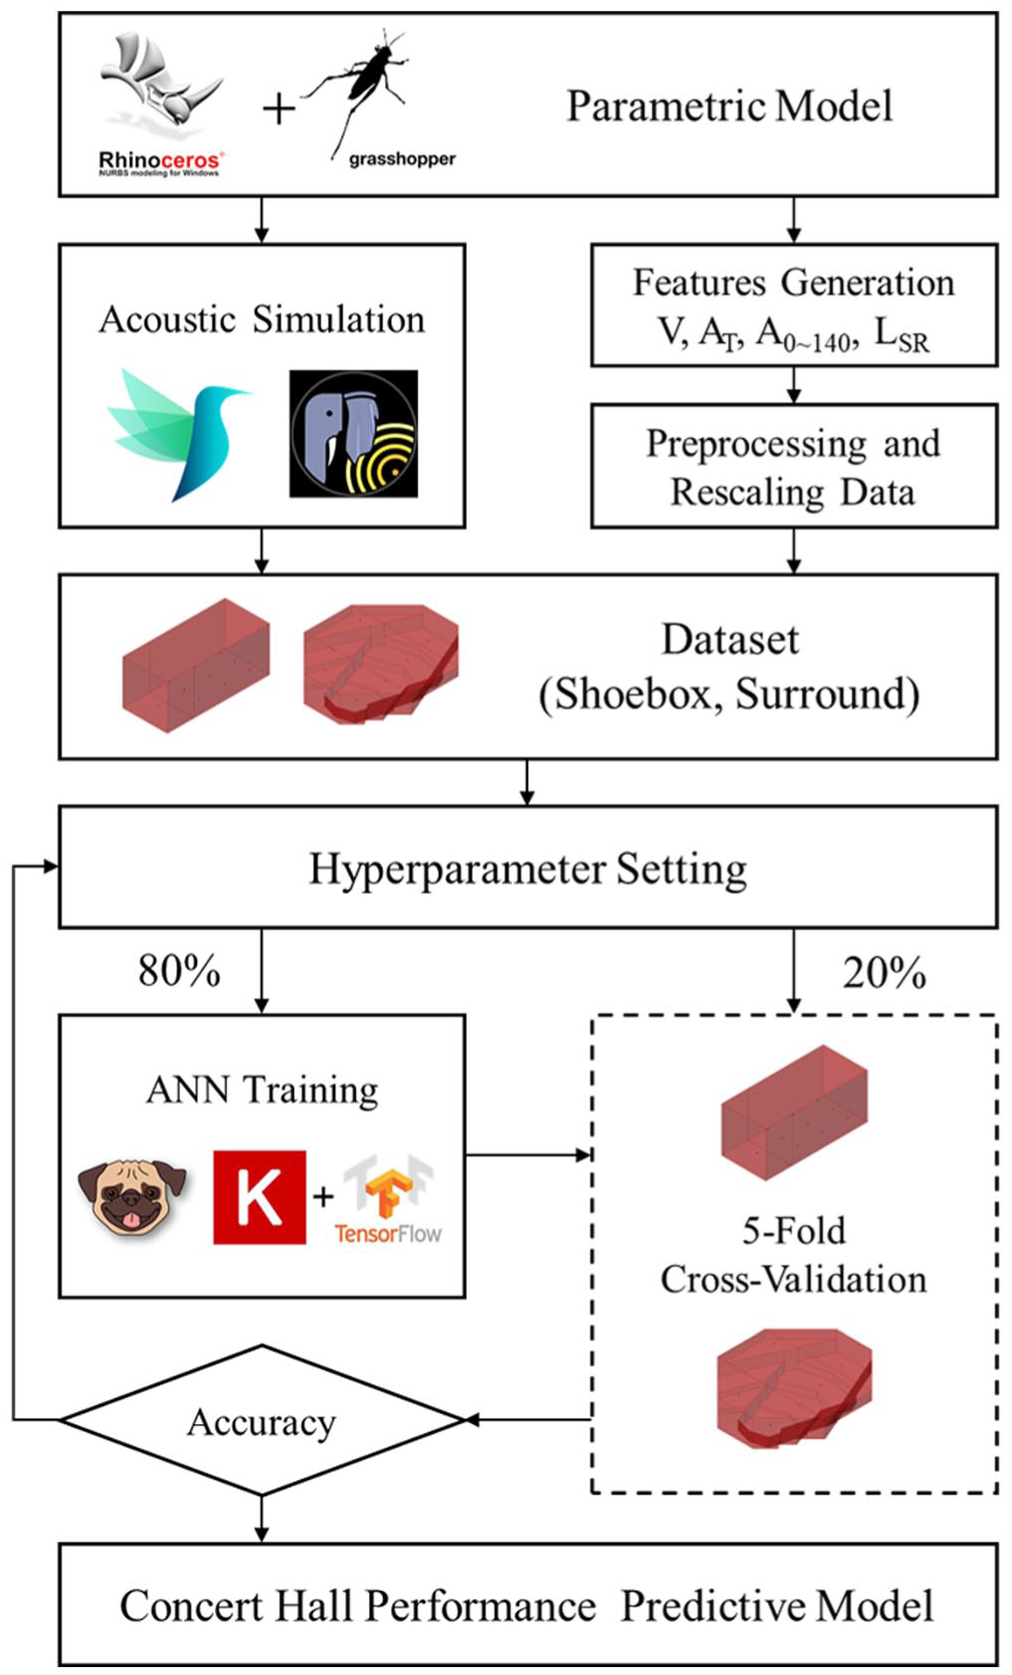
Workflow: model construction, acoustic simulation, and ANN prediction.
Indices for room acoustics evaluation
In the early design stage of concert halls, the room acoustic quality assessment of the entire space is the main concern for architects when adjusting design proposals. Hence, not all acoustic indices are equally suitable, it is necessary to select those that provide critical information relevant to the study’s purpose. 27 Reverberation Time (RT) 3 plays a significant role in room acoustic quality and is also known as the “mother” of room acoustic indices. 28 However, reverberation time cannot fully represent the auditory experience. 29 It describes the dissipation of sound energy within a space but lacks information about sound energy direction and distribution. To analyze energy distribution over time, Clarity 30 is an appropriate acoustic index that describes the ratio of early to late energy. Specifically, Clarity 80 (C80), which considers 80 ms as the boundary between early and late reflections, is often used to study the music clarity of concert halls. 31
In concert hall design, geometry is an important factor that affects early reflections, leading to a good acoustic experience for the audience. 32 Sound Pressure Level (SPL) is another important acoustic index that describes energy distribution and is often evaluated through relative SPL in concert hall design.33,34 To provide a more normalized evaluation independent of the sound source level, Sound strength (G) is utilized in this study.
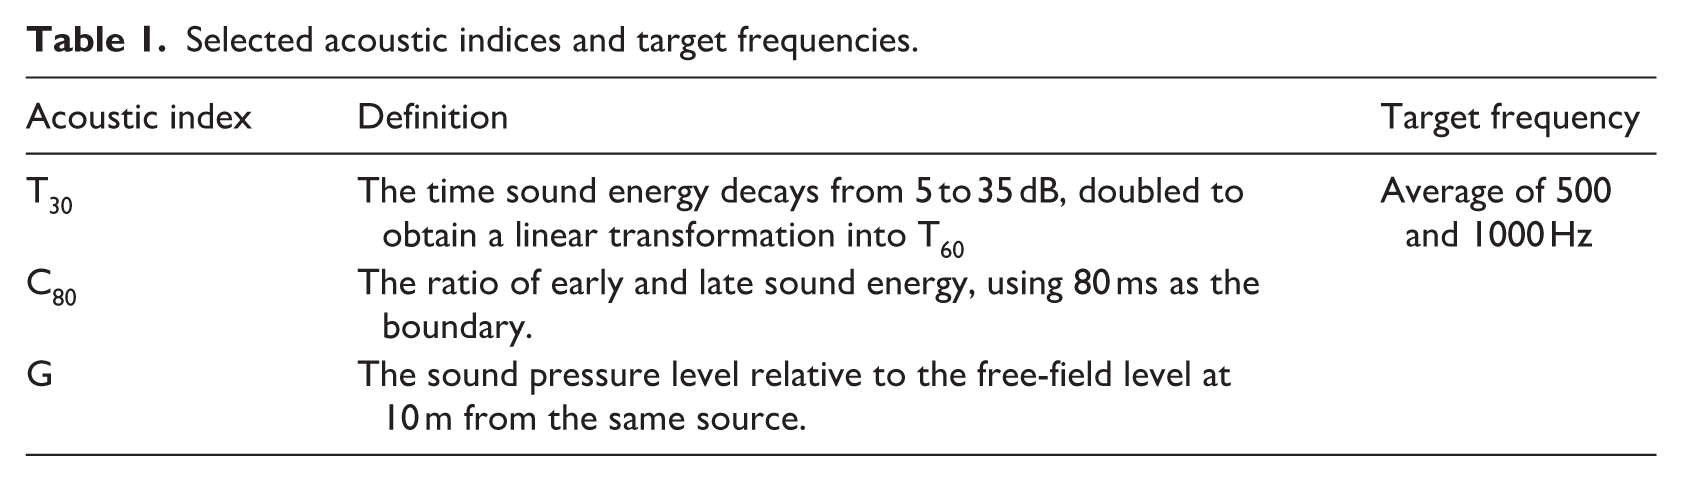
To summarize, three acoustic indices were chosen to evaluate room acoustic quality in the early design stage of concert hall design, as shown in Table 1. For T30, the values were the average of all receivers, whereas C80 and G were analyzed individually at each receiver. The target frequencies were the average of 500 and 1000 Hz in this study. 35
Selected acoustic indices and target frequencies.
Parametric models and boundary conditions
The two parametric models, representing shoebox and surround-type (also known as vineyard-type) concert halls as shown in Figure 2, were simplified from the Großer Musikvereinssaal and the Berliner Philharmonie by adopting similar shape, volume, and overall proportions.36,37 These parametric models were established in Rhino-Grasshopper to support later acoustic simulations.
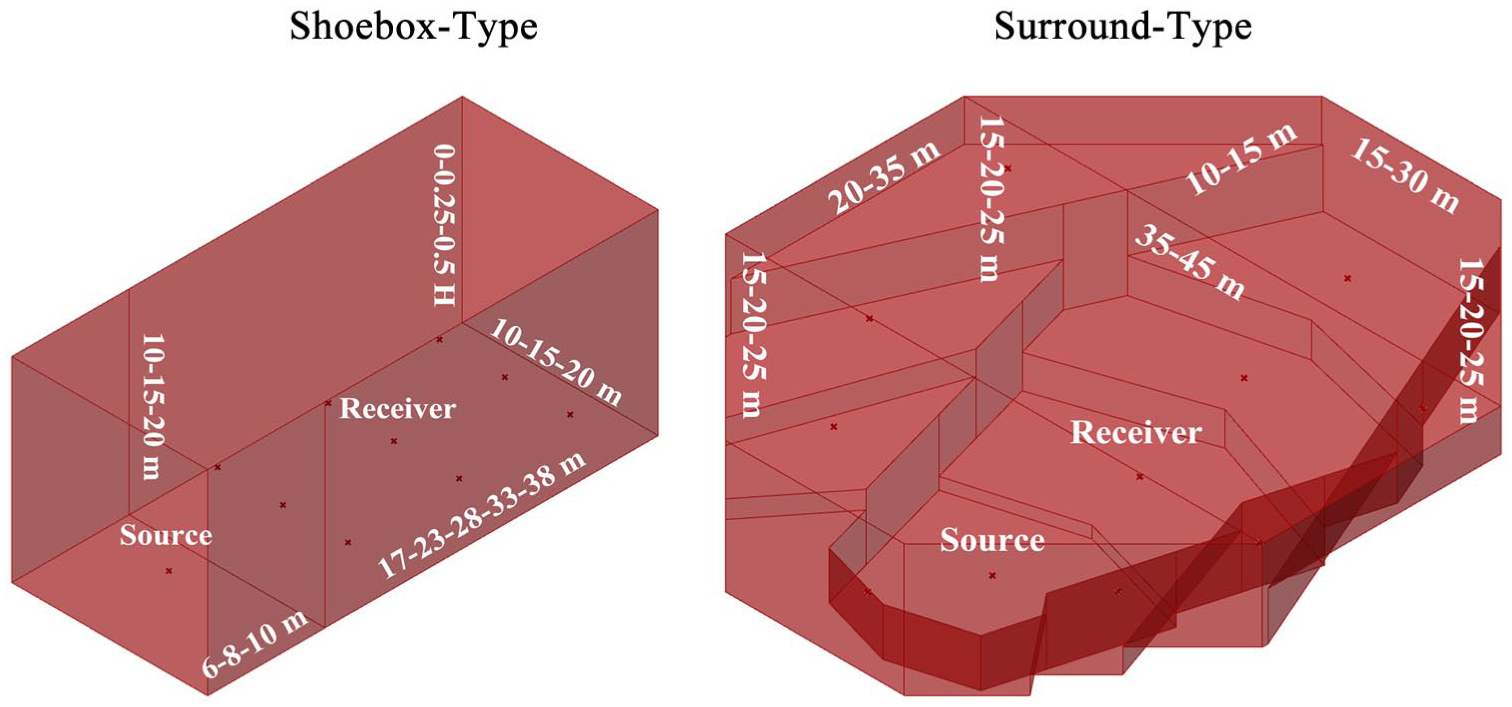
Parametric variations of shoebox and surround-type models.
The geometry variables of the shoebox-type parametric model include length, stage depth, width, height, and lift, resulting in 405 combinations. These variables show the possibilities of shoebox-type concert hall designs, such as wider or taller configurations and the slope of raked auditorium floor. The geometry variables of the surround-type parametric model include the length, width, and height of each section, resulting in 432 combinations. These variables emphasize the boundary and ceiling geometry angles, highlighting the importance of side walls and ceiling design in surround-type concert halls. Both parametric models were simplified and exhibit axial symmetry to reflect conditions during the early design stage.
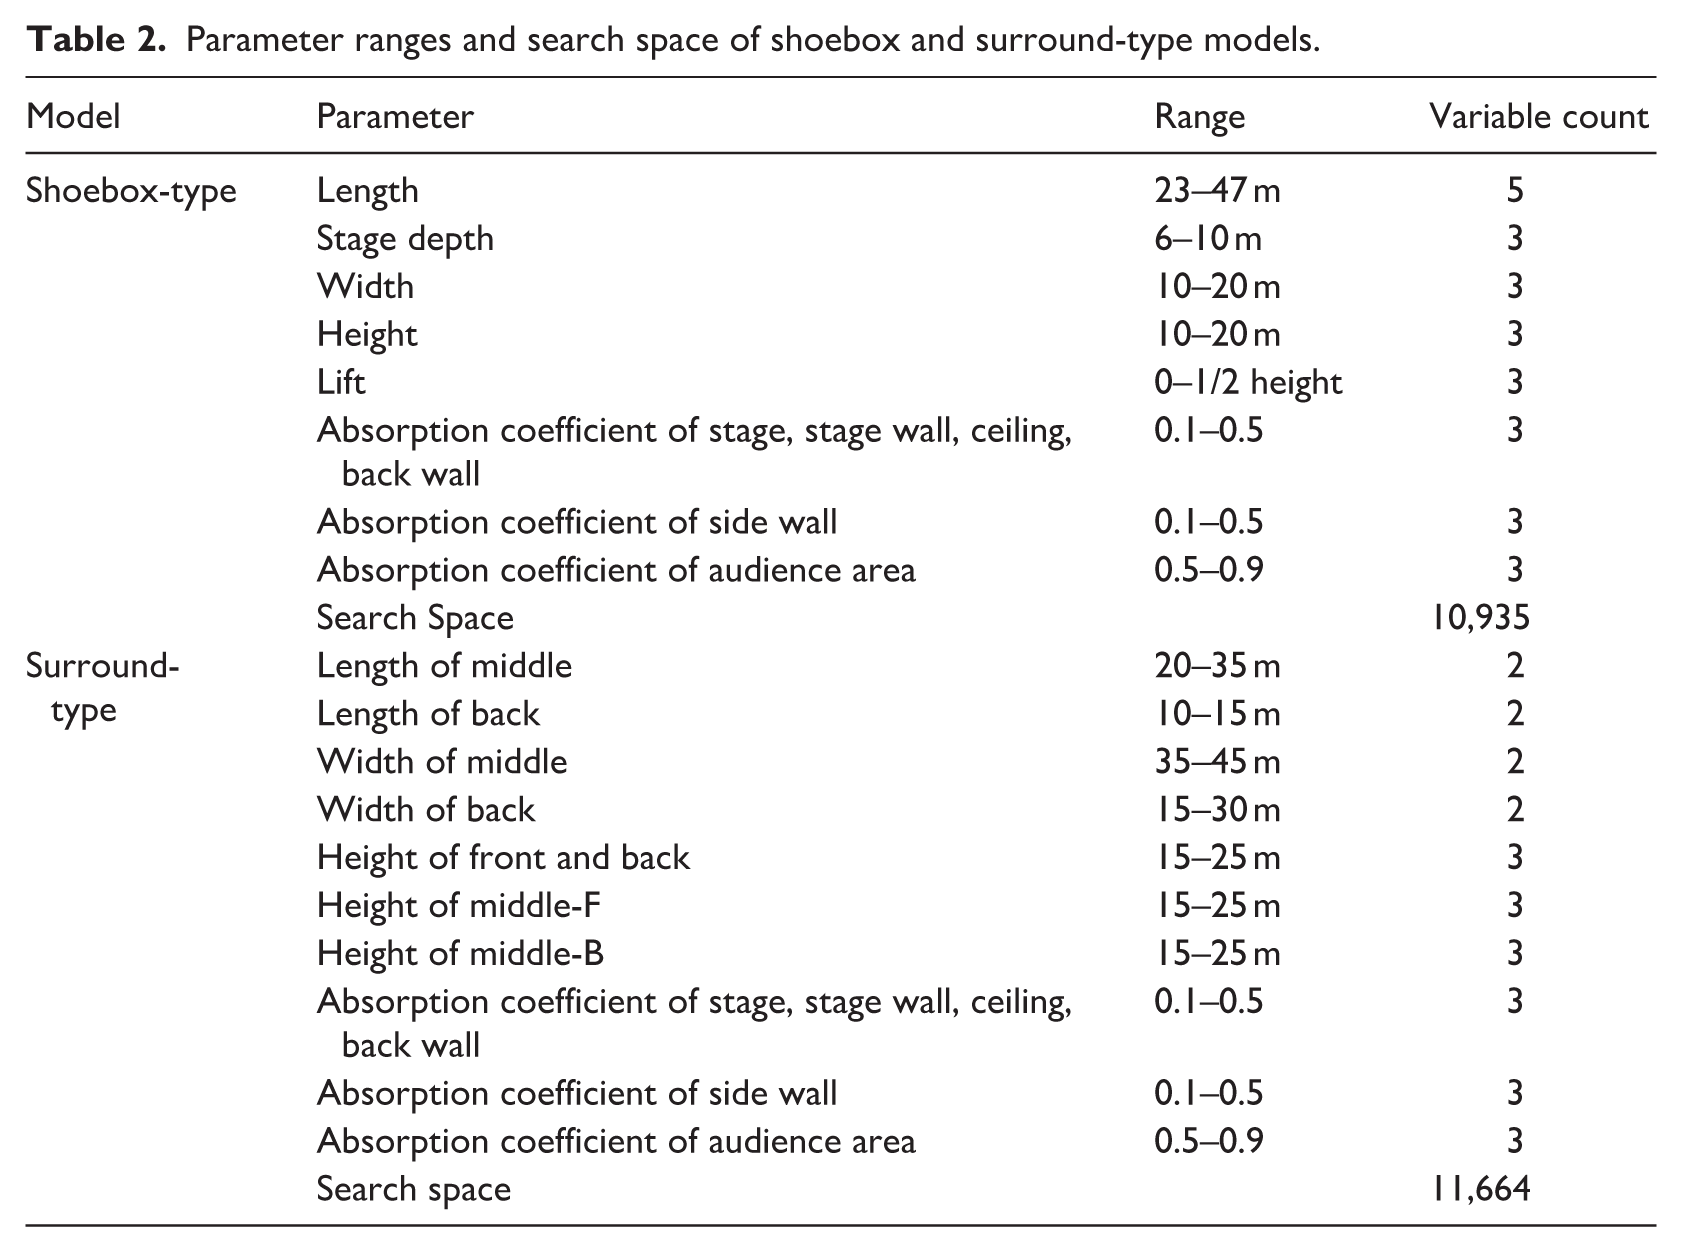
The absorption coefficients ranged from 0.1 to 0.5 for the walls and ceiling and from 0.5 to 0.9 for the audience. Additionally, the scattering coefficients were set to 0.1 for the walls and ceiling, and 0.7 for the audience, representing a typical case for concert halls. 38 The combinations of the two parametric models are summarized in Table 2.
Parameter ranges and search space of shoebox and surround-type models.
The acoustic simulation was operated using the Pachyderm plug-in for the Rhino-Grasshopper platform automatically. For both parametric models, one omni-directional sound source was placed at the center of the stage at a height of 1.5 m. In the shoebox-type, 9 receivers were evenly distributed, while in the surround-type, a total of 10 receivers were placed, with 1 in the center of each audience area. All receivers were set at a height of 1.5 m. The reflection order was set to three, meaning the calculation of specular reflections considered only the image-source method up to the third order, while the ray-tracing method continuously computed diffuse reflections of all orders. The cut-off time was set to 6000 ms, and the number of rays was set to the Minimum Convergence, where Pachyderm automatically adds rays through an iterative process and converges once the variance of the energy decay stabilizes.
The total search spaces of the two parametric models are 10,935 and 11,664. The simulations were performed separately, recording data on T30, C80, G, and geometry information, based on 1/1 Octave Bands from 63 to 8000 Hz.
Features analysis and rescaling
Architectural design is a phased decision-making process, with architects determining more details as the design is elaborated. Therefore, due to its minimal parameter requirements, Sabine’s equation is widely used to predict reverberation time during the early design stage with limited information as shown in equation (1), where T60 is the time (s) of sound energy decay 60 dB, V is the volume of the room (m3), S is the boundary surface area (m2), and

Although Sabine’s equation is applicable under specific conditions, it lacks the ability to describe the sound source position and the distribution of equivalent absorption areas. Consequently, completely different geometries can result in the same calculated reverberation times. To overcome this limitation, this study proposes a feature extraction method by splitting the model based on the sound source position, respecting the importance of early reflections. 39 In acoustic simulation, a point sound source is regarded as having spherical propagation. As shown in Figure 3, the use of the distributed equivalent absorption area allows for capturing the distribution of equivalent absorption areas and sound source positions, which Sabine’s equation ignores due to its uniform absorption assumption.
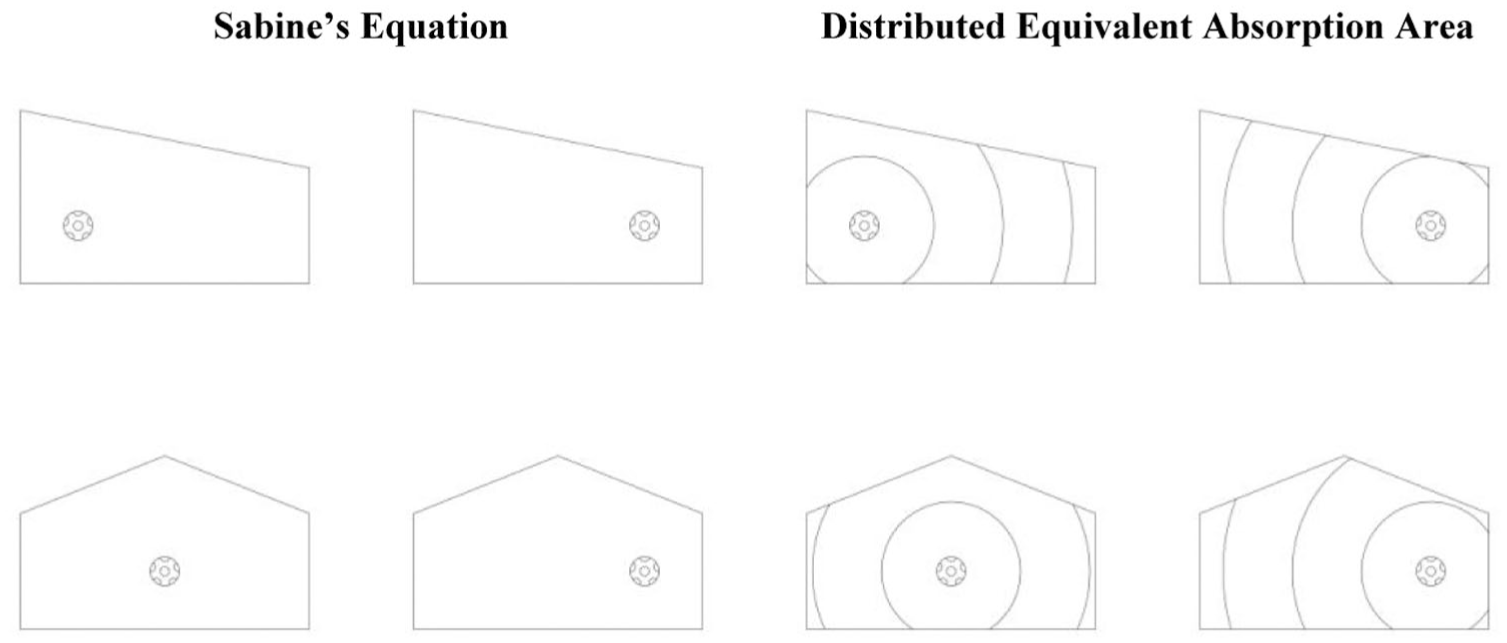
Comparison: Sabine’s equation versus distributed equivalent absorption area.
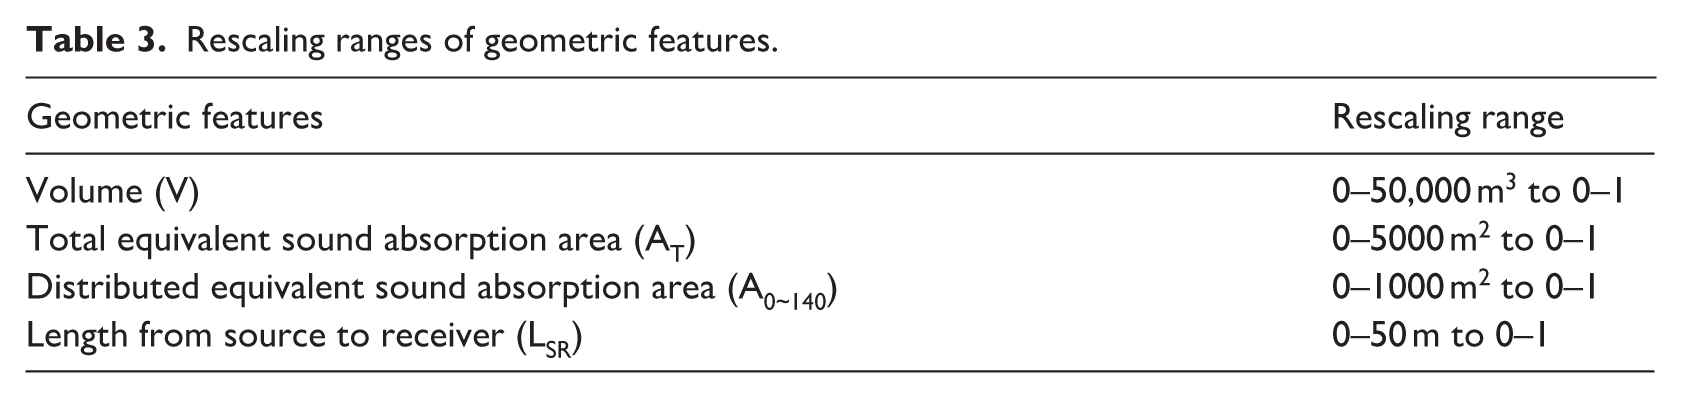
For this research, the interval for model splitting was set to 3.4 m, approximately equivalent to the distance sound travels in 10 ms. Theoretically, smaller intervals provide higher descriptive power for the model. Beranek 40 suggests that the maximum length of the audience area in a concert hall should be less than 40 m. Considering the depth of the stage, the maximum analysis length was determined to be 51 m, which is approximately equivalent to the distance sound travels in 150 ms. In addition to the distributed equivalent absorption areas, the volume V (m3) and total equivalent absorption area AT (m2) were also considered as geometric features. Furthermore, since C80 and G are strongly influenced by the distance from the sound source to the receiver (LSR), this distance was also included as a geometric feature. These geometric features were used for machine learning predictions. However, the differences in the ranges of each feature are significant. To accelerate the process and avoid local convergence, all features were rescaled based on their data domains, as shown in Table 3. Note that the distributed equivalent absorption area beyond 140 ms (A140~150) of sound propagation length can be inferred from the total equivalent absorption area.
Rescaling ranges of geometric features.
Machine learning framework
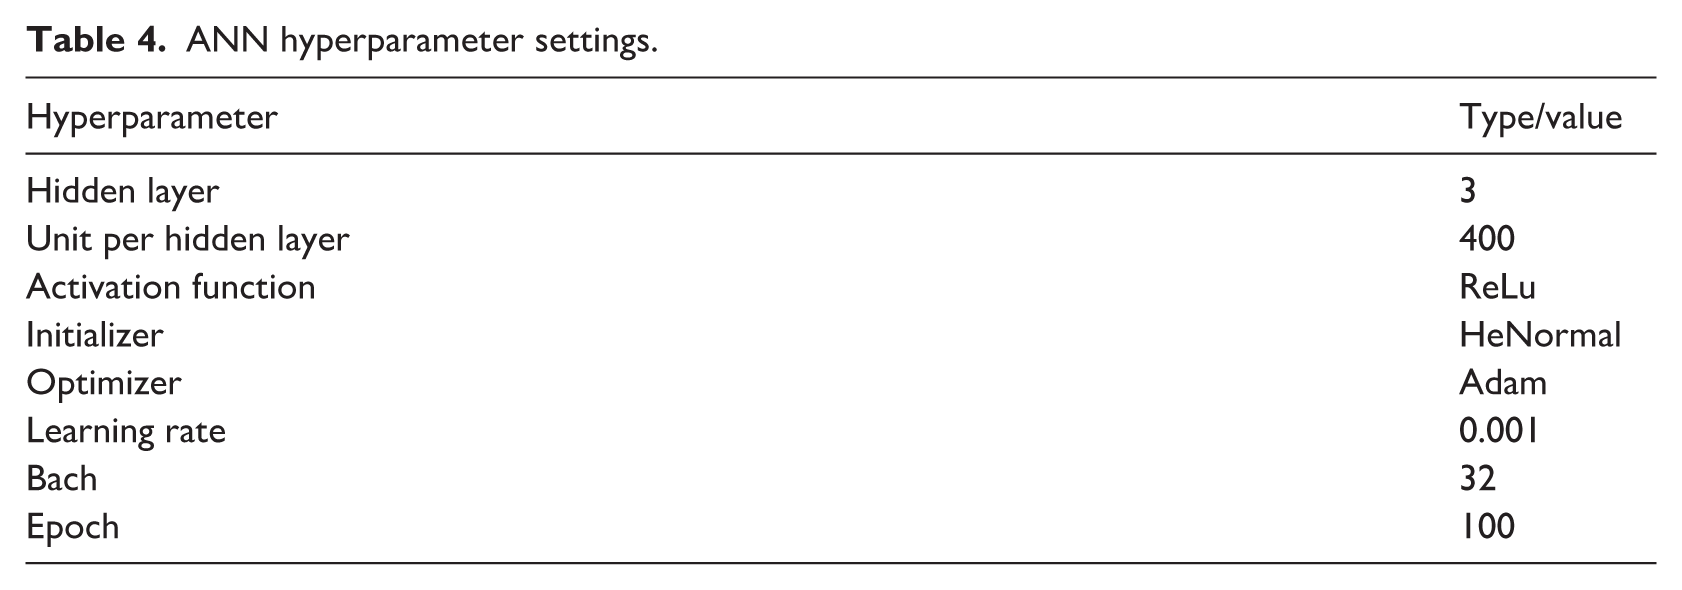
After generating data through the aforementioned methods, these datasets were utilized for machine learning. To better integrate with parametric design, the machine learning process was conducted using the Pug plug-in for Rhino-Grasshopper, which is built on Keras-TensorFlow. Considering the inherent variability in acoustic simulation results, Artificial Neural Network (ANN) were chosen for their capability to learn complex patterns from data and reduce the impact of simulation uncertainties. The hyperparameters settings, as shown in Table 4, are the result of adjustments and improvement in accuracy and convergence speed.
ANN hyperparameter settings.
Results and discussion
The range and relationship between each feature are highly related to the quality of machine learning, so it is necessary to analyze the distribution of features before applying them to machine learning. To ensure the dataset reflects realistic conditions for concert halls, only cases with a T30 ranging from 1.2 to 3.0 s were kept for the subsequent analysis. 37 Consequently, 38.6% of the shoebox-type and 29.1% of the surround-type results were excluded from the dataset. As shown in Figure 4, the surround-type hall contains a larger volume and leads to a higher total equivalent absorption area, further resulting in a higher distributed equivalent absorption area. The shoebox-type hall contains a wider range of LSR due to the longer maximum length of the audience area. For the simulation results, the shoebox-type shows a lower T30 and a higher C80. This result indicates that T30 is negatively correlated with C80, which agrees with previous studies. 41
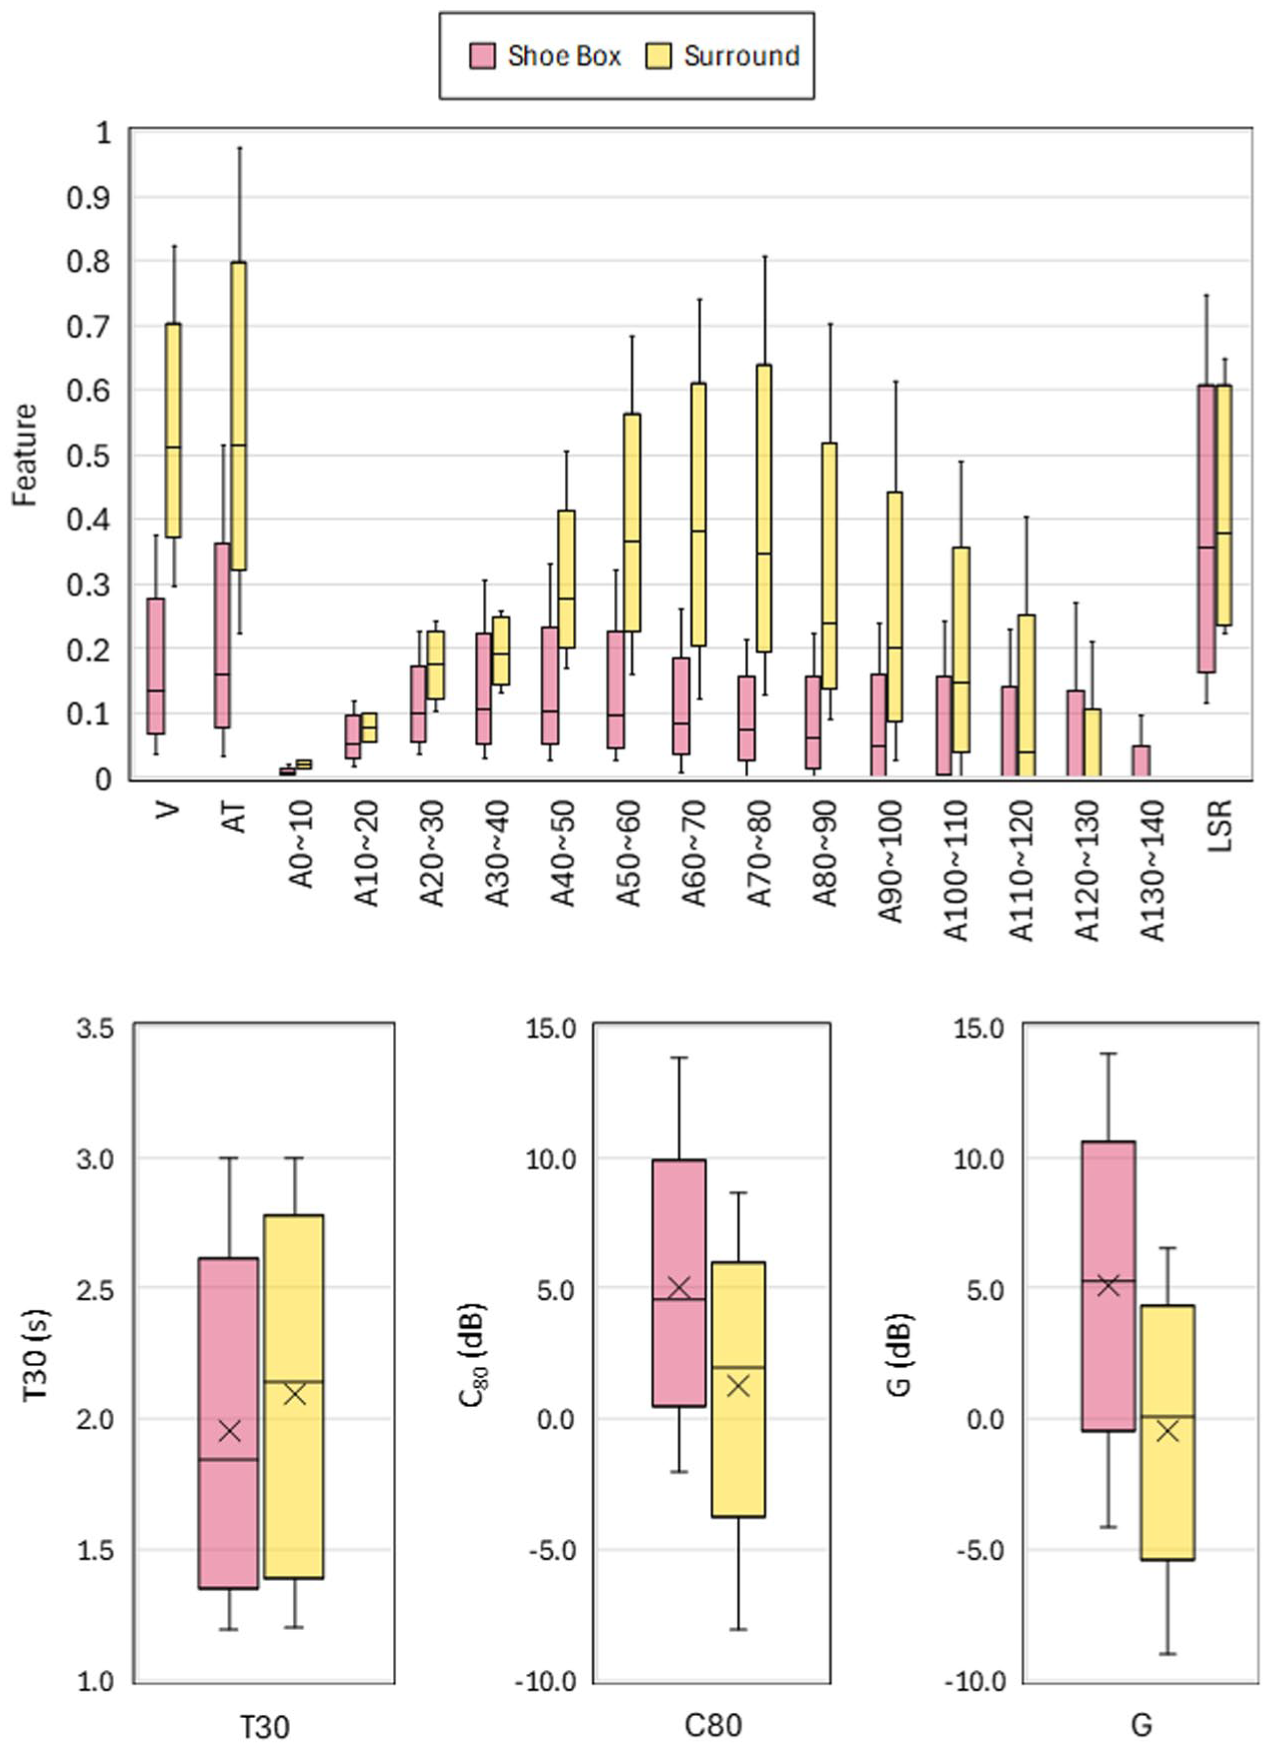
Distribution of features and acoustic indices from shoebox and surround-type models.
The correlation matrix provides another way to analyze the relationship between features: values close to +1 indicate a strong positive correlation, values close to −1 indicate a strong negative correlation, and values near 0 imply almost no correlation. As shown in Figure 5, the relationships between each acoustic index and the distributed equivalent absorption area show that the effect of absorption decays with distance, indicating the impact of early absorption, as well as early reflection. This supports the potential of using distributed equivalent absorption area as a feature to describe a model. In addition, LSR significantly affects G, which aligns with the general principle that sound energy decreases with distance. The significant effect from the distributed equivalent absorption area starting at A20~30 rather than A0~10 may be due to the design of the surround-type parametric model. Since the variable features focus on boundary elements such as side walls and ceilings, the equivalent absorption area near the sound source shows less variation.
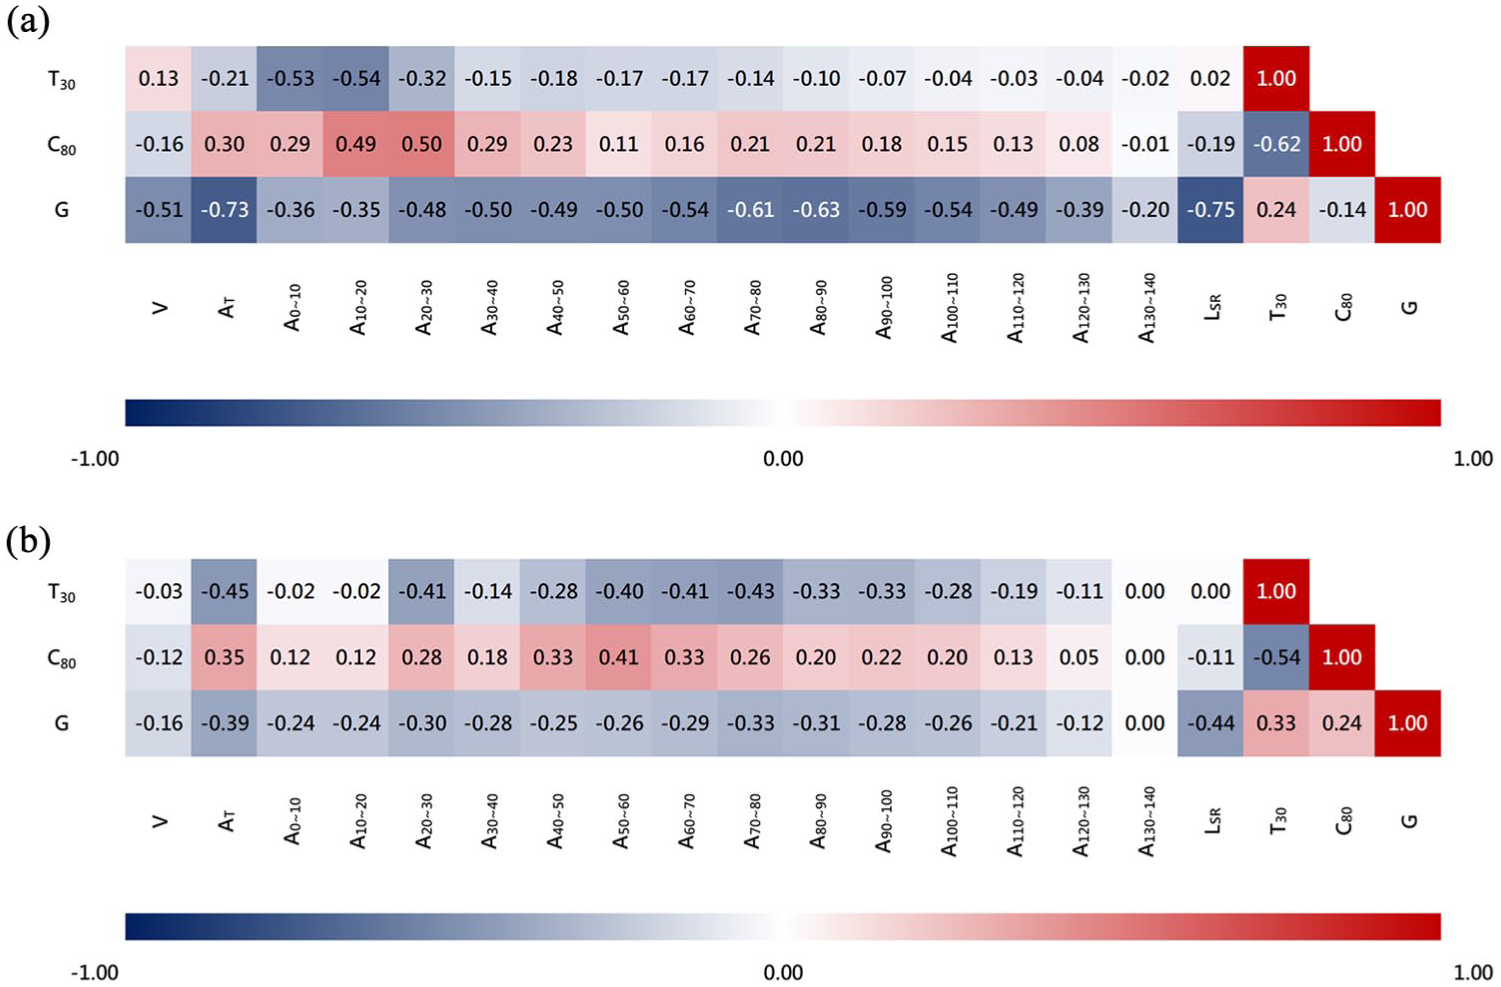
Correlation matrices of acoustic indices and features: (a) shoebox-type and (b) surround-type.
Predictive models evaluation
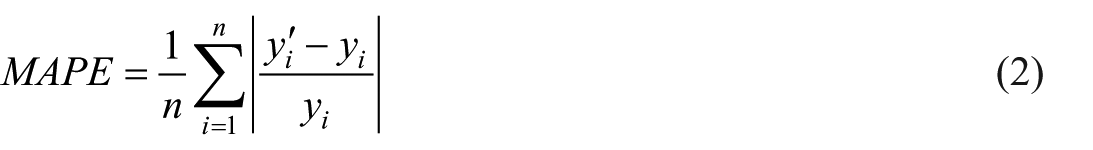
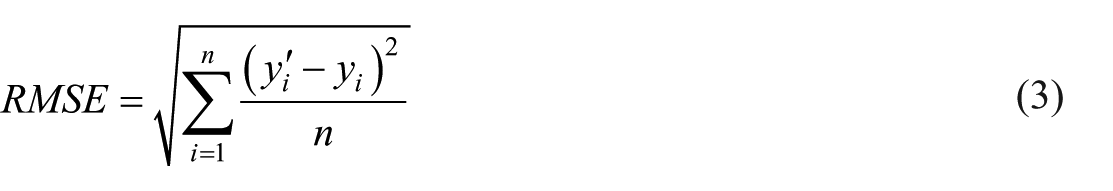
The evaluation was separated into three parts, using the datasets of shoebox and surround-type respectively for training and validation, as well as an intermixed dataset. To assess the difference between actual and predicted values, the Just Noticeable Difference (JND) was often used as a reference for evaluating accuracy. However, different acoustic indices are suited to different ways of expressing these differences. For example, RT is commonly expressed by percentage difference, while C80 is typically expressed by absolute difference. Therefore, the Mean Absolute Percentage Error (MAPE) and Root Mean Square Error (RMSE) were selected to assess the accuracy of predictions from the ANN models compared to the actual values obtained from Pachyderm simulations, as shown in equation (2) and equation (3), where
According to ISO 3382-1:2009, 35 the JND of RT is 5%, and for C80 and G are 1 dB. Other studies have reported that the JND of RT ranges from 6% to 39% under different conditions, 42 and for C80, it is approximately 1.6 ± 0.3 dB. 43 The predictive model accuracy was evaluated through fivefold cross-validation to avoid sample selection bias. The results from each fold were overlaid in the subsequent figures for discussion.
Prediction accuracy
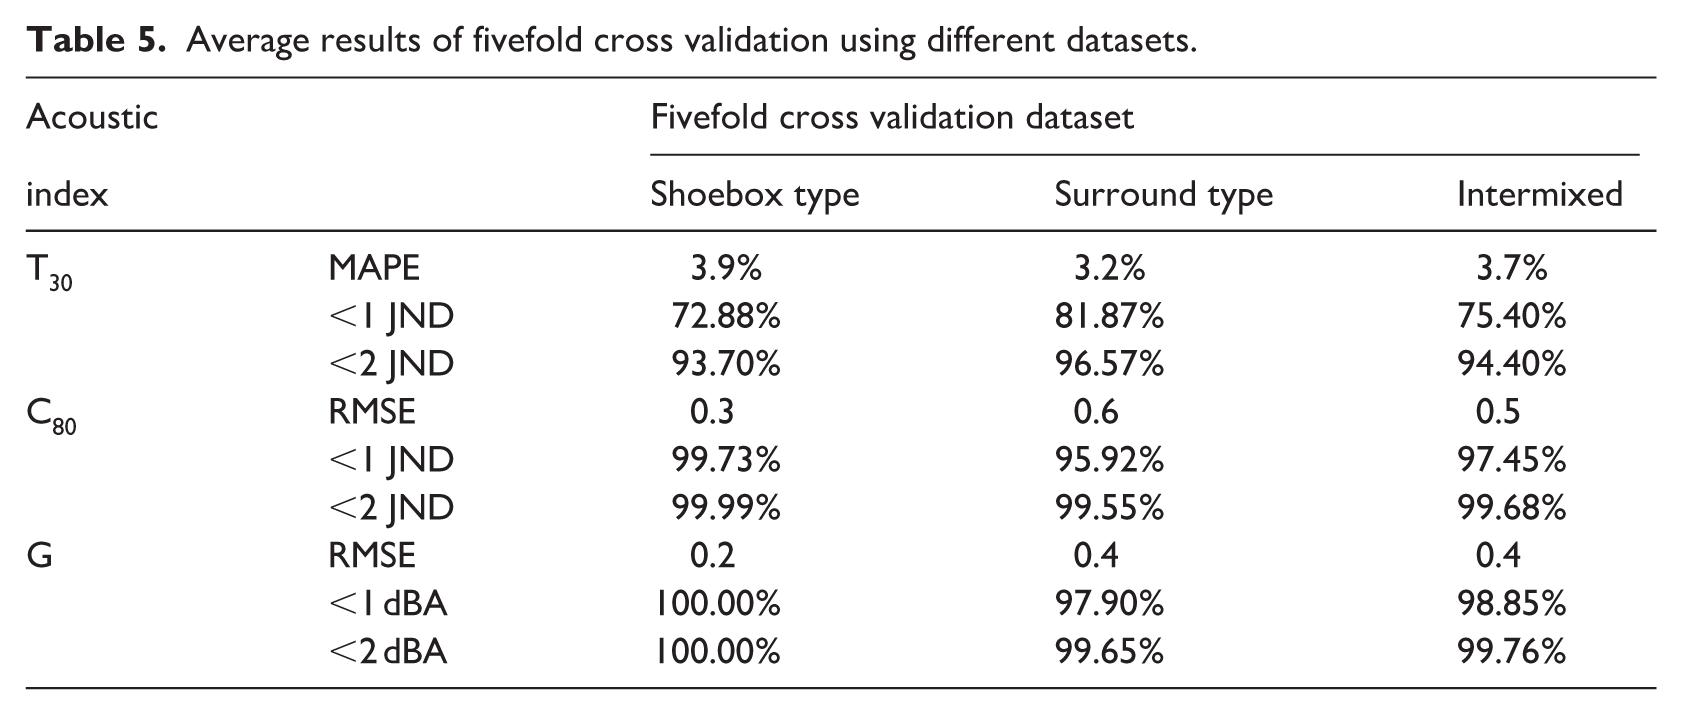
The average accuracy of each fold is shown in Table 5, and the overlaid scatter plots of predicted versus actual values for each fold are presented in Figure 6. The MAPE and RMSE for each index are all within 1 JND. To further evaluate prediction accuracy, the results are also presented as the percentage of predictions falling within JND intervals.
Average results of fivefold cross validation using different datasets.
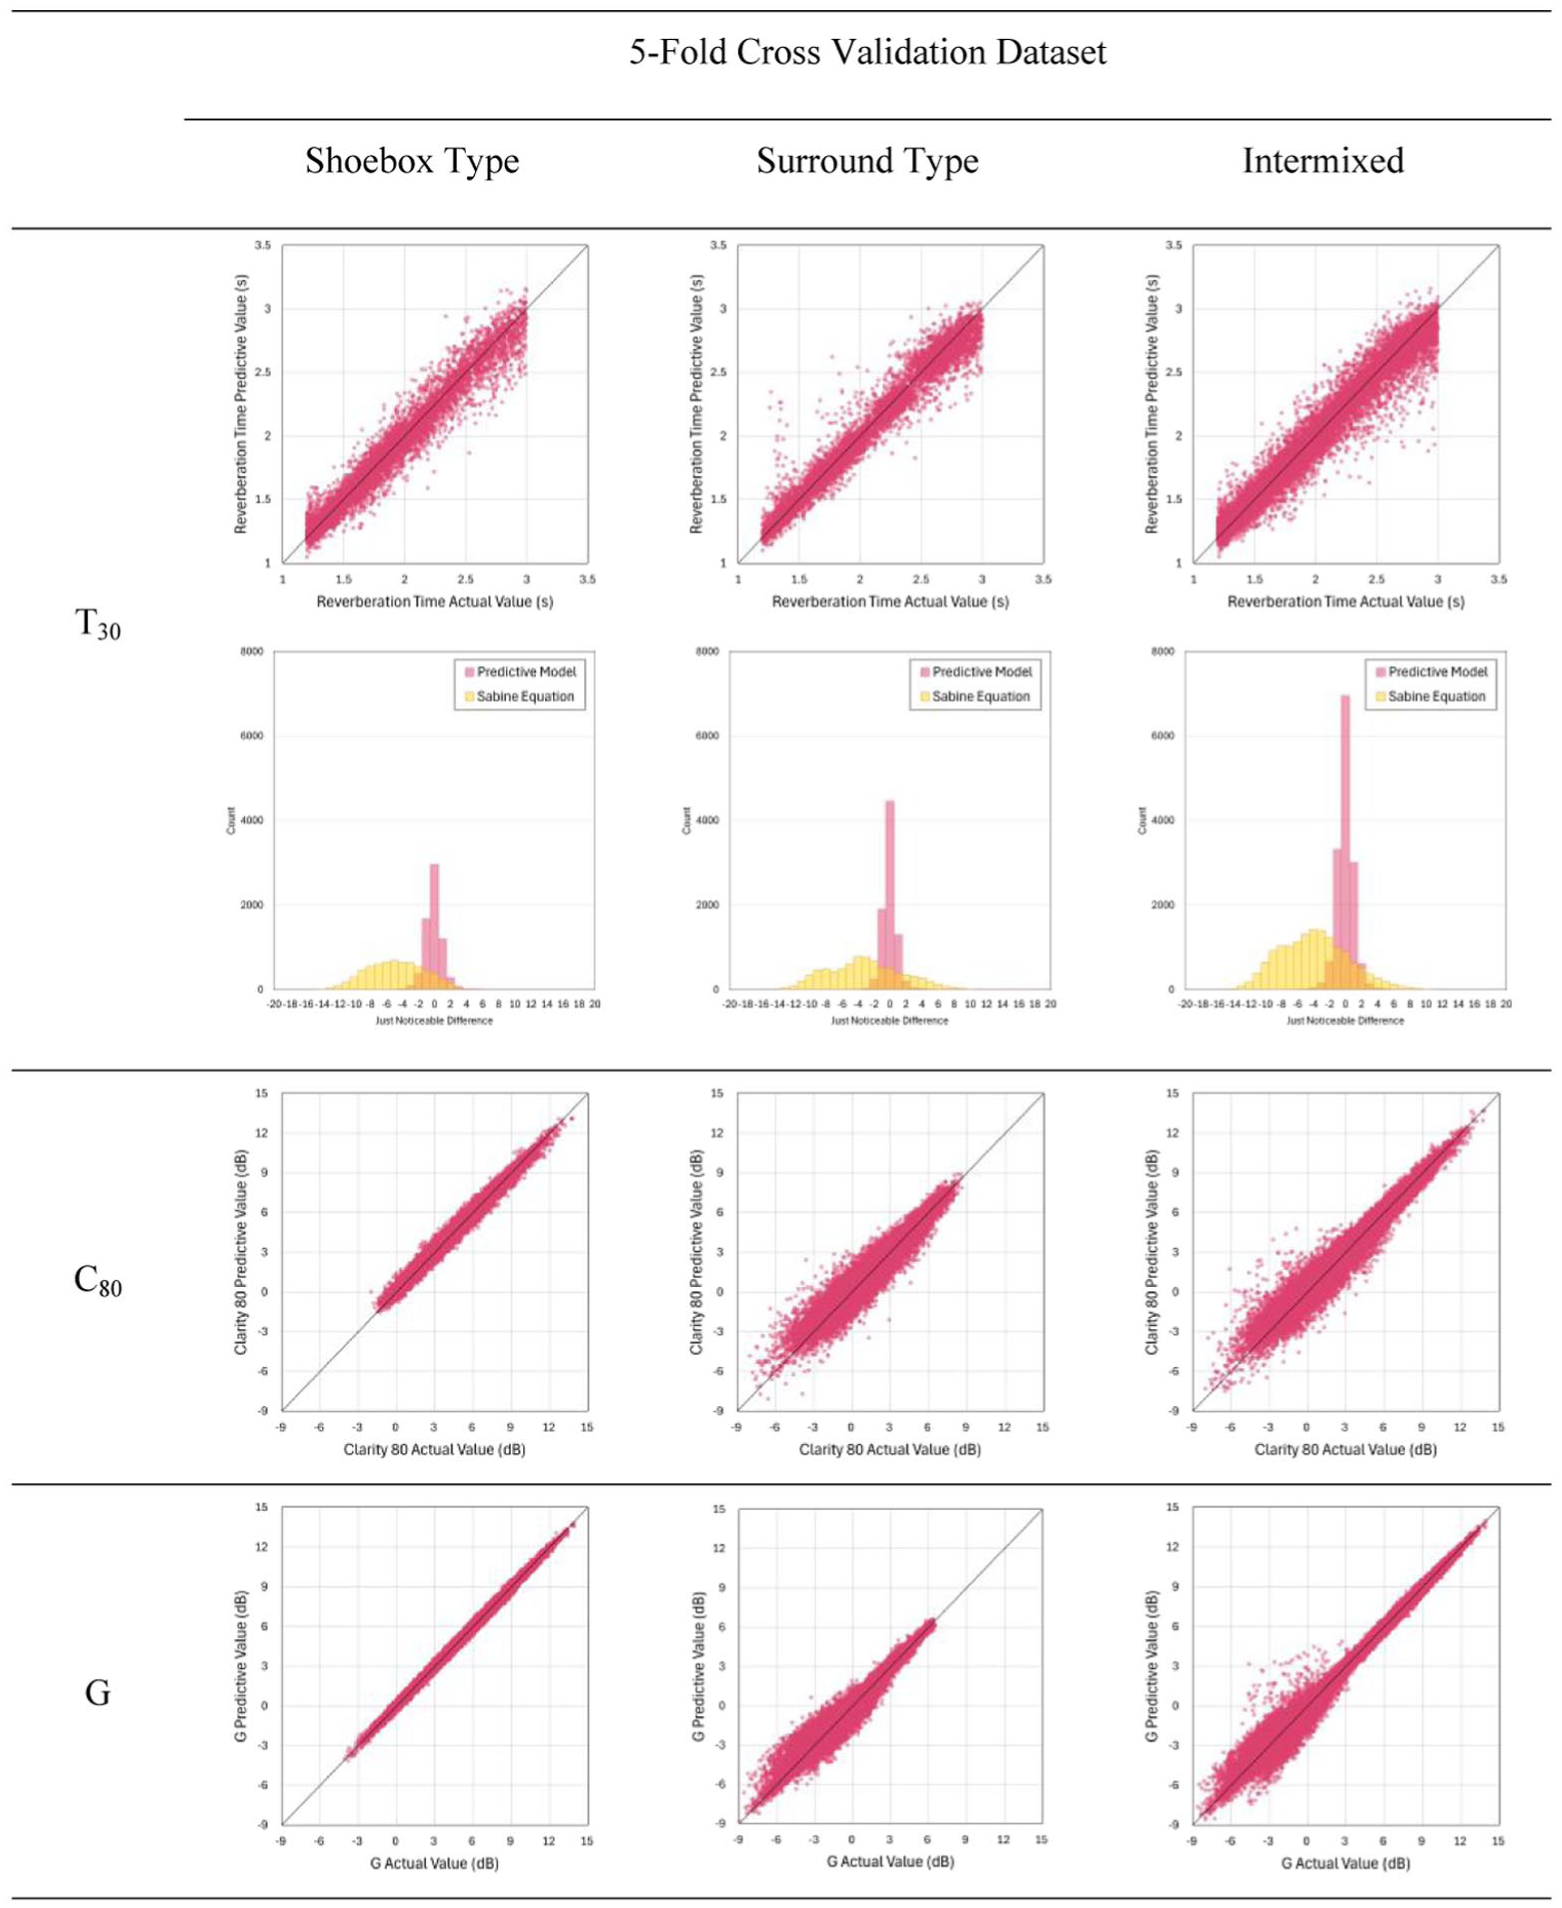
Prediction versus actual value scatter plots of fivefold cross validation.
For the T30 prediction, the validation using the surround-type dataset exhibits deviations at shorter reverberation times. This may be due to the dataset boundaries established after data filtering. However, the validation using the intermixed dataset maintains high accuracy, which indicates that the predictive model can identify the two types of halls through overlapping feature distributions within a single framework. Compared with Sabine’s equation, the predictive model shows lower errors relative to the Pachyderm simulation results, which are defined as the actual values in the validation datasets. Sabine’s equation often underestimates the reverberation time, which can be attributed to the assumption of a uniform sound field.
For the C80 and G predictions, the validation using the shoebox-type dataset shows high accuracy, with 100% and 99.73% of the prediction errors falling within 1 JND. This may be attributed to the simple variation in LSR and the strong relation between C80, G, and LSR. In contrast, the accuracy of the validation using the surround-type dataset is lower for both C80 and G. This may be caused by the numerous acoustic shadows created by the vertical surfaces in the surround-type audience areas. Without considering the solid angle and the acoustic shadowing effect, the spherical splitting method might lead to overestimating the effective absorption area. Furthermore, the scatter plot of the intermixed dataset demonstrates an overlaid distribution combining shoebox and surround-types. Compared to individual datasets, the intermixed dataset shows several interference deviations. However, most of the overlapping predictions still fall within 1 JND. This indicates that despite the interference, the model can evaluate both hall types.
Conclusion
In this study, a new method for describing acoustic simulation models has been developed. Distributed equivalent absorption areas relative to the sound source were introduced as features for the ANNs model, replacing the commonly used geometric or material parameters in previous studies. This approach integrates the geometric features of shoebox and surround-type concert halls into a single machine learning framework.
In the early design stage, information about the hall is very limited while design proposals change quickly. Most existing methods require detailed data that is not yet available at this stage. However, architects need to approximately evaluate and rapidly eliminate impractical proposals. Although detailed and professional acoustic consultation remains necessary, this study provides a complementary tool for the exploration of architectural design.
By using distributed equivalent absorption areas, geometric features of different hall types could be captured in the same way. As shown in Figure 7, the predicted MAPE and RMSE of the three indices in this study are all under 1 JND for each dataset. Though this accuracy is based on the simulation results of Pachyderm, as an acoustic simulation engine, Pachyderm is replaceable in this framework. Theoretically, the machine learning framework should be adaptable to more advanced simulation or realistic measurement datasets in the future.
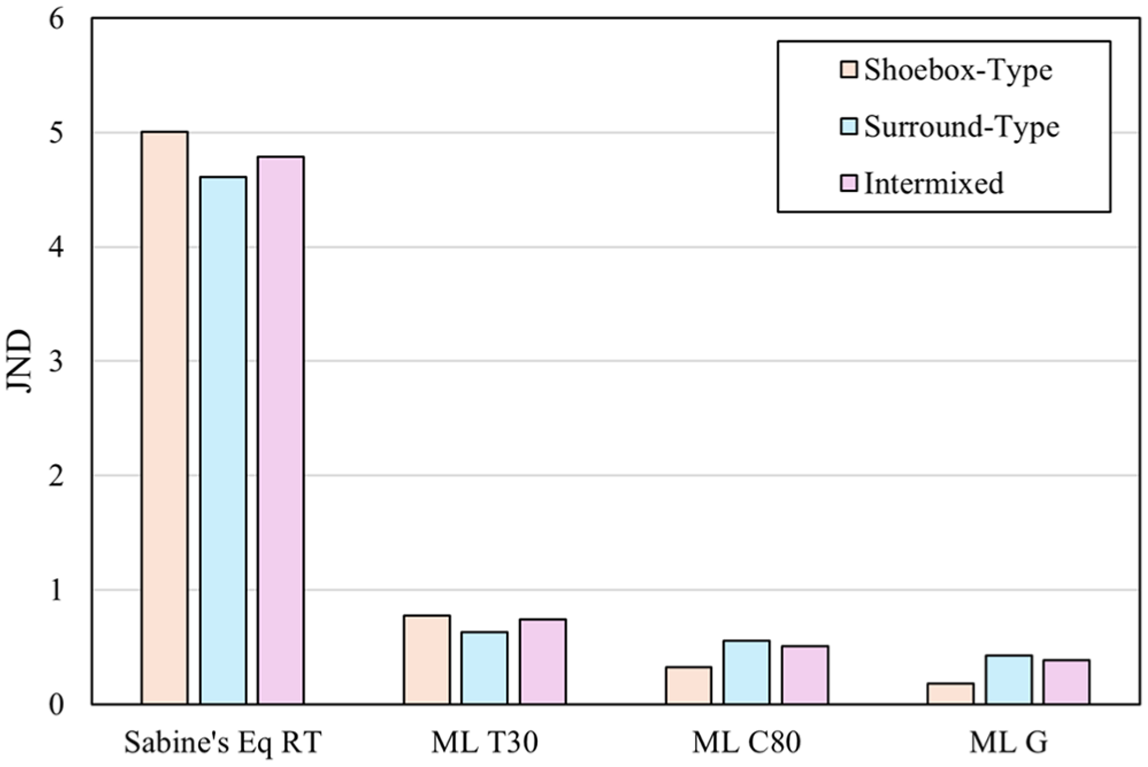
Overall prediction accuracy by JND for Sabine’s equation and ANNs model.
Limitation and future work
In this study, the concert hall geometries were simplified to reflect the exploratory stage of architectural design. However, features such as balconies and reflectors also play crucial roles in real-world conditions. To provide more realistic simulations, integrating these complex geometric elements and sound source configurations, such as a full symphony orchestra, remains a priority for future work.
Furthermore, while the acoustic performance of concert halls was evaluated using three indices: T30, C80, and G, other indices, such as Inter-Aural Cross-Correlation (IACC) and Lateral Energy Fraction (LF), are equally critical for comprehensive auditorium experiences. As these indices are highly sensitive to reflection angles, introducing solid angle parameters from the sound source is a necessary step in future.
Footnotes
Author contributions
Y.C. Yu and Y.S. Tsay conceived of the presented idea. Y.C. Yu developed the theory and performed the computations. Y.S. Tsay received and supervised the findings of this work. All authors discussed the results and contributed to the final manuscript.
Funding
The authors disclosed receipt of the following financial support for the research, authorship, and/or publication of this article: This project has received funding from the National Science and Technology Council of Taiwan (NSTC 113-2221-E-006-071-).
Declaration of conflicting interests
The authors declared no potential conflicts of interest with respect to the research, authorship, and/or publication of this article.