
Abstract
Acoustic designers must consider many factors when configuring music classrooms. Designing room acoustics to complement the specific properties of different musical instruments yields more successful acoustic arrangements. To design a piano-specific music classroom, this study compares three different panel layouts with the resonance frequencies of a piano to examine room acoustic parameters and demonstrate compatibility. Twenty-five piano players completed surveys before and after the installation of three distinct panel layouts. The subsequent analysis compared these statistical results with objective acoustic parameters. The evaluation assessed clarity, reverberation, warmth, diffusion, loudness, background noise, and echo against objective targets. Participants preferred designs offering greater bass audibility. Musicians perceive frequencies that are compatible with the room and piano resonance frequencies.
Introduction
Early studies of music rehearsal rooms utilized objective assessments, such as measurable acoustic parameters, optimum volume, and space determinations, as well as subjective methods, such as audience surveys.1–4 Research covers many aspects of rehearsal room design. 5 Prior work notes that the acoustical configuration of rehearsal rooms differs from concert halls, making acoustic deficiencies difficult to identify. 6 Limiting room dimensions controls lateral reflections that affect timbre, requiring the identification of musicians’ needs within the perceived frequency spectrum. 7 Owing to the variability in room size, instrument types, and musical styles, determining the standard acoustic conditions of a rehearsal room is a challenging process.8,9 One of the important issues in the design of rehearsal rooms is the ability of musicians to hear each other and reduce the volume without changing the timbre. 10 The most frequently used parameter in the acoustic evaluation of music practice environments is the reverberation time (RT).11–13 Optimum reverberation time values are a desired outcome. 14
The impact of room acoustics on musicians has been studied in numerous studies. The relationships between room acoustic parameters and musicians’ preferences in their working environments have been investigated.12,15–18 Studies on opera singers have identified strong correlations between T30 and C80 values and the artists’ appreciation of room acoustics. 19 It has been observed that room acoustics have a greater impact on speech recording than microphones. 20 The extent to which musicians are affected by sound level varies depending on the musical instrument. 21 Studies investigating the effects of specific room acoustic conditions on variables such as tempo, loudness, dynamic bandwidth, or timbre of musical performances have found that parameters such as power (G) and clarity can alter musicians’ tempo and dynamic range. 22 When the room’s acoustic response works well with the instrument, good rehearsal conditions are achieved for the musician.
Low-frequency room modes can act as filters, causing the sound characteristics of the music source to be perceived differently. 23 Room resonances exert their influence when sound occurs in frequency regions within the room’s mode frequency and bandwidth, creating standing waves. 24 In small rooms, the wide range of modal frequencies in the lower frequency ranges audible to the human ear can color the sound in noticeable and often undesirable ways. 25 This coloration can create significant acoustical problems in listening rooms, recording rooms and music practice classrooms. Considerable effort has been devoted to developing design guidelines and approaches to mitigate these effects.26–29 Small rooms that exhibit strong modal behavior do not have a diffuse sound field. In rooms with volumes between 30 and 200 m3, the lack of a diffuse sound field results in an irregular distribution of sound energy in space and time. 30 The decay curves of sound energy also vary in the lower frequency regions, where room modes occur widely. 31 This creates difficulties in determining the room acoustic parameters. When determining the acoustic properties of rooms, equations and approaches have been developed based on the assumption that the sound within the room creates a diffuse sound field. 32 In small spaces where a diffuse sound field is not present, the room response curve can be useful for identifying the existing modes.33,34 The modal decay times of these modes can be calculated using the quality factor and mode frequency data. 24 The room response curve represents the sequence of sound signals emitted from an impulse sound source and received at a point in the sound field. In room response measurements, the emitted signal is typically a sine sweep or MLS signal generated by the source.35,36
This study investigated the extent to which the acoustic properties of music practice rooms can be harmonized with those of pianos. Surveys were conducted with 25 piano players using Helmholtz resonator panels with interchangeable perforated front panels in three different panel layouts, and the results were compared with the acoustic parametric values obtained from field measurements.
This study advances beyond general acoustic treatment strategies by proposing a systematic, frequency-synchronized design methodology that treats the room as a physical extension of the instrument’s soundboard. While prior literature has explored broad objective–subjective correlations, this work establishes a structured workflow that explicitly links the discrete modal peaks of a small space with the high-energy resonance frequencies of a specific instrument—in this case, the piano. Methodologically, the novelty lies in the “tuning” of room responses through interchangeable Helmholtz resonator face-plates, allowing for a dynamic transition between acoustic environments (e.g. from “warm” to “clear”) without structural modification. Furthermore, by utilizing a frequency-signaling validation technique, this research provides a validated application strategy for synchronizing room modes with instrument-specific outputs. This approach moves the field toward a more granular, instrument-dependent design framework that ensures the architectural environment supports, rather than masks, the natural timbre of the performer’s instrument.
While existing literature extensively covers low-frequency modal control and general objective-subjective correlations in music rooms, a significant gap remains in the absence of a systematic framework that synchronizes the discrete modal architecture of small spaces with the specific harmonic resonance fingerprint of a particular instrument. Previous studies typically evaluate acoustic “quality” through averaged parameters (such as T30 or C80) that often overlook the destructive masking effects that occur when room “dips” align with an instrument’s primary soundboard resonances. This study addresses that limitation by moving beyond incremental application toward a frequency-matching methodology. It explicitly positions the room as an extension of the instrument’s soundboard, demonstrating how targeted modal adjustments calibrated specifically to the piano’s 70, 138, and 196 Hz resonance peaks can fundamentally alter musician perception. By shifting the focus from general acoustic treatment to instrument-specific modal synchronization, this work provides a new design logic for small-scale practice environments that is currently absent from the broader literature.
Experimental method
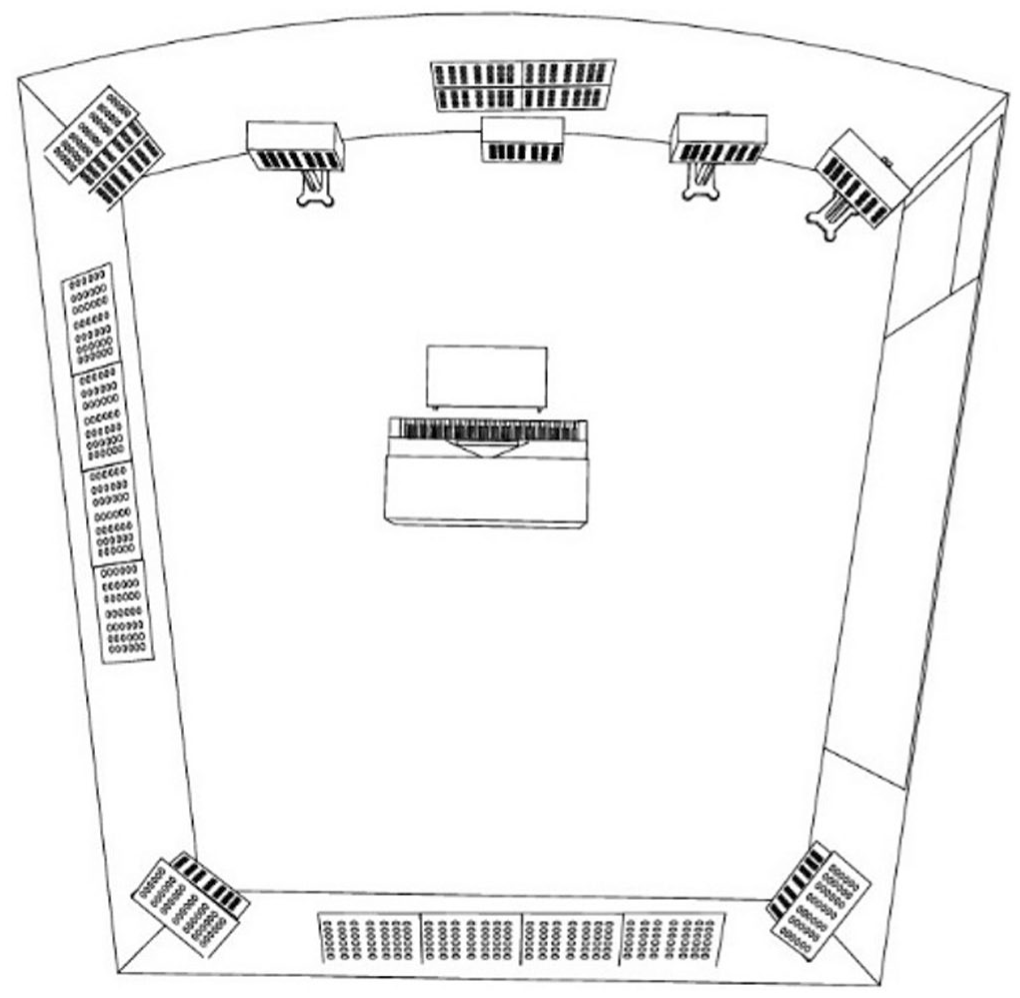
The study, conducted in a fan-shaped room with an area of 30.78 m2 and volume of 86.8 m3 (Figure 1), utilized field measurements, modal simulation data, acoustic material design and calculation, and data from a musician survey. The study was conducted in a music classroom at ITU MIAM. Twenty-eight Helmholtz resonator panels with interchangeable front faces were used in three different room-acoustic designs. Thirteen of these panels were interchangeable, and 15 were fixed. Field measurements yielded T30, EDT, C80, and room-response data. In this room, which was used as a musical instrument study classroom, the data were evaluated comparatively using measurements taken from the position of the piano player in accordance with the position of the piano. A review of existing piano modal analyses provided upright piano mode frequencies to compare against the room’s mode frequencies. This identification process highlighted the piano modes occurring in the first three octave frequency bands, which room modes amplified.
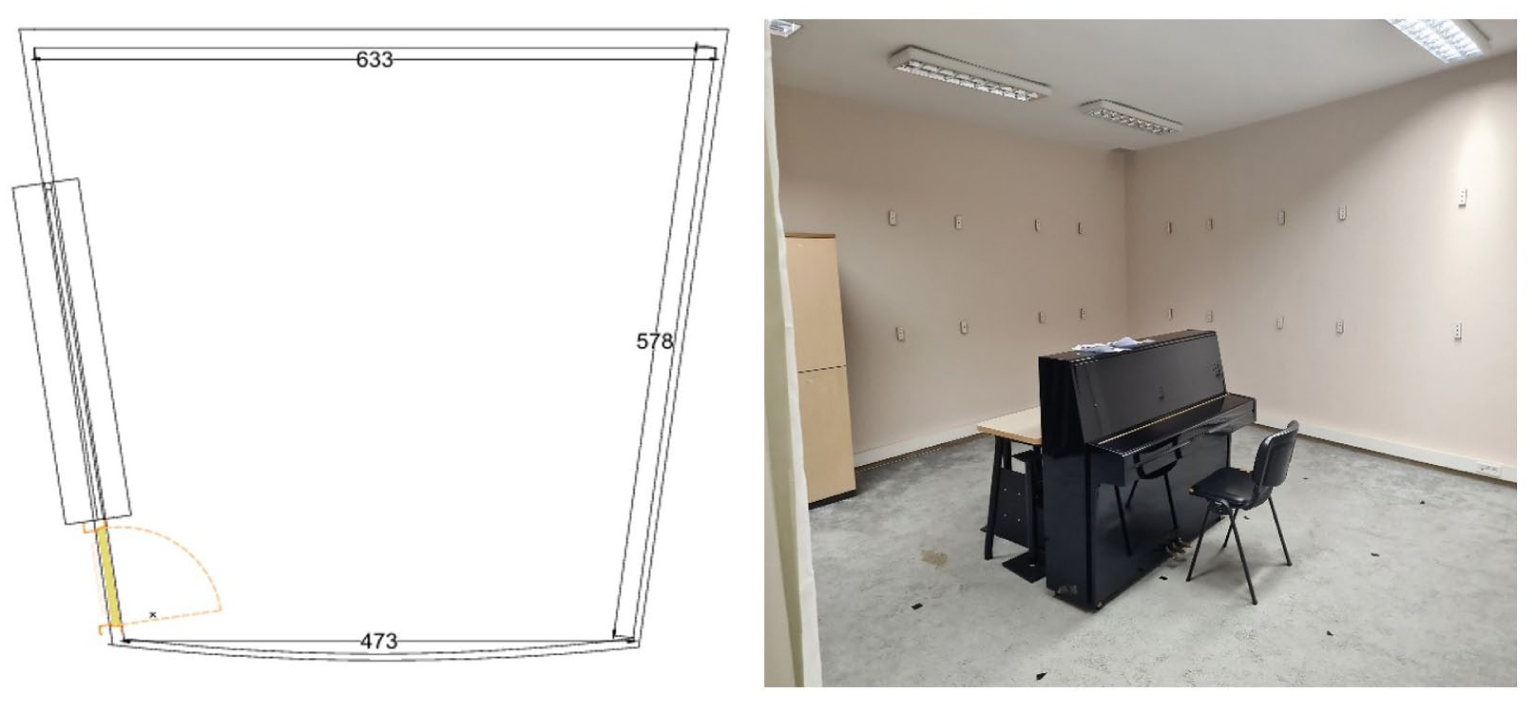
Piano practice room plan.
Separate surveys were conducted with 25 piano musicians, selected as the experimental group, for three different designs before and after the modification. In the post-modification surveys, the first design was evaluated. Subsequently, the magnetic front covers were modified, and the same surveys were administered to Designs 2 and 3.
The objectively determined parametric values were compared with the subjective assessments obtained from the surveys. The survey results for the four different situations were compared to assess whether significant changes occurred. The research method is illustrated in Figure 2.
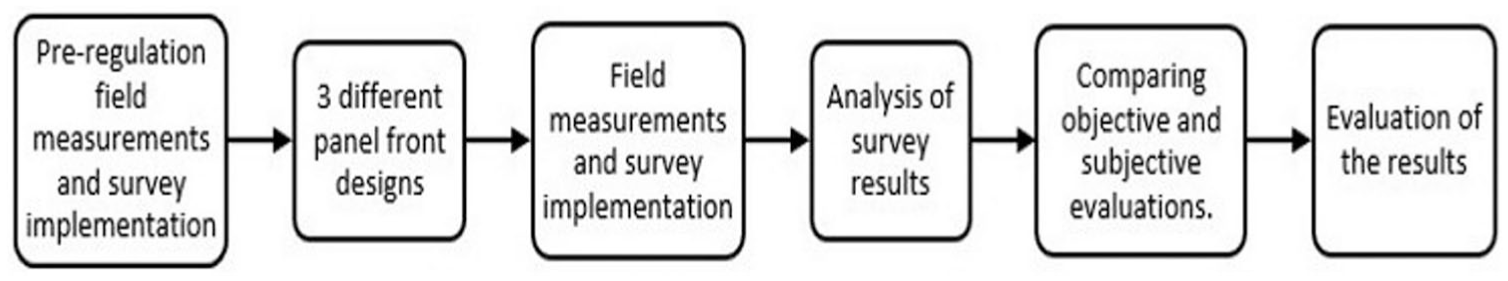
Research method.
As a result of the study consisting of the pre-arrangement measurements and survey applications, the design, manufacturing, and installation of acoustic materials, the acquisition of ANSYS simulation data, the post-arrangement field measurements and survey applications, and the analysis of these data using the SPSS 29 program to determine the design criteria, the necessary knowledge base for the acoustic design of music study classes according to the instrument characteristics was attempted to be created.
Objective measurements
In this study, measurements were taken from a single listener’s point of view. Since the degree to which a pianist is affected by room acoustics is being investigated, the changes in the response curve at the pianist’s position are the focus of the research. No significant change in reverberation time was observed among the three different designs using Helmholtz resonator panels. However, notable changes were seen in the response curve. The impact of these changes on musicians was investigated by comparing survey and response curve data.
Measurements were carried out in accordance with the ISO 3382-2 (TS EN ISO 3382-2, 2008) standard to determine the existing acoustic conditions of the instrument classroom. One source and piano-playing point were selected as the receiver, with the source positioned 150 cm above the floor and the receiver points 120 cm above the floor. Bruel&Kjaer 12-sided loudspeaker, Behringer ECM 8000 measurement microphone, microphone tripod, Arta software, and microphone calibrator were used. Room response measurements were made in accordance with the ISO 3382-1 acoustic parameters T30, EDT, and C80, and TS EN ISO 18233-SS (TSE EN ISO 18233, 2010). A sweep signal was used for the room response measurements. The sweep signal provides more accurate room response measurements.30,35 T30 data was used in reverberation time measurements. T30 data was preferred because S/N ratios above 45 dB were obtained in the octave band frequency bands during the measurements.
Subjective evaluations
This study utilized surveys conducted in real-world conditions. Surveys were conducted with 25 piano players in a piano practice classroom at ITU MIAM before the acoustic redesign. After the fabrication and installation of the acoustical redesign were completed, the same musicians were surveyed. Post-redesign surveys were repeated for three different designs, created by replacing the removable front acoustic panels. After the survey for the first design, the front panels were replaced, and the same survey was conducted for the second design. The front panels were then replaced, and the surveys were repeated for the third design iteration. The post-redesign surveys lasted approximately 1 h for each subject. After being admitted to the room, the subject was asked to rehearse the room alone at the piano-playing point for 10 min to experience the room. The survey questions were then entered into the room and the survey questions were asked. The same procedure was followed for all three designs. The questions were categorized into three groups: acoustic condition assessment questions, selection of high- and low-pitched sounds from piano sheet music, and overall impression. The first two groups of questions were analyzed quantitatively, and the third group, which comprised the overall evaluation, was analyzed qualitatively.
Because this study was based on evaluating a customized acoustic design for a piano instrument, room resonance perceptions were determined by asking about high notes. The perception of notes coinciding with the lowest points in the room was also investigated. The evaluation targeted whether the room enhanced the resonances of the piano soundboard. The survey was completed without changing the piano, its position, or the instruments used in the study, minimizing variations.
IBM SPSS 29 was used to analyze the survey data. A non-parametric analysis was conducted to determine whether the three different designs produced a significant difference compared to the pre-modification situation. The Mann–Whitney U test was used to assess significance. Cases where the P significance was set at p < 0.05.
Modal simulation and panel layout
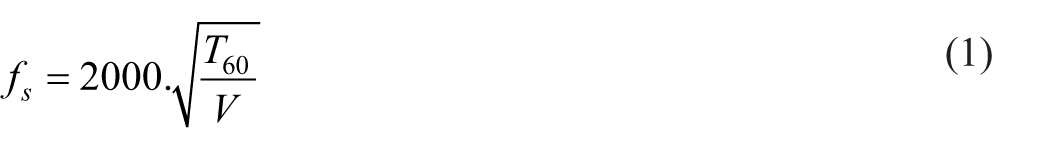
The critical frequency value at which room modes cease to be a problem is called the Schröder frequency. 37 The Schröder frequency separates the mode region from the mid-frequency region in room analysis.38,39 It is calculated using the reverberation time and volume variables as seen in equation (1). The Schröder frequency of the room before arrangement was calculated as 157.7 Hz.
The walls where the room modes occurred were identified, and resonator panels were placed on the surfaces where the pressure points of these modes were maximum. The panel locations were determined using ANSYS Modal. An Acoustic program was used to observe the room mode shapes. Figures 3 and 4 illustrate the effect of room modes on the panel placement. It was determined that room modes create maximum pressure points in corners and wall-ceiling junctions, and that the combined pressures of axial, tangential, and oblique modes are concentrated in the corners.
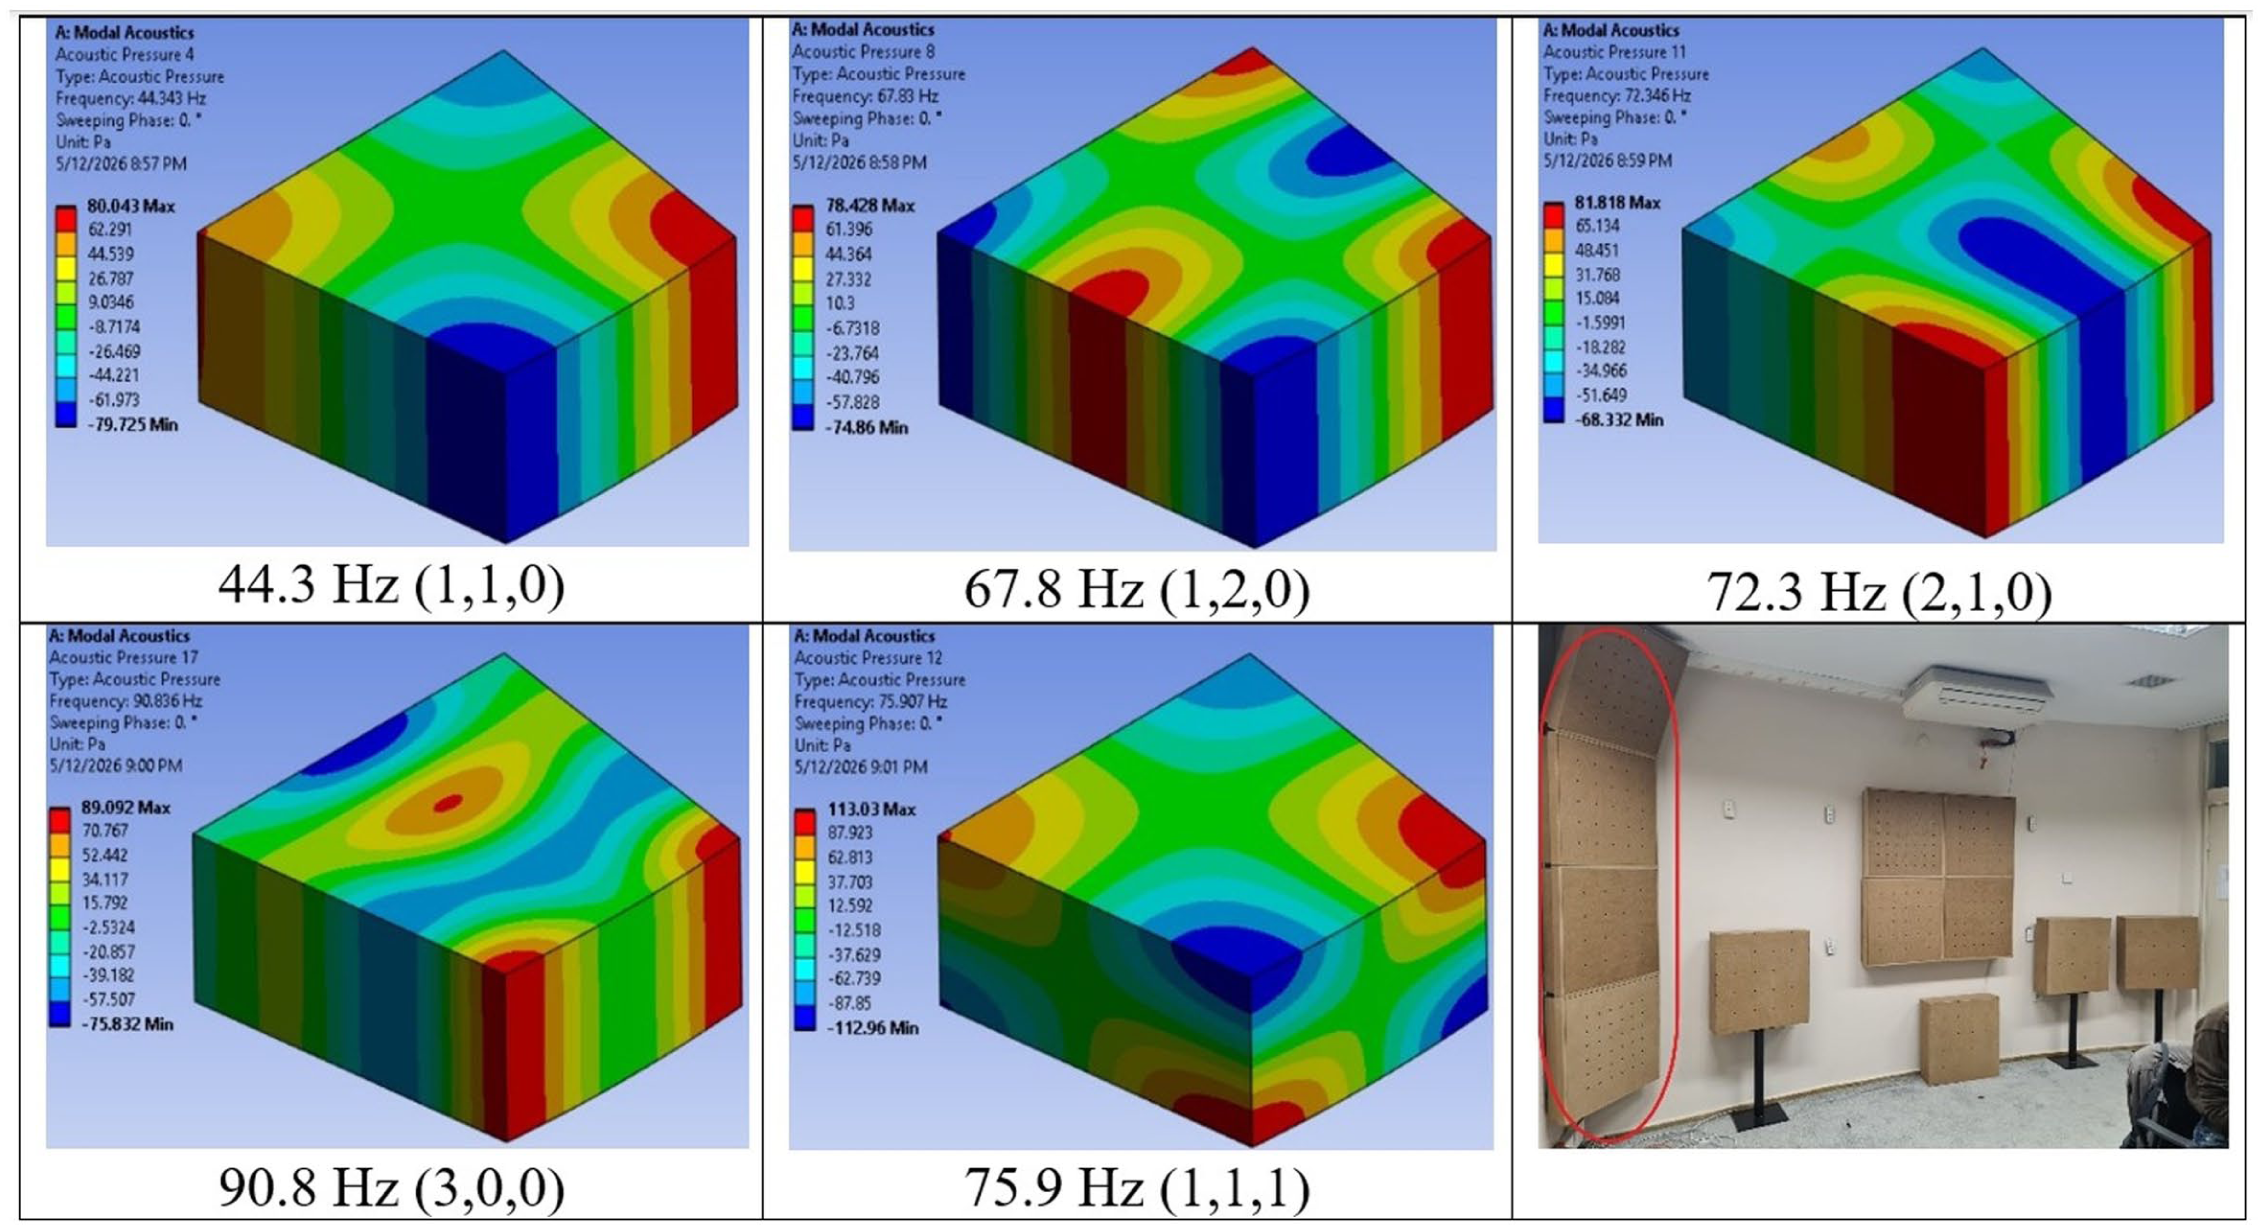
Modal simulation results front wall.
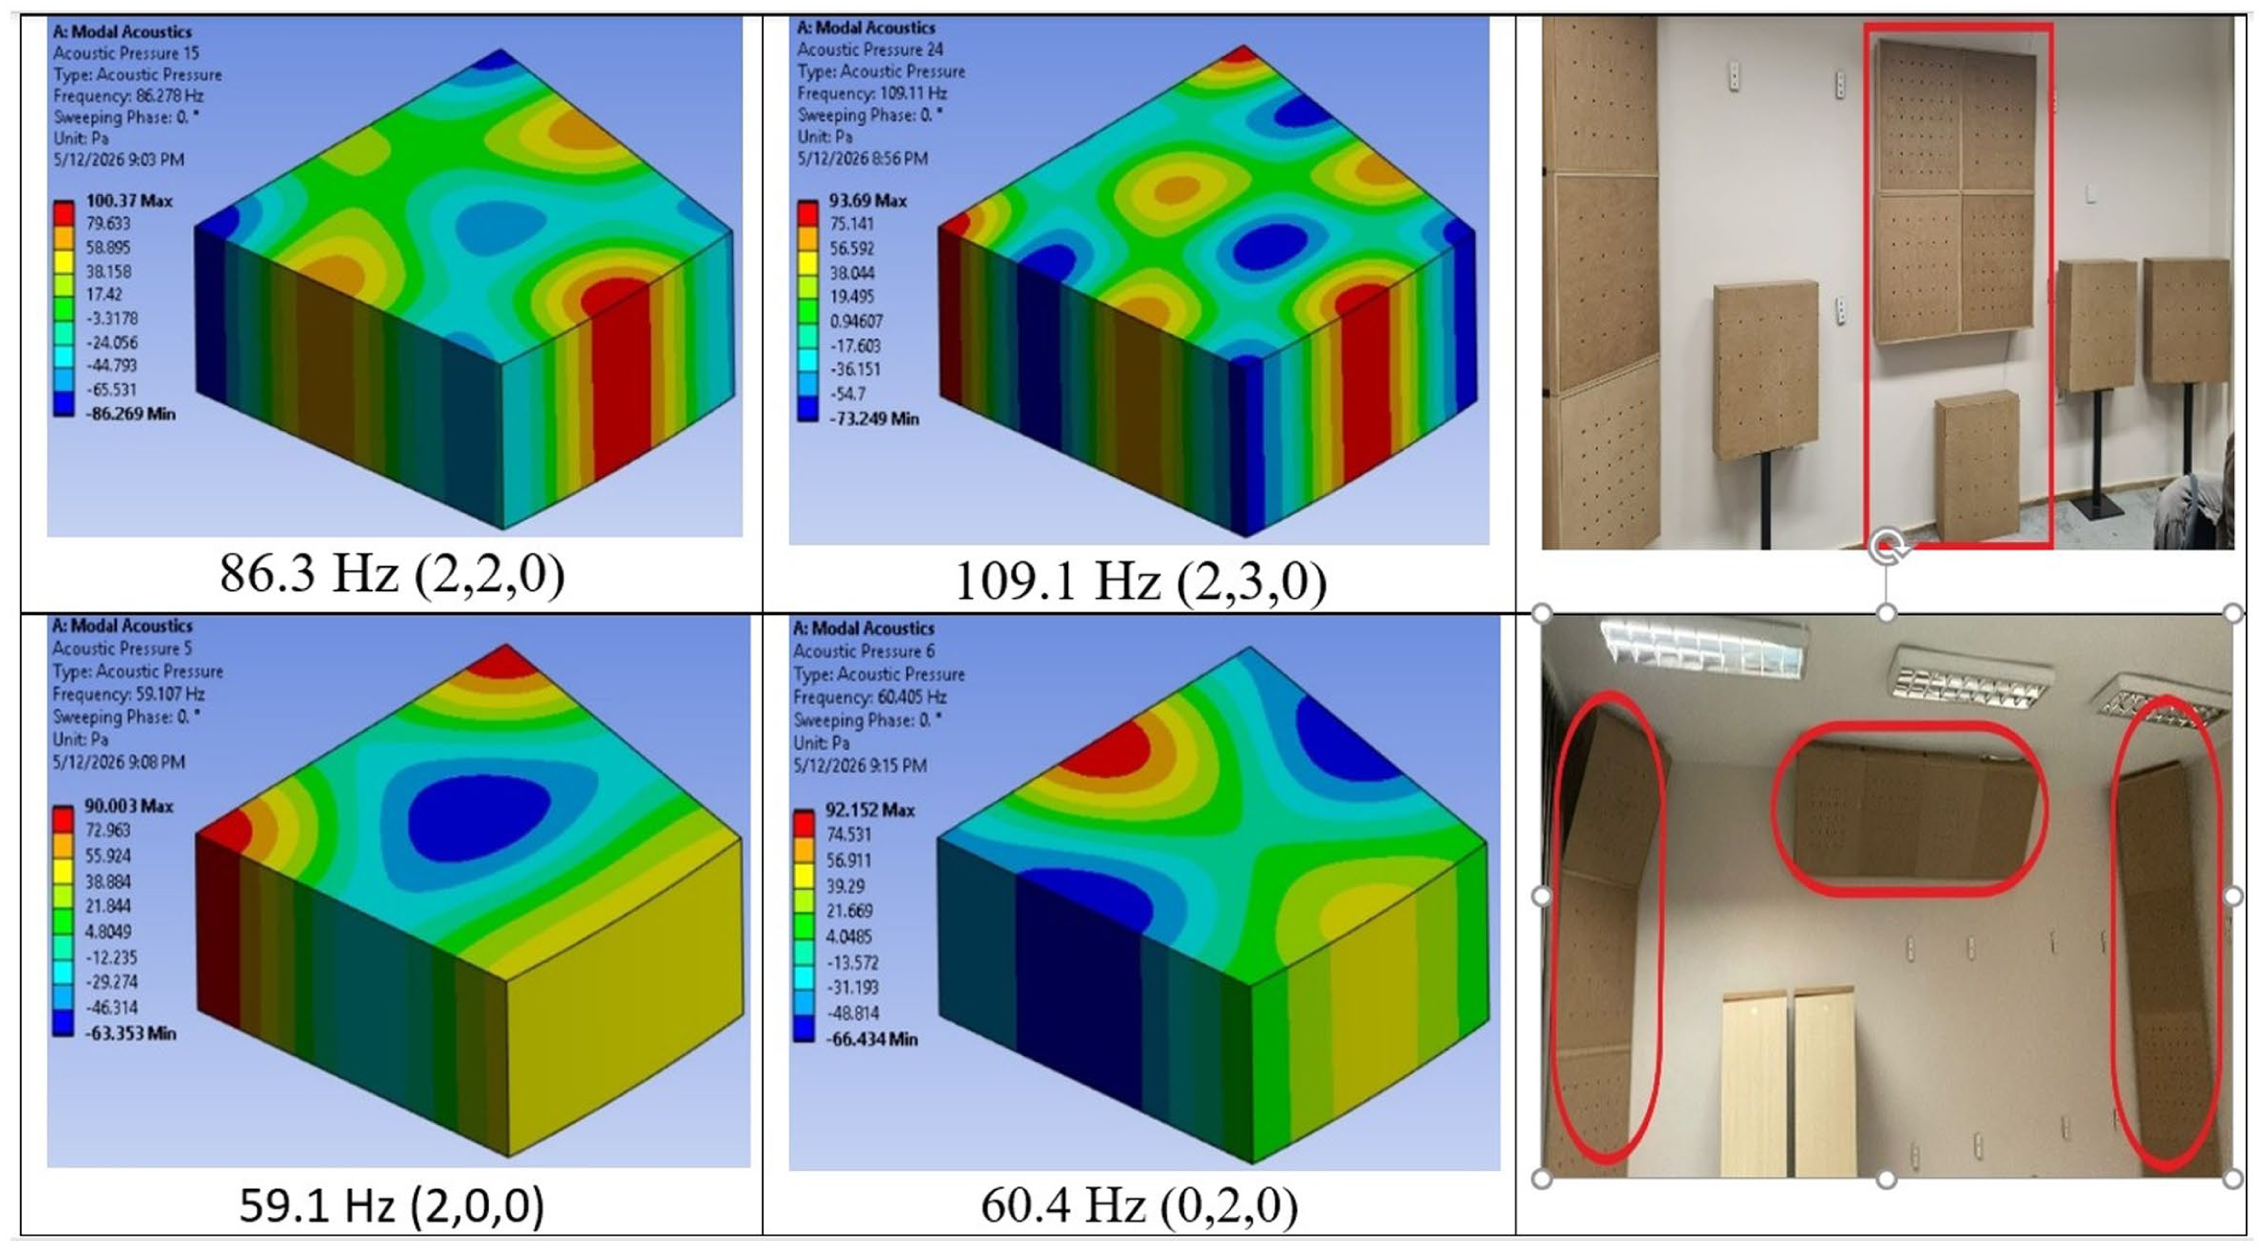
Modal simulation results font and back wall.
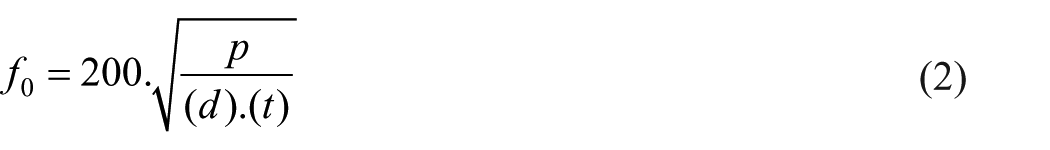
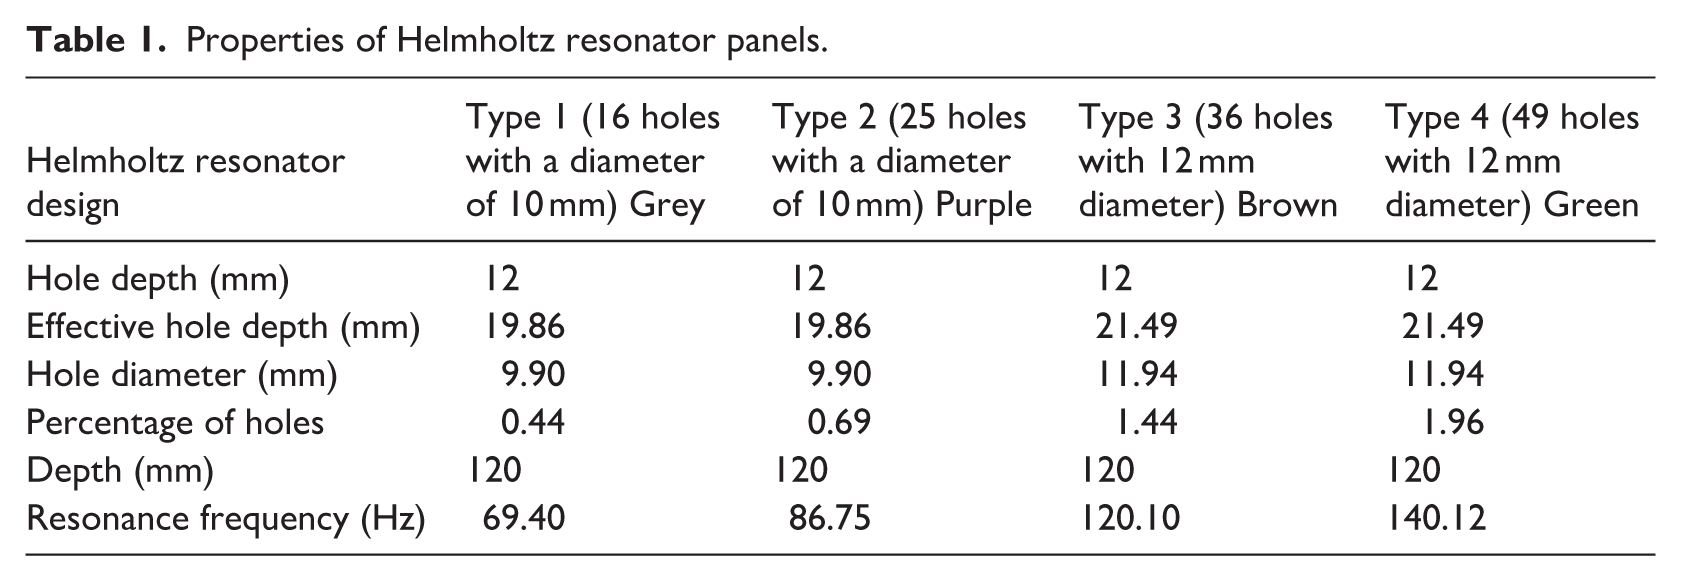
Designed to be effective in the lower frequency range, the Helmholtz resonator panels (Table 1), designed for broadband efficiency thanks to the porous sound-absorbing foams used behind them, were installed in corner positions to both reduce coloration from room modes and to reduce the reverberation time values, which are high in the lower frequency range. 40 These resonator panels were created using a formula that determines the frequency band in which the panels will be effective (equation (2)). Since sound-absorbing foam are placed behind the front perforated surface of the resonator panels created according to the formula, the frequency band in which they are effective is widened. 24 In equation (2), p represents the percentage of holes, d the depth (inch), and t the effective hole depth (inch). 41
Properties of Helmholtz resonator panels.
As shown in Figure 5, Helmholtz resonator panels are made of wooden boxes. A 4 cm thick layer of acoustic foam is placed immediately behind the perforated front panel. The perforated front cover is replaceable and held in place by magnets.
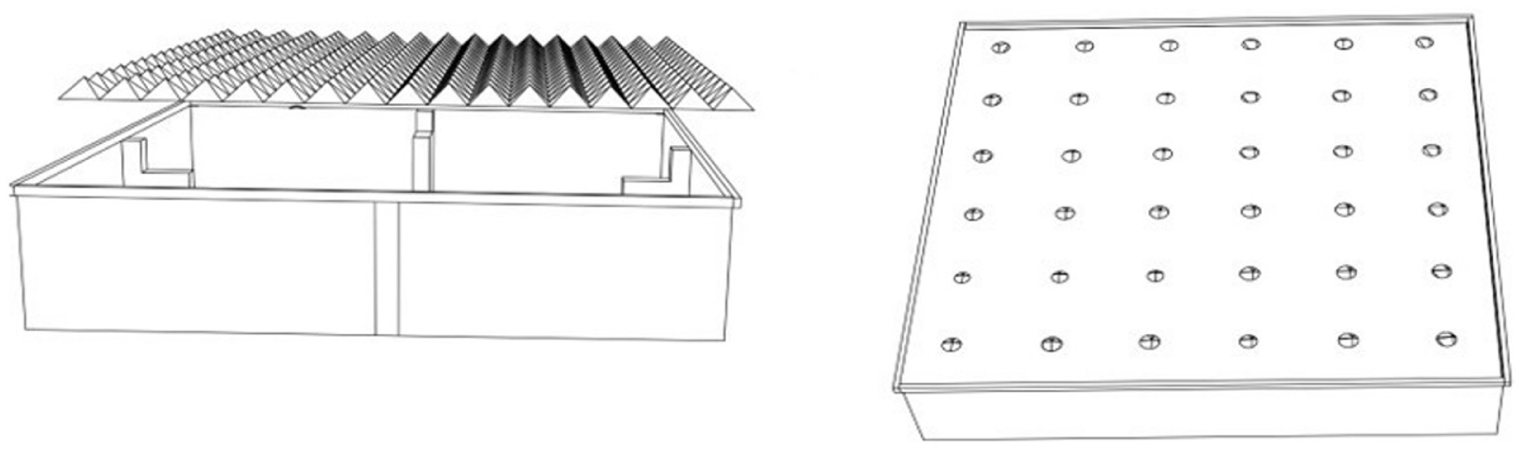
Helmholtz resonator panel section.
Room design
Three different room designs were created by changing the panel face (Figure 6). In addition to the piano-specific design, two other designs were created to examine the room response and changes in reverberation time at the location of the piano player (Figure 7).
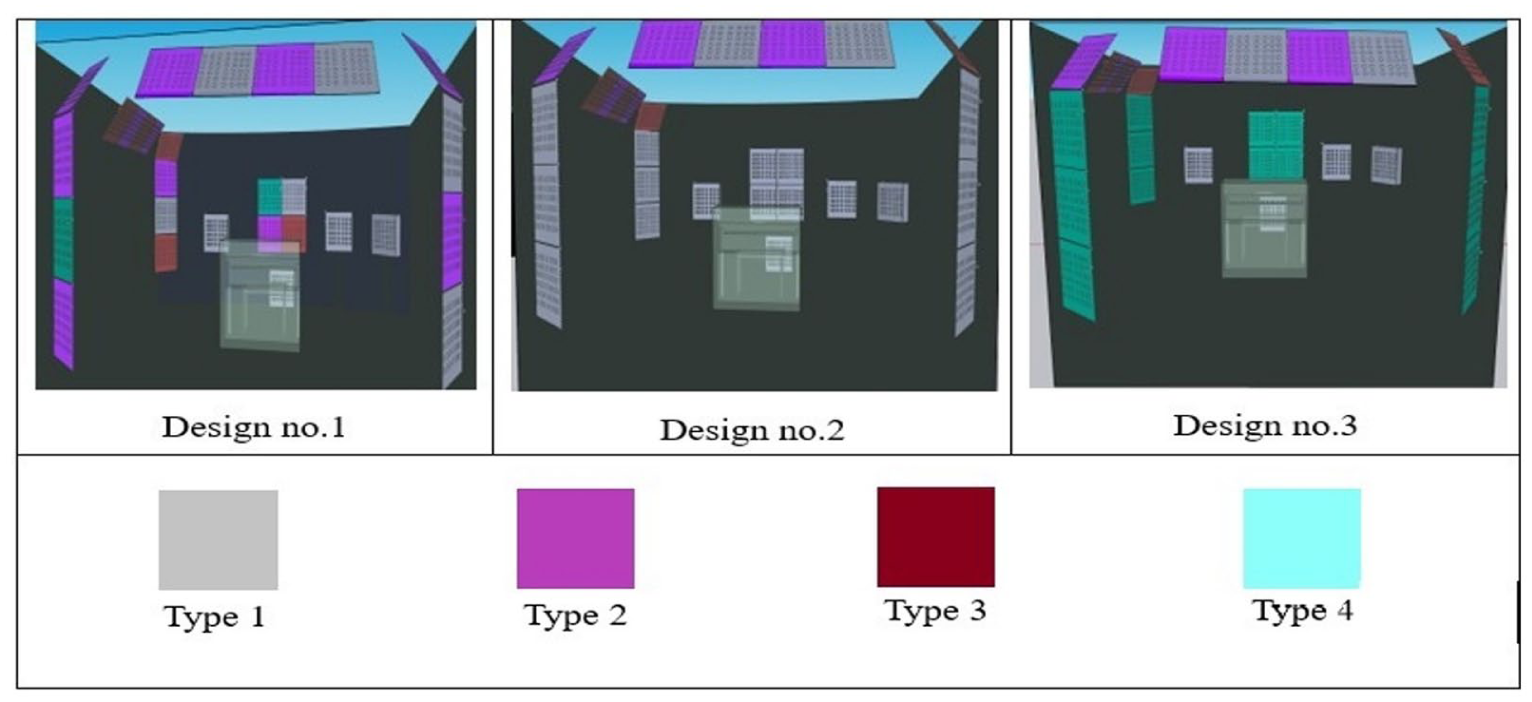
Three different acoustic designs after editing.
Panel and piano position on the plan.
Results
Comparison of acoustic parameters
In measurements taken before modification, the T30 values were above the optimum limit ranges determined according to the BS EN ISO 23591 standard in the 63, 125, and 250 Hz regions. It was determined that the resonator panels used in the modification improved the lower frequency regions, where they were effective. While entering the optimum limit range in the 125 and 250 Hz regions, the reverberation time in the 63 Hz region was reduced from 2.69 to 1.15 s (Table 2).
Measured acoustic parameters.
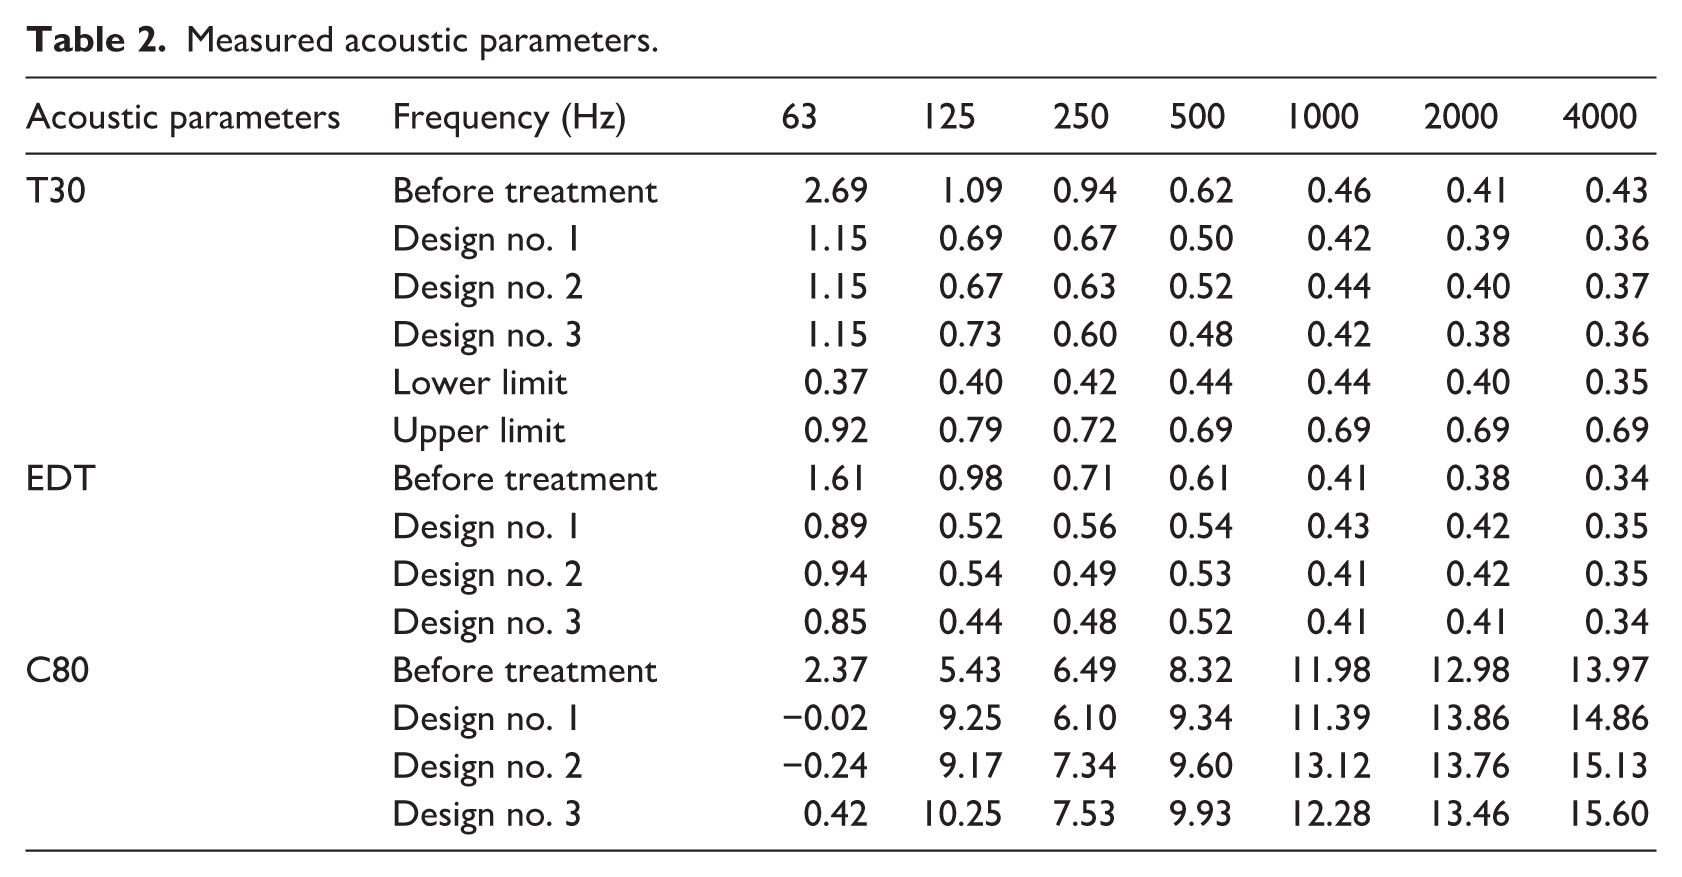
Before modification, the EDT values were above the limit values at the 63 and 125 Hz center octave frequencies. After modification, all three designs entered the limit range. The C80 values decreased in the 63 Hz center octave frequency region for all three designs compared to those before the modification. A noticeable increase was observed in the 125 Hz region for all three designs compared to before the modification. Simultaneously, the third design showed a noticeable change in this frequency region compared to the first and second designs.
The bass ratio decreased compared to that in the pre-modification state. The pre-modification bass ratio was 1.88, whereas after modification, it was determined to be 1.48 for the first design, 1.35 for the second design, and 1.47 for the third design. The decrease in the bass ratios was a result of the effect created by the panels used in the low-frequency region.
Room response comparison
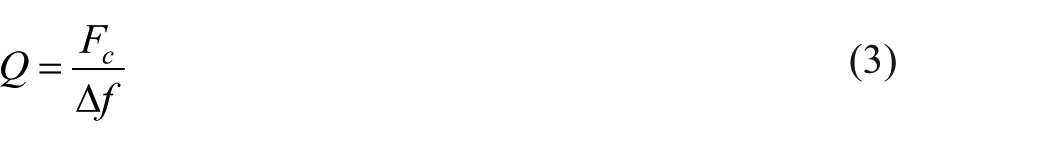
Q value was calculated using the formula given in equation (3),
41
where Q is the quality factor, Δf is band width,
Room response measurements conducted according to the ISO 18233 standard for piano playing in the room yielded room response graphs for three different designs (Figure 8). The first peak frequency detected in the room response was 70.1 Hz. The peak Q value at this frequency did not change significantly across the three designs. The first, second, and third designs showed 10, 8, and 6 peaks, respectively (Figure 9). It was observed that changing the panels resulted in changes in the Q values and the number of peaks in the room response.
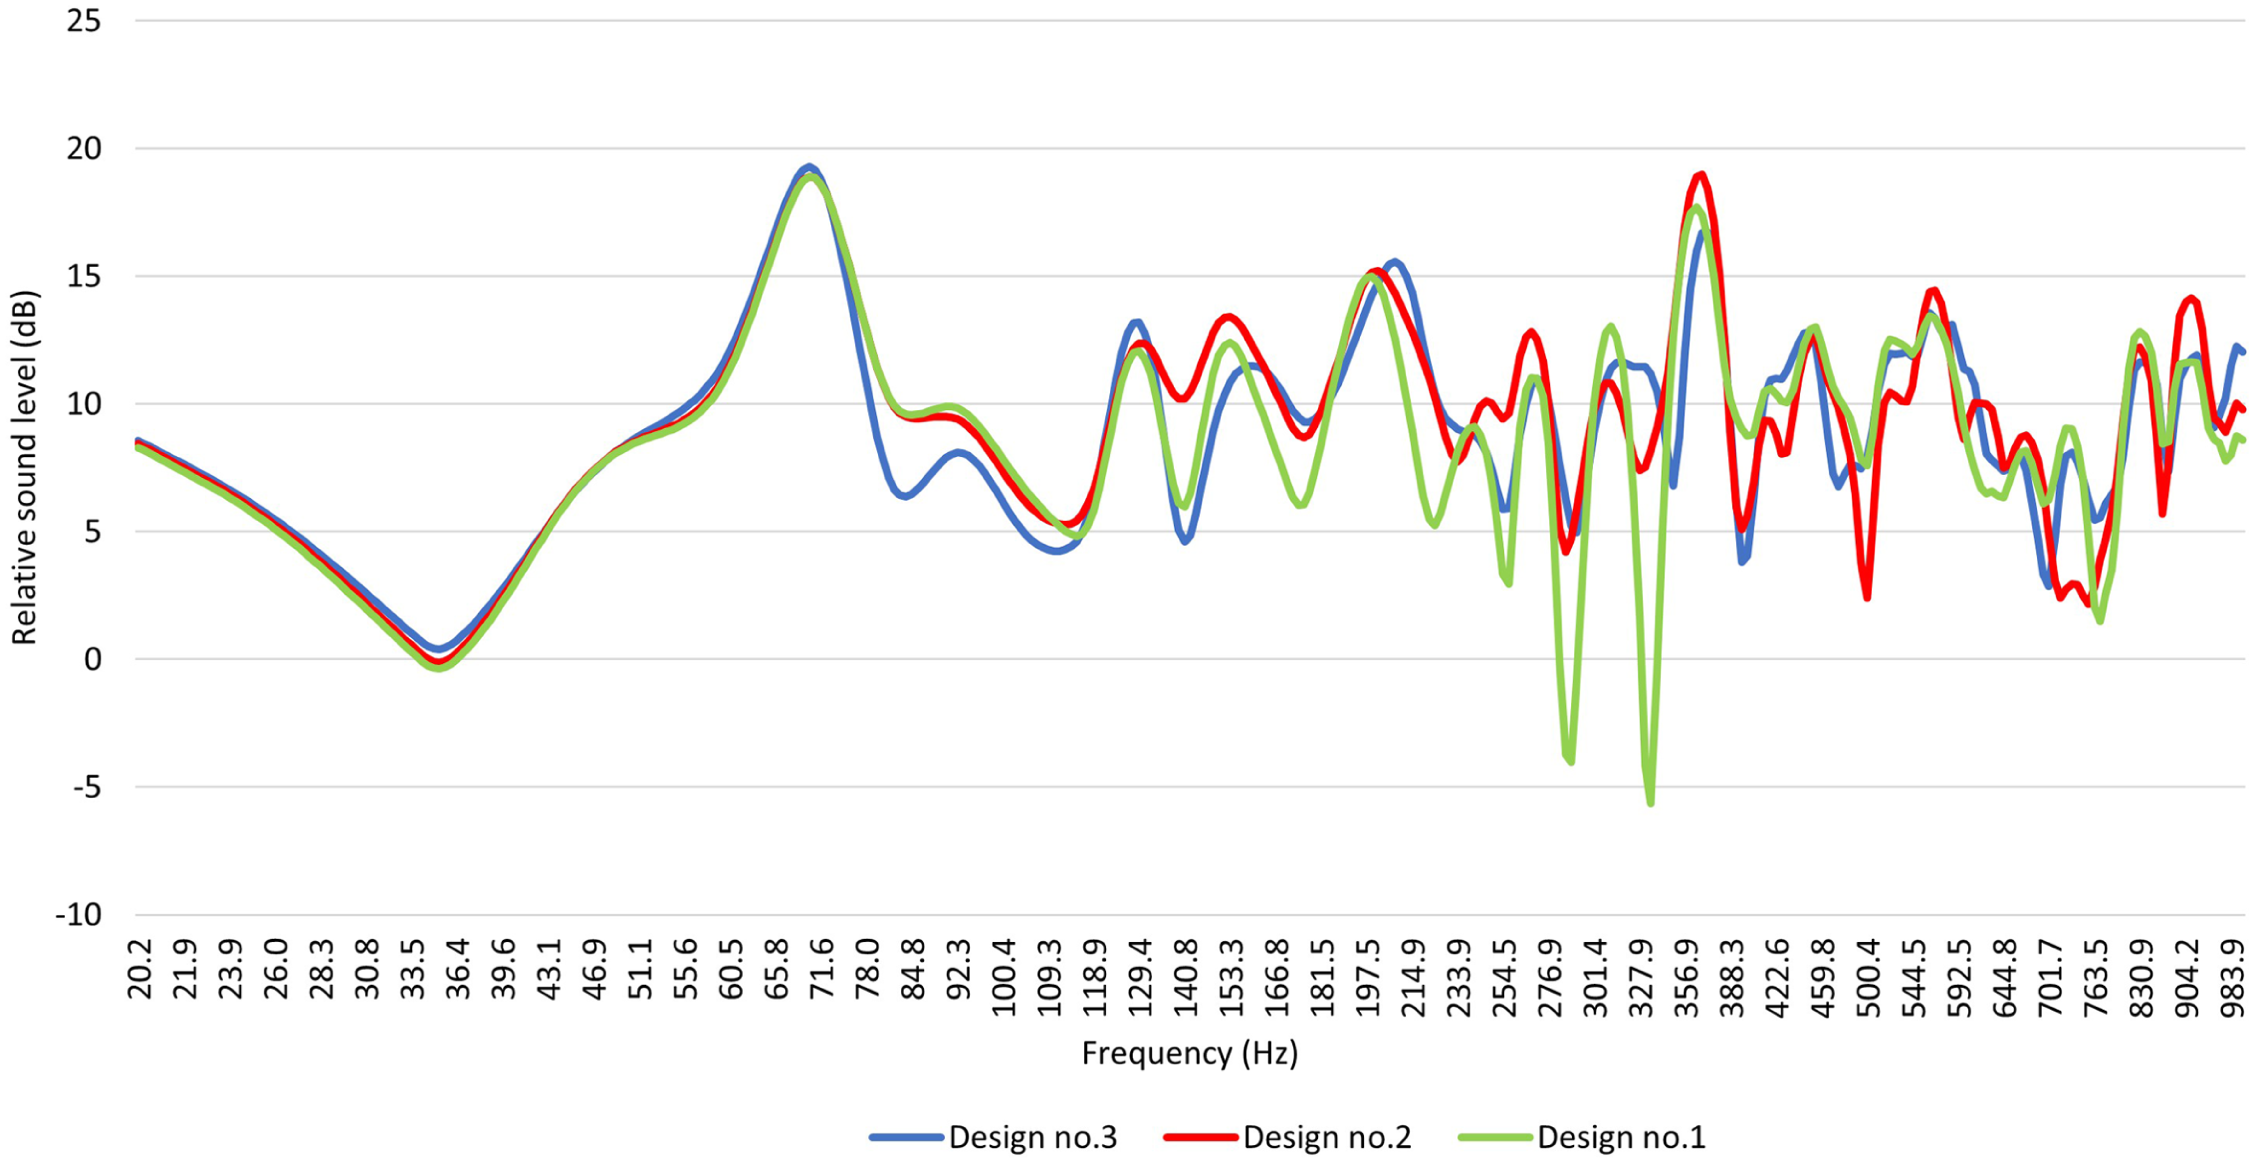
Post-editing room response curves.
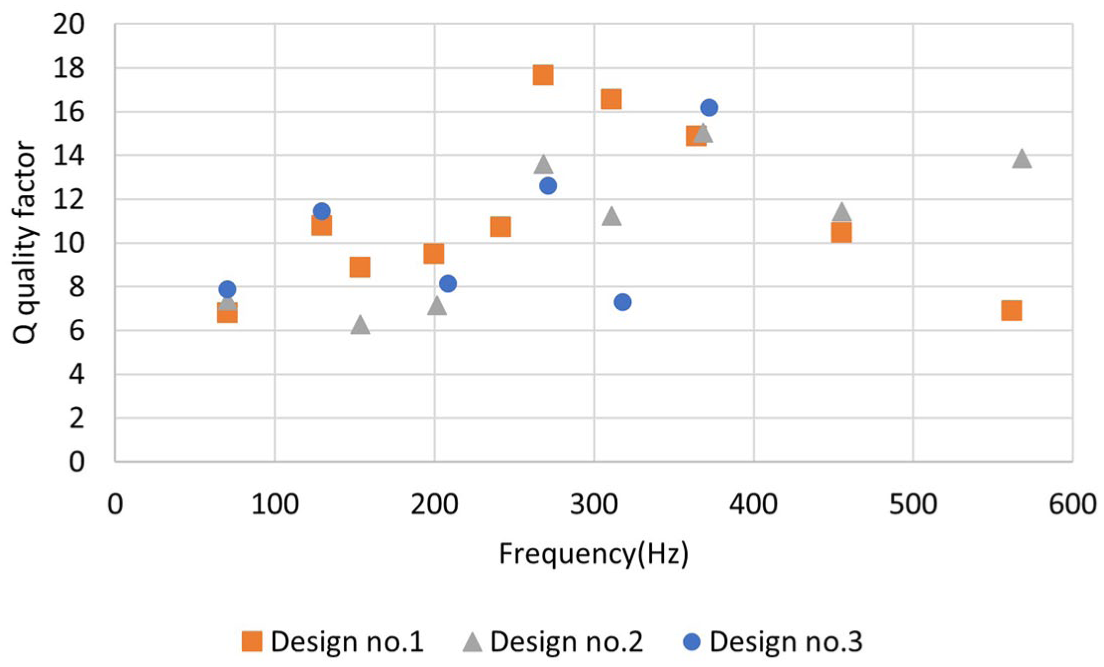
Peak frequency and Q (Quality factor) values after editing.
For the three different designs created with different panel front surfaces, the Q values of the trough frequencies in the room response were lower for the second and third designs than for the first design. It was observed that there were 8 trough frequencies in the first design, 5 trough frequencies in the second design, and 7 trough frequencies in the third design (Figure 10).
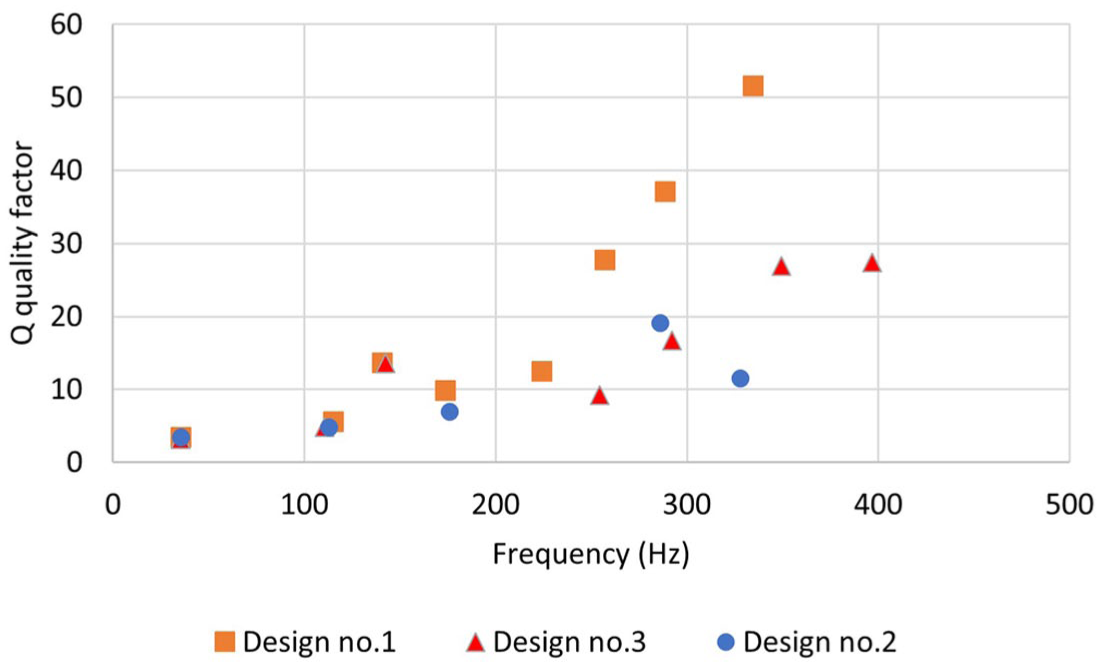
Bottom frequency and Q (quality factor) values after editing.
Comparing piano acoustic character to room response
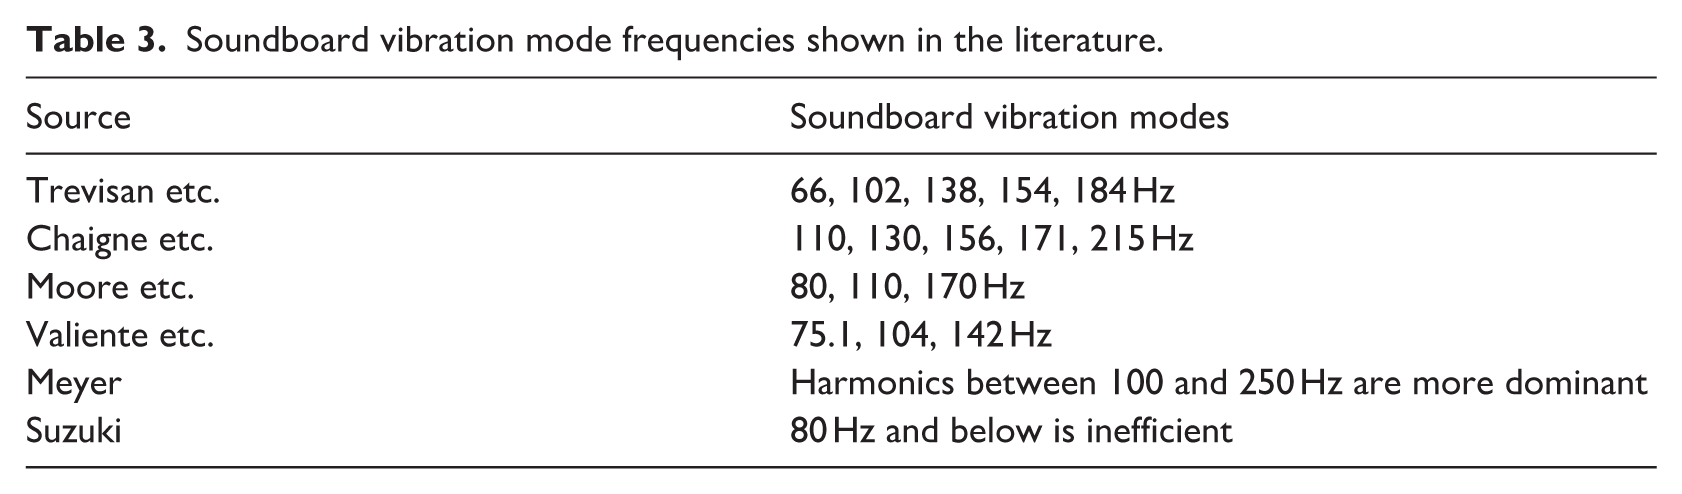
The resonance frequencies of the piano soundboard were determined by reviewing previous studies in the literature. The sound spectrum of a piano is largely determined by the emission properties of the soundboard. 38 The process by which the piano strings transfer the vibration energy to the soundboard and the sound propagation process depend on the dynamic properties of the soundboard. 42 Studies examining the vibrations and mode shapes of the upright piano soundboard 43 have revealed43–47 the modal frequencies and shapes of the soundboard. Table 3 lists the mode frequencies determined in these studies.
Soundboard vibration mode frequencies shown in the literature.
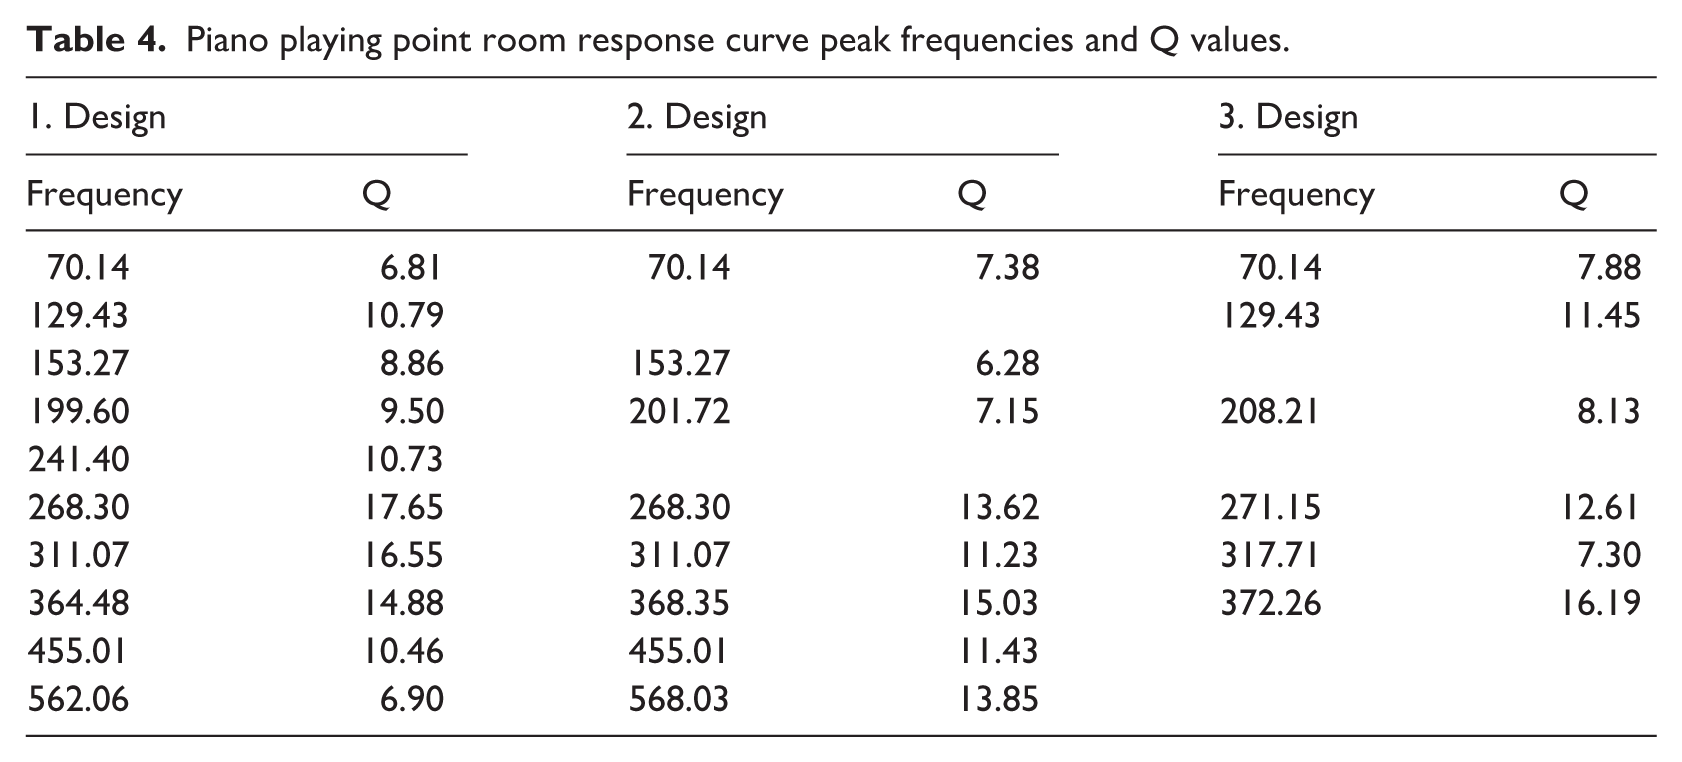
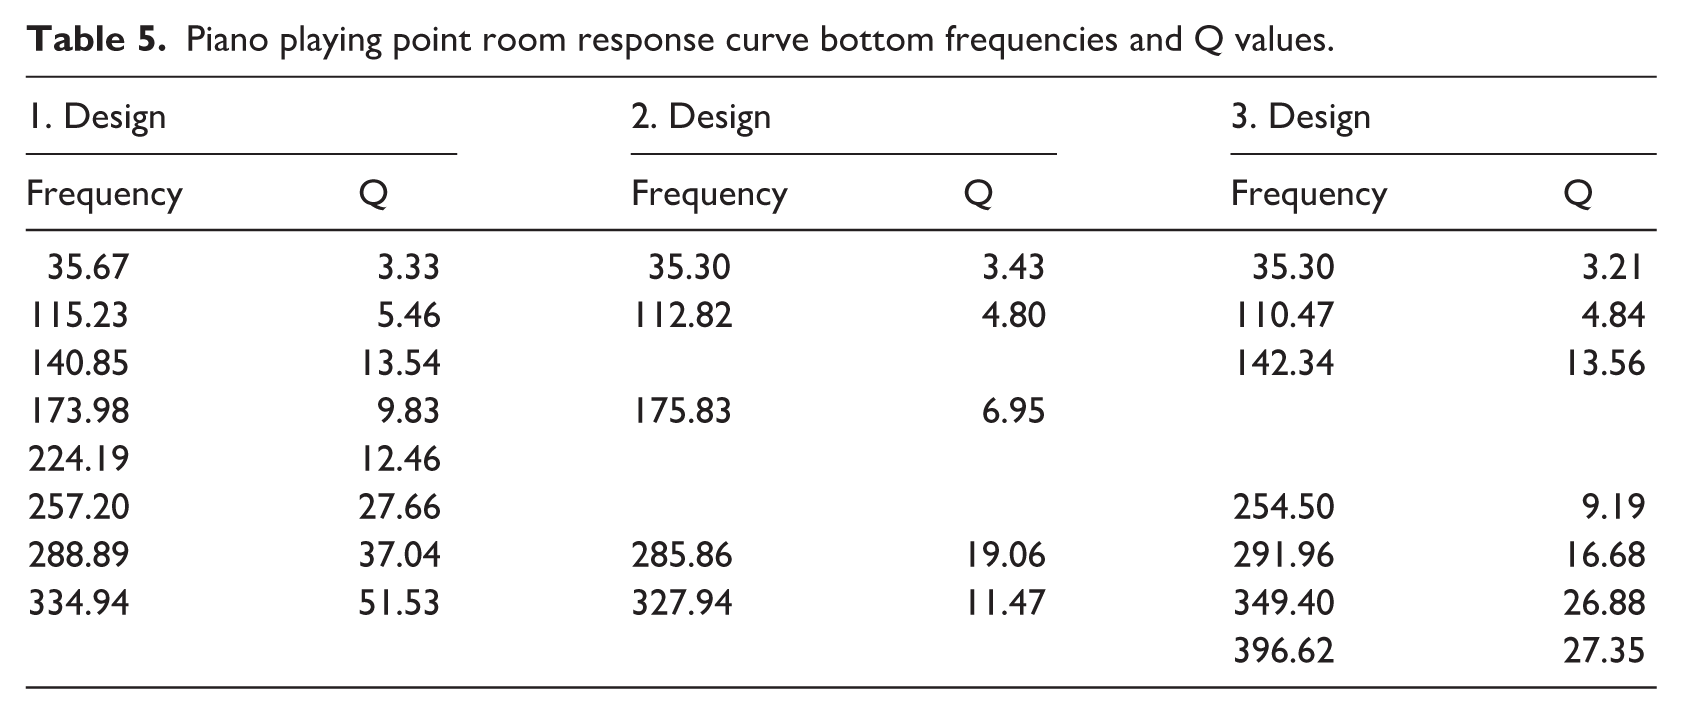
The peak and dip points determined in the room response curves taken at the piano playing point of the room where the research was conducted are given in Tables 4 and 5 for the three different designs.
Piano playing point room response curve peak frequencies and Q values.
Piano playing point room response curve bottom frequencies and Q values.
The expected resonant frequencies of the piano soundboard were compared with the peaks and troughs in the room response curve to determine which notes were heard louder or quieter. In all three designs, 70.14 Hz was the peak value in the room response curve. 66 Hz 43 and 75.1 Hz 45 are the expected soundboard resonance frequencies in this frequency range. It has been evaluated that the notes C#2 and D2, which are close to the frequency range of the piano soundboard, may be heard louder.
In the room response curve, the second peak was determined to be 129.43 Hz for the first and third designs, respectively. This peak frequency did not occur in the second design, which was expected. The expected resonance frequencies in this frequency range are 130 Hz. 44 and 138 Hz. 46 The third peak occurred at 153.27 Hz for the first and second designs but not for the third design. 154 Hz 43 and 156 Hz 44 are the expected piano soundboard resonances in the frequency range be.
The fourth peak occurred at different frequencies for the three designs. The first, second, and third designs peaked at 199.6, 201.72, and 208.21 Hz, respectively. In this frequency region, 184 Hz 43 and 215 Hz 44 are the expected piano soundboard resonances.
The first frequency that formed the bottom of the room response curve was 35.6 Hz for the first design and 35.3 Hz for the second and third designs. No piano soundboard resonance was observed in this frequency range. The second bottom frequency was 115.23 Hz for the first, 112.82 Hz for the second, and 110.47 Hz for the third design. The expected piano soundboard resonance in this frequency range was 110 Hz.46,44 The third bottom frequency was 140.85 Hz for the first design and 142.34 Hz for the third. This low frequency was not observed in the second design. The fourth bottom frequency, 173.9 Hz, was observed in the first and second designs, but not in the third design. The piano soundboard resonance frequency is expected to be 171 Hz.46,44 The fifth bottom frequency was determined to be 224.2 Hz, which was observed only in the first design. The sixth bottom occurred sharply for the first design. A sharp bottom at 257.2 Hz with a Q-value of 27.7 was observed in the first design but not in the second design. It occurred at 254.5 Hz with a Q value of 9.2 for the third design. The seventh bottom occurred at 288.9 Hz with a Q-value of 37 for the first design. A bottom region was formed at 285.9 Hz with a Q value of 19 in the second design and at 292 Hz with a Q value of 16.7 in the third design. The Q value at the seventh bottom frequency decreased in the second and third design iterations. The eighth bottom occurred at 334.9 Hz with a Q-value of 51.5 in the first design. It occurred at 327.9 Hz with a Q value of 11.7 in the second design and at 349.4 Hz with a Q value of 26.9 in the third design. The Q value, which was very high in the first design, decreased in the second. The ninth dip occurred only in the third design, with a Q value of 27.4 at 396.6 Hz.
Resonance perception
The survey utilized visuals of piano notes, frequency data, and musical notations to inquire about sounds perceived as higher or lower than others. It was hypothesized that sounds heard at high-pressure points within room modes would be louder, while those in areas at or near equilibrium pressure would be quieter.
In the first octave band, the 35 Hz frequency was marked four times for Design 3, resulting in a marking rate of 3.5%. The 65 Hz frequency was marked five times for Design 3, yielding a marking rate of 4.4%. In the second octave band, the 69, 73.4, and 82.4 Hz frequencies were each marked four times for Design 1, corresponding to a marking rate of 3.3%. For Design 2, the 110 Hz frequency was marked four times, also resulting in a 3.3% marking rate. For Design 3, the 69, 73.4, 78, and 82.4 Hz frequencies were marked five times, with a marking rate of 4.4%. Before editing, the 98 Hz frequency was marked eight times, yielding a marking rate of 7.3%; after editing, this rate decreased across all three designs. Similarly, the 104 Hz frequency was marked seven times before editing, resulting in a 6.4% marking rate, which significantly decreased after editing. In the third octave band, for Design 1, the 196 Hz frequency was marked six times, corresponding to a 5% marking rate, and the 220 Hz frequency was marked five times, resulting in a 4.2% marking rate. In Design 2, the 139, 164.8, 196, and 208 Hz frequencies were each marked six times, yielding a 4.9% marking rate. For Design 3, the 139 Hz frequency was marked six times, with a 5.3% marking rate, and the 196 Hz frequency was marked seven times, resulting in a 6.1% marking rate. In the fourth octave band, before adjustment, the 349.2 Hz frequency was marked five times, corresponding to a 4.5% marking rate. After adjustment, this frequency was marked four times in Design 1, with no markings observed in Designs 2 and 3. For Design 1, four markings and a 3.3% marking rate were observed at the frequencies of 261.6, 293.7, 329.6, 349.2, 440, and 493.9 Hz. In the fifth octave band, Design 2 exhibited four markings and a 3.3% marking rate at 587.3, 784, and 880 Hz. No significant marking rates were observed for Designs 1 and 3 before editing (Figure 11).
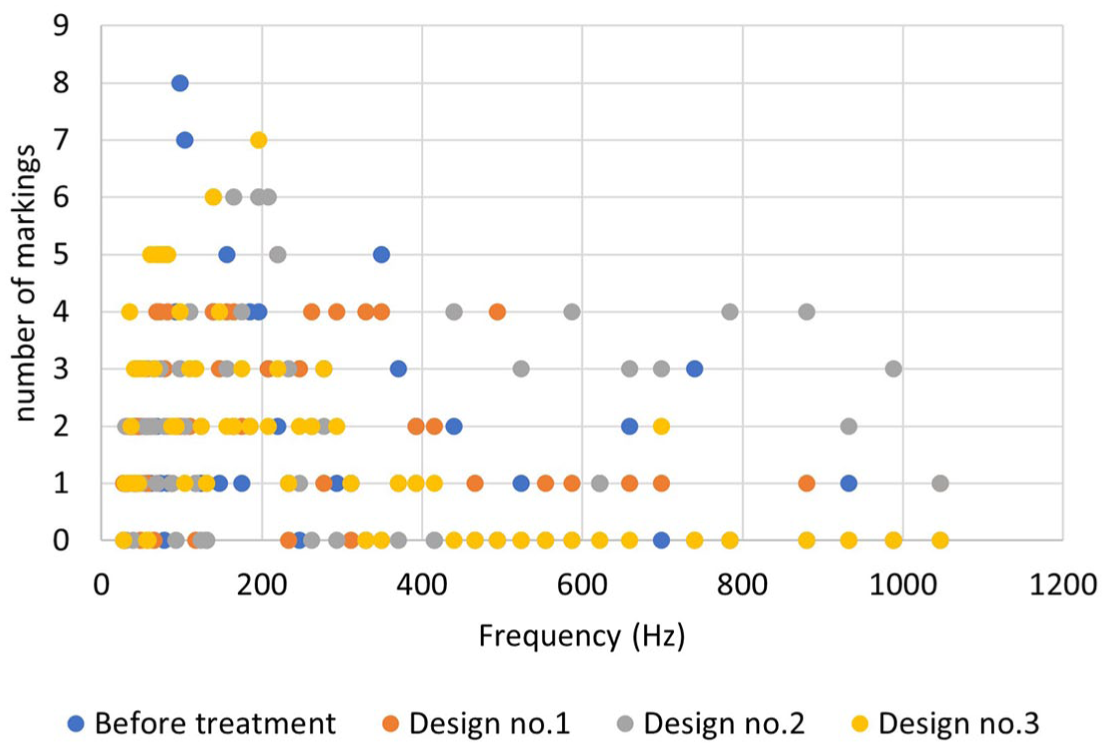
Number of high-pitched sound markings.
In the first octave band at 55 Hz, Design 1 had 4 markings with a mark rate of 4.3%. Design 2 recorded 5 markings and a mark rate of 6% at both 41.2 and 55 Hz. Design 3 had 3 markings with a mark rate of 3.8%. In the second octave band, the highest number of markings occurred at 82.4 Hz for Design 2, with 5 markings and a 6%mark rate, and at 87.3 Hz with 6 markings and a 7.1%mark rate. These frequency bands showed significant changes compared to the pre-modification measurements. In the third octave band, at 174.6 Hz, there were 6 markings with mark rates of 6.4% and 7.5% for Designs 1 and 3, respectively. A significant decrease was observed at 185 Hz in Designs 2 and 3 compared to before the modification. No significant marking rates or changes were observed in the fourth and fifth octave bands (Figure 12).
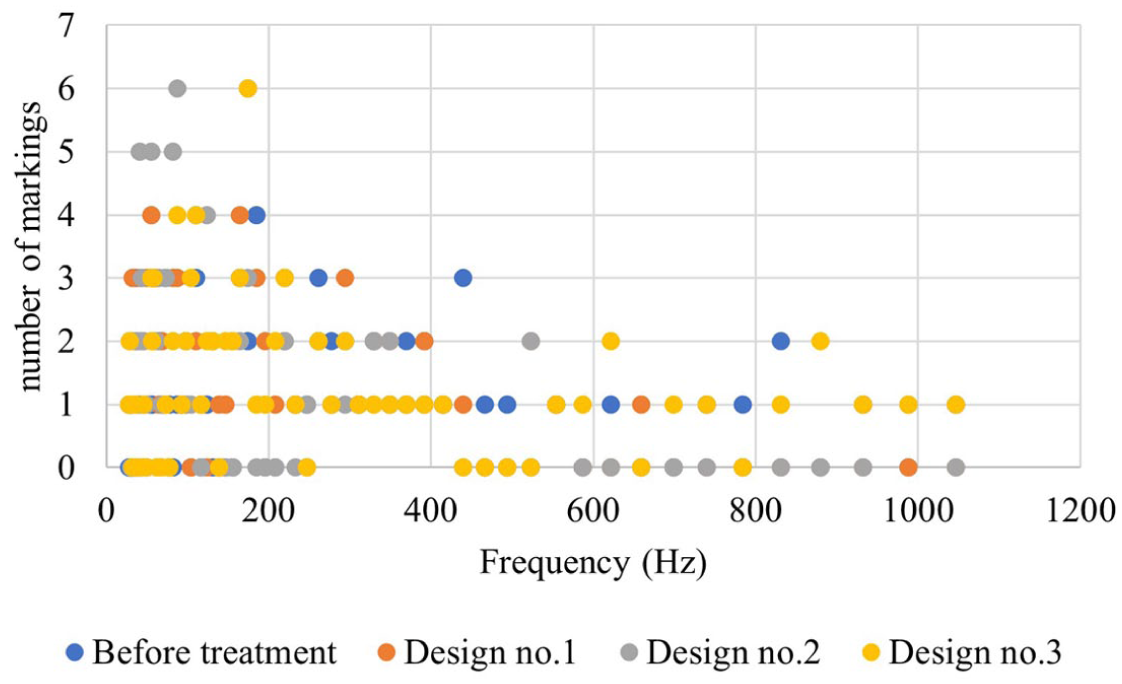
Low-pitched sound marking numbers.
Discussion
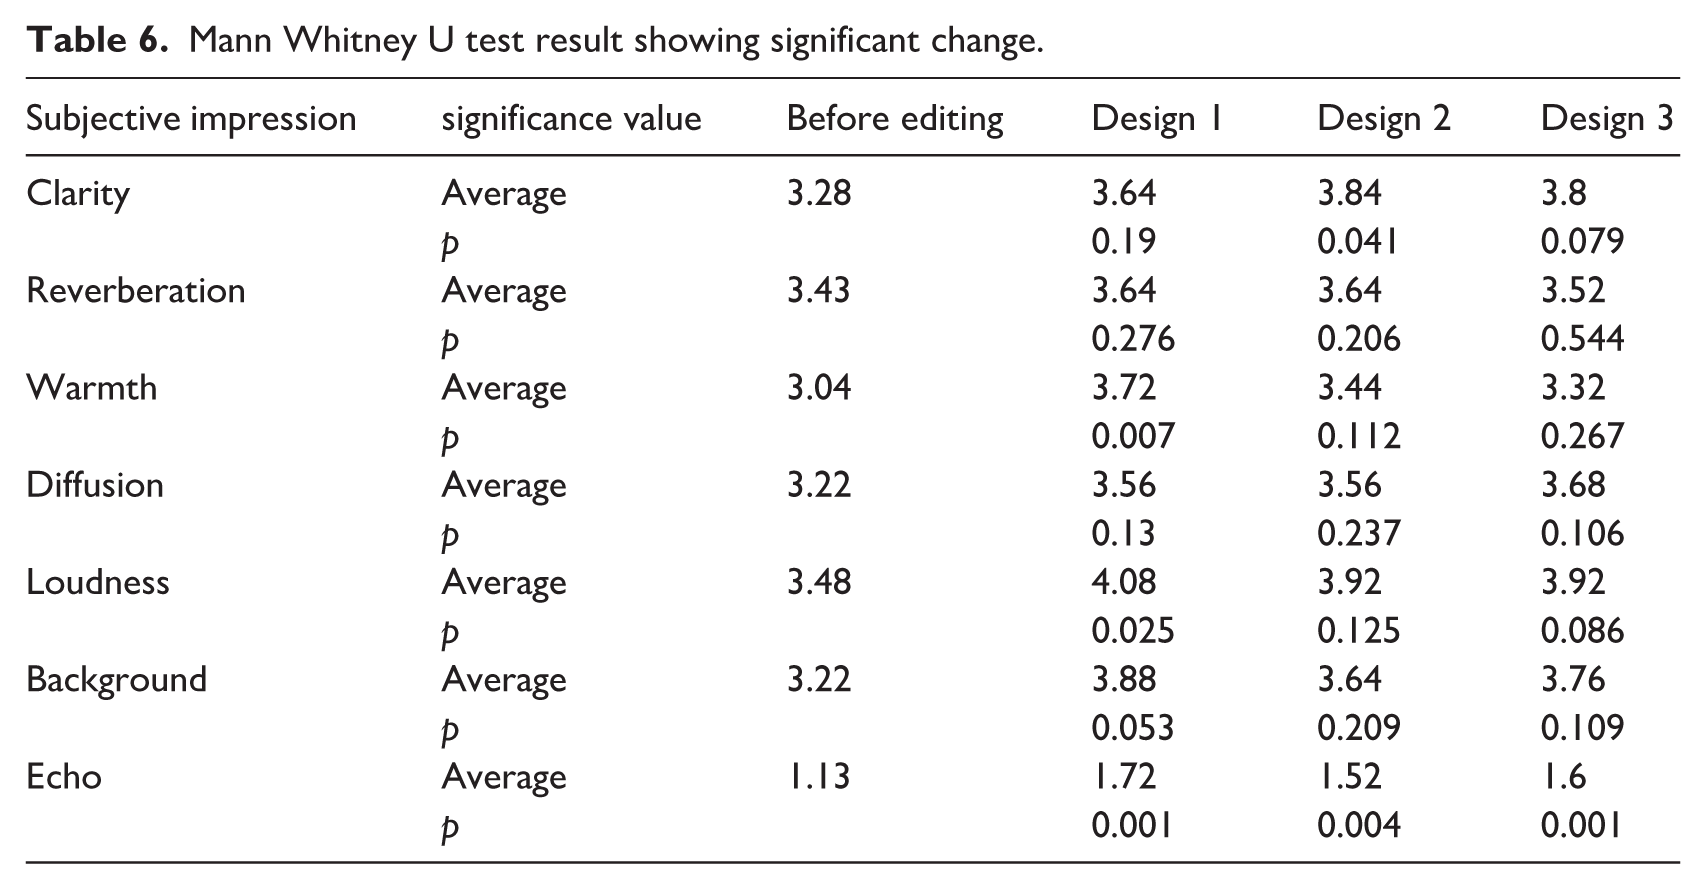
The perception of clarity increased for all three designs; however, the Mann–Whitney U test revealed a significant change only for Design 2. Comparing the C80 measurement results with the design’s impact area, C80 values increased in the 125 and 250 Hz frequency bands but decreased in the 63 Hz band. Although the clarity parameter varies depending on the volume in music study classrooms, it was found to be approximately 15 dB in rooms smaller than 100 m3. 46 In Design 2, clarity values at frequencies of 125 Hz and above increased compared to the pre-revision levels.
It was concluded that reverberation perception increased across three different designs; however, according to the Mann-Whitney U significance test (Table 6), this change was not statistically significant. Since the adjustment altered reverberation times in the lower frequency region but did not affect the upper frequency region as intended, the observed change in reverberation perception was limited.
Warmth perception increased for all three designs compared to the pre-modification level. However, according to the significance test, only the change in Design 1 was statistically significant. The pre-modification bass ratio was 1.84, but it decreased for all three designs: 1.47 for Design 1, 1.33 for Design 2, and 1.47 for Design 3. Adjustments to the bass region resulted in a decreased bass ratio, which was also reflected in the survey results. In qualitative evaluations, Design 3 was the most popular in terms of bass perception.
Perception of dispersion and background noise increased across all three designs; however, these changes were not statistically significant. Perception of loudness also increased across all three designs, with a significant change observed in Design 1. A significant change was found in echo perception across all three designs, with the perceptual presence of echo decreasing.
An examination of the survey results for high-pitched sound frequencies reveals that Design 1 exhibits a 5% signaling rate at 196 Hz (G3). This frequency is also signaled above 5% in the second and third designs. Regarding the room response, the fourth peak for Design 1 occurs at 199.6 Hz, with a Q value of 9.5. Considering the piano’s general acoustic properties, it is noted that the instrument produces more pronounced sounds between 100 and 350 Hz. 38
Mann Whitney U test result showing significant change.
An examination of the high frequencies for Design 2 shows that four frequencies exhibit a 4.9% ratio. There is no dip or peak in the room response curve for Design 2 at 139 Hz. Regarding the resonant frequencies of the piano soundboard, previous studies have reported a 2.2 mode at 138 Hz.43,44 It can be argued that the elevated sound level perceived at 139 Hz may be attributed to the piano soundboard, and that the room’s response facilitates this perception by not exhibiting a dip in this frequency range. In contrast, Design 1’s room response curve dips at 140 Hz, which may have prevented the resonance produced by the piano at this frequency from being perceived.
In the second design, a high sensitivity perception was observed at 164.8 Hz. The room response curve indicates that this frequency neither corresponds to a peak nor a trough but lies between the peak at 153 Hz and the trough at 174 Hz. When evaluating the piano soundboard in terms of resonant frequencies, the resonance is identified around 155 Hz.44,46 The piano’s greater emphasis on the third and fourth octaves may also contribute to this heightened perception. Additionally, the high perception occurring at these frequencies can be further understood by considering Meyer’s analysis. 38
In the third design, high sensitivity was observed with a 5.3% signaling rate at 139 Hz, which is very close to the lowest point of the room response curve at 142.4 Hz. Studies indicate that the piano soundboard resonates at 138 Hz. Additionally, a higher frequency of 196 Hz appears in all three designs.43,44
When examining sound frequencies with a signaling rate of 5% or higher in the survey results for low-pitched sounds, it was found that the frequency of 174.6 Hz (F3), corresponding to the 33rd key on the piano, was signaled at 6.4% for Design 1. An analysis of the room response curve reveals a dip at this frequency, with a Q value of 10. This frequency was also signaled at 7.5% for Design 3. The room response curve shows that a dip occurs in both the first and second designs, but this dip is absent in the third design.
The second design features two sound frequencies with signaling levels exceeding 5%. Specifically, 82.4 Hz (E2) signals at 6%, and 87.3 Hz (F2) signals at 7.1%. The room response curve shows no peak or trough within this frequency range but exhibits a downward slope following the peak at 70 Hz.
In the third design, signaling exceeded 5% at three different frequencies. As in the second design, signaling occurred at 87.3 Hz at 5%. Additionally, signaling occurred at 110 Hz at 5%. A dip of 4.8 Q was observed in the room response curve at 110.5 Hz in the third design. The decreased audibility observed at 174.6 Hz is due to a reduction in relative intensity in the room response curve, despite the absence of trough conditions at this frequency.
The physical boundary established by the room’s Schroder frequency (157.7 Hz) serves as the primary structural link between objective modal behavior and subjective instrument perception. Below this threshold, the untreated room acts as a non-diffuse acoustic filter, heavily modifying how low-frequency instrument outputs are perceived. In the baseline scenario, vital piano soundboard resonances at 70 and 138 Hz coincide with these unmitigated standing waves, leading to destructive acoustic interference such as the sharp 140 Hz dip observed in Design 1 that effectively masked the piano’s natural resonance. While implementing the Helmholtz panel configurations does not alter the room’s macro dimensions or its theoretical mathematical Schroder limit, the interchangeable face-plates provide targeted damping that systematically alters the Q-factors and smooths out the peaks and troughs within this modal danger zone. Consequently, by mitigating the modal coloration below 157.7 Hz, the customized panel layouts successfully transition the small space from a hostile acoustic environment into a harmonious, physical extension of the piano’s soundboard.
The study demonstrates that subtle modifications to the front faces of Helmholtz resonator panels significantly impact both objective room response and subjective musical perception. While all three designs improved lower-frequency reverberation (reducing the 63 Hz T30 from 2.69 to 1.15 s), the specific panel layouts created distinct acoustic environments:
Design 1 (Piano-Specific Baseline): This layout yielded a bass ratio of 1.48 and a high number of peaks (10) in the room response. While it significantly improved warmth and loudness perceptions, it also exhibited a sharp “dip” at 140 Hz. This dip likely masked the piano’s natural soundboard resonance at 138 Hz, explaining why musicians did not signal high sensitivity at that frequency despite the piano’s inherent power there.
Design 2 (Increased Clarity): By altering the panel faces, Design 2 achieved the lowest bass ratio (1.35) and a significant increase in clarity (C80) values for frequencies at 125 Hz and above. This design eliminated the 140 Hz dip found in Design 1, allowing the 139 Hz frequency to be perceived more clearly (a 4.9% signaling rate). This confirms that a “flatter” room response in critical frequency ranges can actually enhance the perception of the instrument’s natural characteristics.
Design 3 (Optimized Bass & Balance): This design was qualitatively favored for its bass perception. Though it had a bass ratio of 1.47 (similar to Design 1), it reduced the number of response peaks to 6, creating a smoother transition between frequencies. Musicians signaled high sensitivity at 196 Hz (6.1%), a frequency that aligns with the piano’s most pronounced output range.
The Mann-Whitney U tests confirm that while broad improvements were made, musicians were most sensitive to changes in echo reduction and clarity (specifically in Design 2) and warmth (Design 1). The reduction in “low-pitched” signaling at 185 Hz across Designs 2 and 3 suggests that these layouts effectively neutralized problematic room modes that previously clouded the lower octaves.
It is critical to assess the instances within the data where objective room response measurements did not directly correlate with subjective musician signaling. While the majority of perceived improvements aligned with the synchronization of room modes and soundboard resonances (particularly at 70 and 196 Hz), certain frequency bands exhibited signaling patterns that the modal peaks alone cannot fully explain. These outliers suggest that musical perception in small, non-diffuse spaces is not governed solely by spectral alignment, but is also influenced by secondary psychoacoustic factors such as the absolute loudness of the instrument and the potential for auditory adaptation during repeated listening. The existence of these divergent data points does not invalidate the proposed frequency-matching methodology; rather, it highlights the complexity of the acoustic-performer interface. Acknowledging these variations defines the boundary conditions of the current design framework and underscores the necessity for future research to integrate performance dynamics and longitudinal listener fatigue into the modal synchronization model.
Generally speaking, piano musicians experience increased audibility when the room response peaks; however, the resonant frequencies of the piano soundboard also play a significant role. If the room response dips and does not coincide with the piano’s resonant frequencies, it can be inferred that audibility is reduced.
Conclusion
The study revealed that the acoustic properties of a room can be modified by altering the surfaces of the front panels. It was found that piano players can perceive these changes and adjust their playing accordingly. In room acoustic design, low-frequency Helmholtz resonator absorbers should be positioned at locations where room modes exhibit high pressure. By identifying these room modes, correctly positioning the absorber panels, and adjusting their effective frequency range, musicians with well-developed musical ears can tailor the room acoustics to suit their instruments.
The research validates that the acoustic environment of a music study room can be successfully customized by manipulating the surfaces of adjustable Helmholtz resonator panels. The primary findings are as follows:
Panel-Driven Versatility: Changing only the front faces of the panels allowed the same room to pivot between a “warm” environment (Design 1) and a “clear” environment (Design 2), with musicians accurately perceiving these shifts.
Modal Alignment: The strategic placement of panels at maximum pressure points (corners and wall-ceiling junctions), as identified by modal simulations, is critical for controlling low-frequency coloration.
Frequency Compatibility: Maximum audibility occurs when room response peaks align with the piano soundboard’s natural resonances (e.g. at ~70 Hz and ~196 Hz). Conversely, room “dips” can effectively cancel out an instrument’s natural resonance, as seen with the 140 Hz dip in Design 1.
Musician Feedback: Experienced piano players are highly sensitive to these acoustic nuances, particularly regarding bass audibility and clarity.
In conclusion, piano-specific acoustic design should not only aim for standard reverberation targets but must also synchronize the room’s modal response with the unique resonance characteristics of the piano soundboard. These findings provide a framework for creating adjustable music classrooms that can be “tuned” to different instruments or pedagogical needs.
This study fills a critical gap in the literature by shifting the focus from general, instrument-agnostic reverberation targets toward a systematic framework of modal-instrument synchronization. While traditional designs utilize broad acoustic parameters, this research demonstrates a reproducible workflow for small spaces where room response peaks and troughs are explicitly aligned with the physical resonance characteristics of a specific instrument’s soundboard—in this case, the piano. Methodologically, the work introduces a validated strategy for dynamic customization using interchangeable Helmholtz resonator face-plates. These panels allowed for targeted low-frequency control (reducing the 63 Hz T30 from 2.69 to 1.15 s) and the correction of destructive “acoustic dips” that previously masked natural piano timbres. By establishing a direct correlation between specific room response Q-values and musician perceptions of clarity and warmth, the study provides a practical application strategy for “tuning” practice environments to match the harmonic signature of the instruments they house.
While this study establishes a strong link between instrument resonance and room modal response, it is important to acknowledge that musical perception is a multi-faceted phenomenon influenced by variables beyond spectral alignment. Although the results demonstrate significant correlations, certain instances where perceived outcomes did not perfectly align with modal data suggest the influence of uncontrolled variables, such as variations in playing intensity and the inherent loudness of the instrument. Furthermore, while the signaling method provided a granular view of frequency sensitivity, the reliability of subjective evaluations may be subject to adaptation effects during repeated listening sessions. Beyond these psychoacoustic variables, certain methodological limitations must be explicitly acknowledged when discussing the broader applicability of the findings. Specifically, the proposed frequency-matching methodology was demonstrated within a single experimental room using a single upright piano. Additionally, the piano’s primary resonance frequencies were derived from established literature rather than direct vibroacoustic measurements of the specific instrument used in the investigation. Variations in structural aging, manufacturing, and tuning across different pianos may introduce shifts in actual soundboard outputs. Future research should integrate direct modal testing of the specific instruments in situ, expand the workflow across diverse room geometries and instrument families (such as string or wind instruments), and incorporate more rigorous controls for performance dynamics and longitudinal listening tests to further isolate the effects of modal synchronization from psychoacoustic adaptation. Recognizing these complexities and boundaries does not diminish the proposed methodology but rather highlights the necessity of a holistic approach that accounts for both the physical acoustics of the space and the adaptive nature of human auditory perception.
Footnotes
Ethical considerations
The study was conducted in accordance with the Declaration of Helsinki and approved by the Ethics Committee of Yıldız Technical University. Informed consent was obtained from each participant. All data were anonymized prior to analysis.
Author contributions
Murat Tıraş conceptualized the study and wrote the original draft. Nuri İlgürel performed the analysis and contributed to data interpretation. All authors reviewed and approved the final manuscript.
Funding
The authors disclosed receipt of the following financial support for the research, authorship, and/or publication of this article: This work has been supported by Yildiz Technical University Scientific Research Projects Coordination Unit under project number FDK-2023 5896 BAP Doctoral Dissertation Project.
Declaration of conflicting interests
The authors declared no potential conflicts of interest with respect to the research, authorship, and/or publication of this article.