
Abstract
Background:
Magnetic resonance spectroscopy (MRS) offers non-invasive assessments of neuron–oligodendrocyte coupling and neuroinflammation to monitor treatment response in multiple sclerosis (MS).
Objective:
To track changes in N-acetylaspartate and myo-inositol in relapsing MS (RMS) and primary progressive MS (PPMS) patients treated with ocrelizumab over 2 years.
Methods:
Single-voxel MRS at 3T was acquired at baseline in 10 healthy controls (HCs), and weeks 0, 12, 24, 52, and 96 in MS participants at a single center.
Results:
Baseline myo-inositol was higher in PPMS than RMS (p = 0.047) and HC (p = 0.001), and correlated with disability across both MS groups (r = 0.57, p = 0.0006). Following treatment with ocrelizumab, both RMS and PPMS demonstrated declines in myo-inositol over time, returning toward HC levels (RMS p = 0.016; PPMS p = 0.004). Conversely, N-acetylaspartate was not different between groups and remained stable over time.
Conclusion:
Ocrelizumab treatment is associated with declining myo-inositol levels measured by MRS in both RMS and PPMS. Myo-inositol offers a unique biomarker to track resolution of gliosis and reactive microglia with treatment. Furthermore, the relationship between a higher concentration of myo-inositol and greater disability across both MS subtypes at baseline supports the presence of “smouldering inflammation” as a disease process across the spectrum of MS.
Clinical Trial:
Sub-study of the Ocrelizumab Biomarker Outcome Evaluation (OBOE; ML29966) trial: https://clinicaltrials.gov/study/NCT02688985
Keywords
Introduction
Histopathological and brain atrophy studies indicate that multiple sclerosis (MS) causes diffuse damage beyond MRI visible lesions, including within the normal appearing white matter (NAWM). Progression independent of relapse activity (PIRA) points to a sustained “smouldering inflammation.”1,2 Magnetic resonance spectroscopy (MRS) offers a range of biomarkers to detect abnormal metabolite levels caused by MS pathophysiology (see review by Swanberg et al. 3 ), as well as track changes with treatment. Longitudinal studies tracking response to immunomodulatory therapies have revealed stable levels of N-acetylaspartate (NAA).4,5 Our previous longitudinal study in people with relapsing MS (RMS) receiving treatment with interferon beta-1a or ocrelizumab (OCR) also demonstrated stable NAA in both cohorts over 2 years, but revealed a decline in the absolute concentration of myo-inositol (mI) in the OCR-treated group. 6 Given the high concentration of mI in glial cells, this decline in mI was interpreted as decreasing gliosis.
Ocrelizumab is a B-cell depleting monoclonal antibody that has been shown to reduce new focal inflammatory lesions and confirmed disability progression in both RMS and primary progressive (PPMS).7,8 The Ocrelizumab Biomarker Outcome Evaluation (OBOE; ML29966) study is an open-label, randomized, multi-center clinical trial to characterize longitudinal changes in patients with RMS or PPMS receiving OCR. 9 This work was a sub-study of the OBOE trial that obtained MRS data in RMS and PPMS participants receiving OCR at a single site. The goal of this sub-study was to investigate longitudinal changes in MRS metabolites to confirm our previous findings in RMS and to investigate whether PPMS exhibits similar metabolic changes in response to treatment with OCR. MRS measurements in this study were optimized to obtain high-quality spectra from a large NAWM region to track changes in WM health.
Materials and methods
Participants
This open-label (phase 3B) prospective study recruited 19 RMS and 14 PPMS participants from the OBOE study at one site (Table 1). RMS participant inclusion criteria included (1) Expanded Disability Status Scale (EDSS) 0 to 5.5, and <15 years since symptom onset for EDSS > 5.0 and <10 years since symptoms onset for EDSS ⩽ 5.0, and (2) evidence of disease activity in the previous year (at least one clinically documented relapse and/or one T1W Gadolinium-enhancing lesion and/or one new T2W lesion). PPMS participant inclusion criteria included the following: EDSS 3.0–6.5 with <10 years since symptom onset for EDSS < 5.0 points, and (2) documented history of elevated immunoglobulin G Index or ⩾1 immunoglobulin G oligoclonal bands. OCR was administered as two 300-mg infusions on days 1 and 15 and then single 600-mg infusions at weeks 24, 48, 72, and 96.
Baseline participant characteristics and MRI time points per cohort are given as the median and (range).
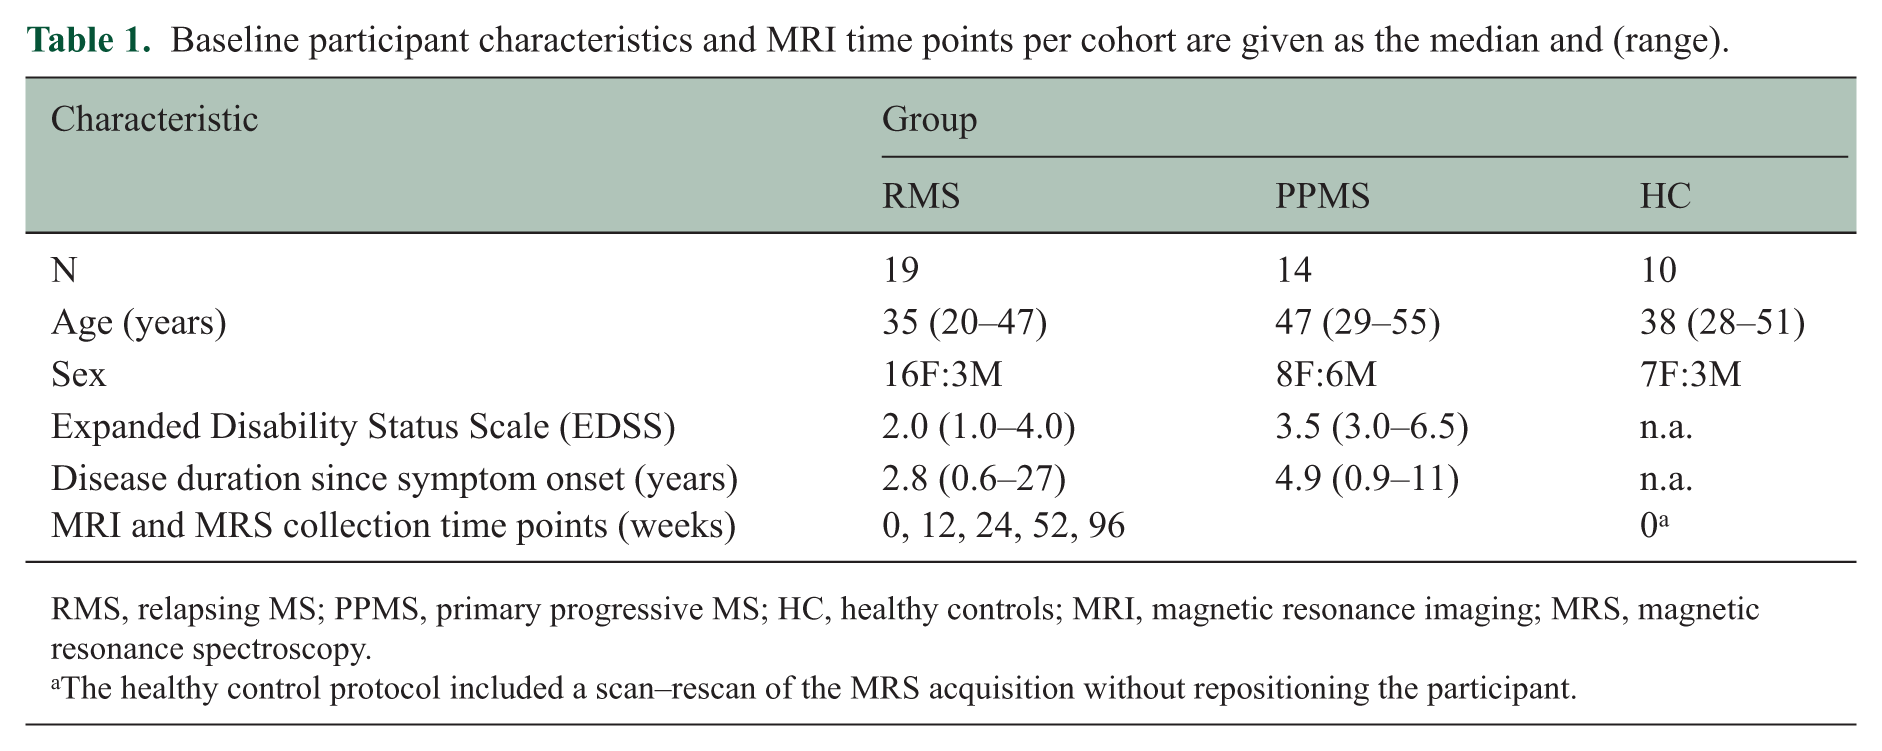
RMS, relapsing MS; PPMS, primary progressive MS; HC, healthy controls; MRI, magnetic resonance imaging; MRS, magnetic resonance spectroscopy.
The healthy control protocol included a scan–rescan of the MRS acquisition without repositioning the participant.
Participant visits occurred at baseline (before the start of treatment) and weeks 12, 24, 52, and 96 thereafter. Study visits included MRI scans and EDSS measurements. Ten healthy controls (HCs) were recruited from the local community with no history of neurologic or psychiatric disease to reflect the sub-study’s overall MS groups’ age and sex distributions, and were scanned once.
All subjects provided written informed consent as approved by the UBC Clinical Research Ethics Board (H16-01199 and H19-03364).
MRI and MRS data acquisition
All subjects were scanned on a Philips 3.0 T Achieva MRI system (Best, The Netherlands) with an eight-channel receive-only head coil. Structural imaging included MPRAGE, proton density-weighted (PDW), and post-Gd fluid-attenuated inversion recovery (FLAIR). The three-dimensional (3D) MPRAGE image was acquired with echo time (TE)/repetition time (TR)/inversion time (TI) = 6.8/2500/900 ms, an acquired voxel size of 1.0 × 1.0 × 1.2 mm3, and FOV = 256 × 240 × 204 mm3. The PDW image was acquired with TE/TR = 10/2000 ms, an acquired voxel size of 1.0 × 1.0 × 3.0 mm3, and FOV = 256 × 192 × 180 mm3. The post-contrast two-dimensional FLAIR was acquired with TE/TR/TI = 80/9000/2500 ms, acquired voxel size of 1.0 × 1.0 × 3.0 mm3, FOV = 256 × 192 × 180 mm3, and the contrast agent was dosed at 0.1 mL/kg over 1 minute and injected 10 minutes before acquisition.
Single-voxel spectra were acquired before gadolinium injection from the left centrum semiovale WM (Figure 1). The voxel was localized by Point RESolved Spectroscopy (PRESS) with dimensions 5 mm AP × 15 mm RL × 20 mm FH, positioned to maximize the fraction of WM, minimize the fraction of gray matter (GM), and avoid the ventricles, regardless of the presence of lesions. Voxel placement at follow-up time points was placed to match screenshots of the baseline voxel position. MRS was acquired with TE/TR = 31/4000 ms, 2048 samples, 2000 Hz bandwidth, 32 water-suppressed transients, and two non-water-suppressed transients. Water suppression using the scanner’s excitation option (two chemical shift selective pulses) was applied, and the chemical shift directions were set to avoid exciting water in the ventricles. The shim volume was placed over the volumes excited for both water and NAA, with dimensions 82 mm AP × 20 mm RL × 26 mm FH. Second order shimming with the scanner’s pencil-beam optimization routine was used. The total MRS scan time was 5:16, which included 3 minutes for pre-adjustments, shimming, and water suppression optimization. MRS was acquired twice in each healthy control.
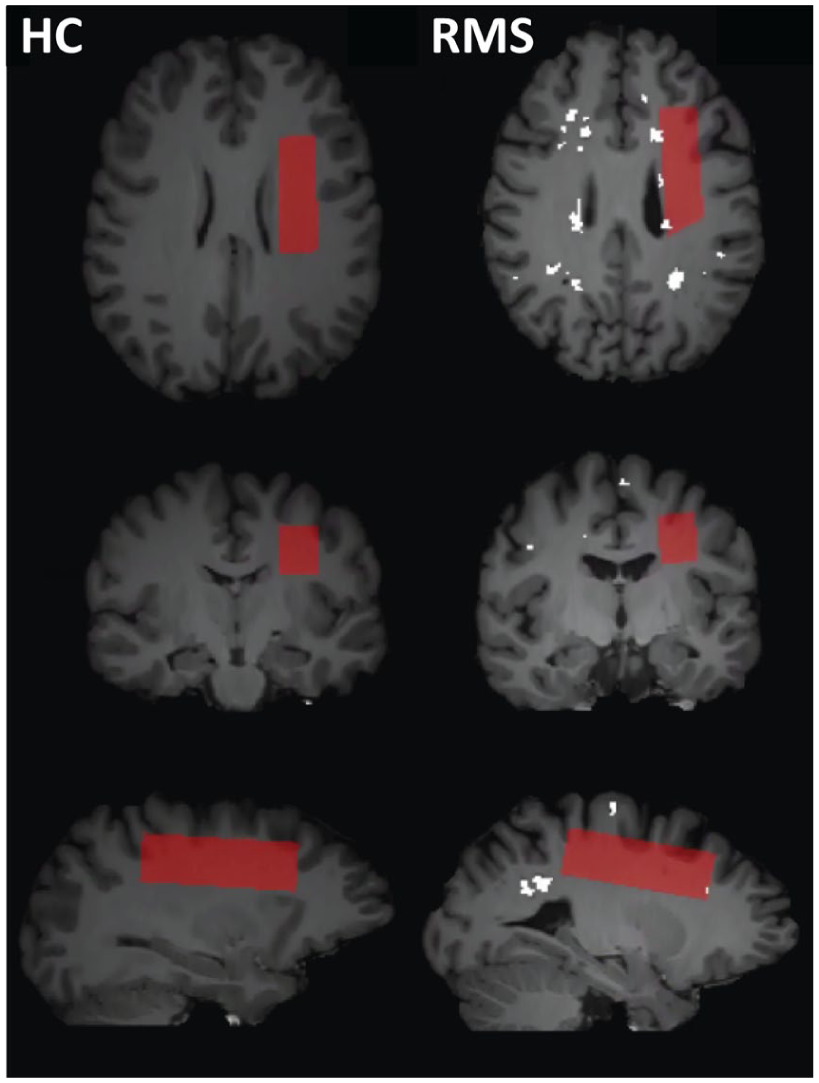
Left column: Example MRS voxel placement in red shown on a 3D MPRAGE image of a healthy control (HC). Right column: Example MRS voxel placement on a person with relapsing MS at baseline, with lesions shown in white.
Structural MRI data analysis
3D MPRAGE images were segmented into GM, WM, and cerebrospinal fluid (CSF) using FMRIB Software Library (FSL), first using the brain extraction tool (BET), then the automated segmentation tool (FAST). 10 Lesion masks were generated with a semi-automated routine using the PDW and post-Gd FLAIR. 11 Lesion masks and the MRS voxel were mapped onto the MPRAGE to extract voxel tissue fractions.
1H MRS data analysis
MRS data were imported into MATLAB (Natick, MA, USA) via an in-house script that performed frequency alignment, zero-order phase, eddy current correction, and averaging.
The averaged metabolite spectra were fit with LCModel (version 6.3-1H 12 ). The basis set was simulated in FID-A 13 including 19 metabolites (see Supplemental Material), and lipid peaks were modeled by LCModel as Gaussian–Lorentzian lineshapes. Absolute metabolite concentrations were calculated using the water scaling approach, with an in-house MATLAB script as previously described. 14 Spectra with an LCModel full width at half maximum (FWHM) > 10 Hz or LCModel signal-to-noise ratio (SNR) <15 were rejected. 15 Each LCModel output was visually assessed by a trained analyst (BRS, GA, JK, or MW), with any potentially unusual spectra reviewed by an expert MR spectroscopist (ELM). Individual metabolite concentration values were rejected if the absolute error ⩾30% of the median value.6,16 HC absolute concentrations were averaged across the two scans. Metabolite concentration values are available upon request.
Statistical analysis
Spectral quality and metabolite levels at baseline were compared across groups using the Kruskal–Wallis test. The relationship between baseline metabolite and EDSS across both MS cohorts was tested with Spearman correlations in MATLAB. Correlations of mI with EDSS at other timepoints can be found in Supplemental Material (S4.5). Changes over time were examined using a linear mixed-effects model in MATLAB, and coefficients are given with 95% confidence intervals. Linear mixed-effects models were used because they accommodate unbalanced longitudinal data and allow inclusion of participants with missing follow-up time points. The primary model included random intercepts and a common slope with time. An adjusted model included the potential covariates of age, as well as the voxel tissue fractions of WM, GM, and lesion. CSF was not included as a covariate since the voxel tissue fractions will add to 1. For each metabolite, the adjusted model was step-wise reduced by each covariate that had the highest p value until all remaining covariates were significant at the p < 0.05 level (not corrected for multiple comparisons).
The Benjamini–Hochberg procedure was used to reduce the false discovery rate to below 10% while balancing the power to detect change over time. p-value thresholds for significance are calculated as
Results
Study adherence
Over the 2-year treatment period, 17/19 RMS and 12/14 PPMS participants completed all visits. All HC completed one MRI session.
MRS quality metrics
All MR spectra passed the minimum acceptance criteria for SNR and FWHM, and no artifacts that obscured a metabolite peak were detected. All scans exhibited a high SNR with a median of 35 (range: 25–45). SNR was different between groups (p = 7 × 10⁻⁶), with PPMS lower than both HC and RMS (Table 2). Linewidth was low across all scans, with a median of 4.3 Hz (3.5–8.8 Hz). The metabolites NAA, total creatine (creatine + phosphocreatine, tCr), total choline (tCho), mI, glutamate (Glu), and glutathione (GSH) were reliably detected in all scans. However, the majority of absolute errors for glutamine and lactate were ⩾30% of the median, so these metabolites were excluded from further analysis. Example spectra are shown in Figure 2.
MR spectra quality metrics and voxel tissue fractions across groups.
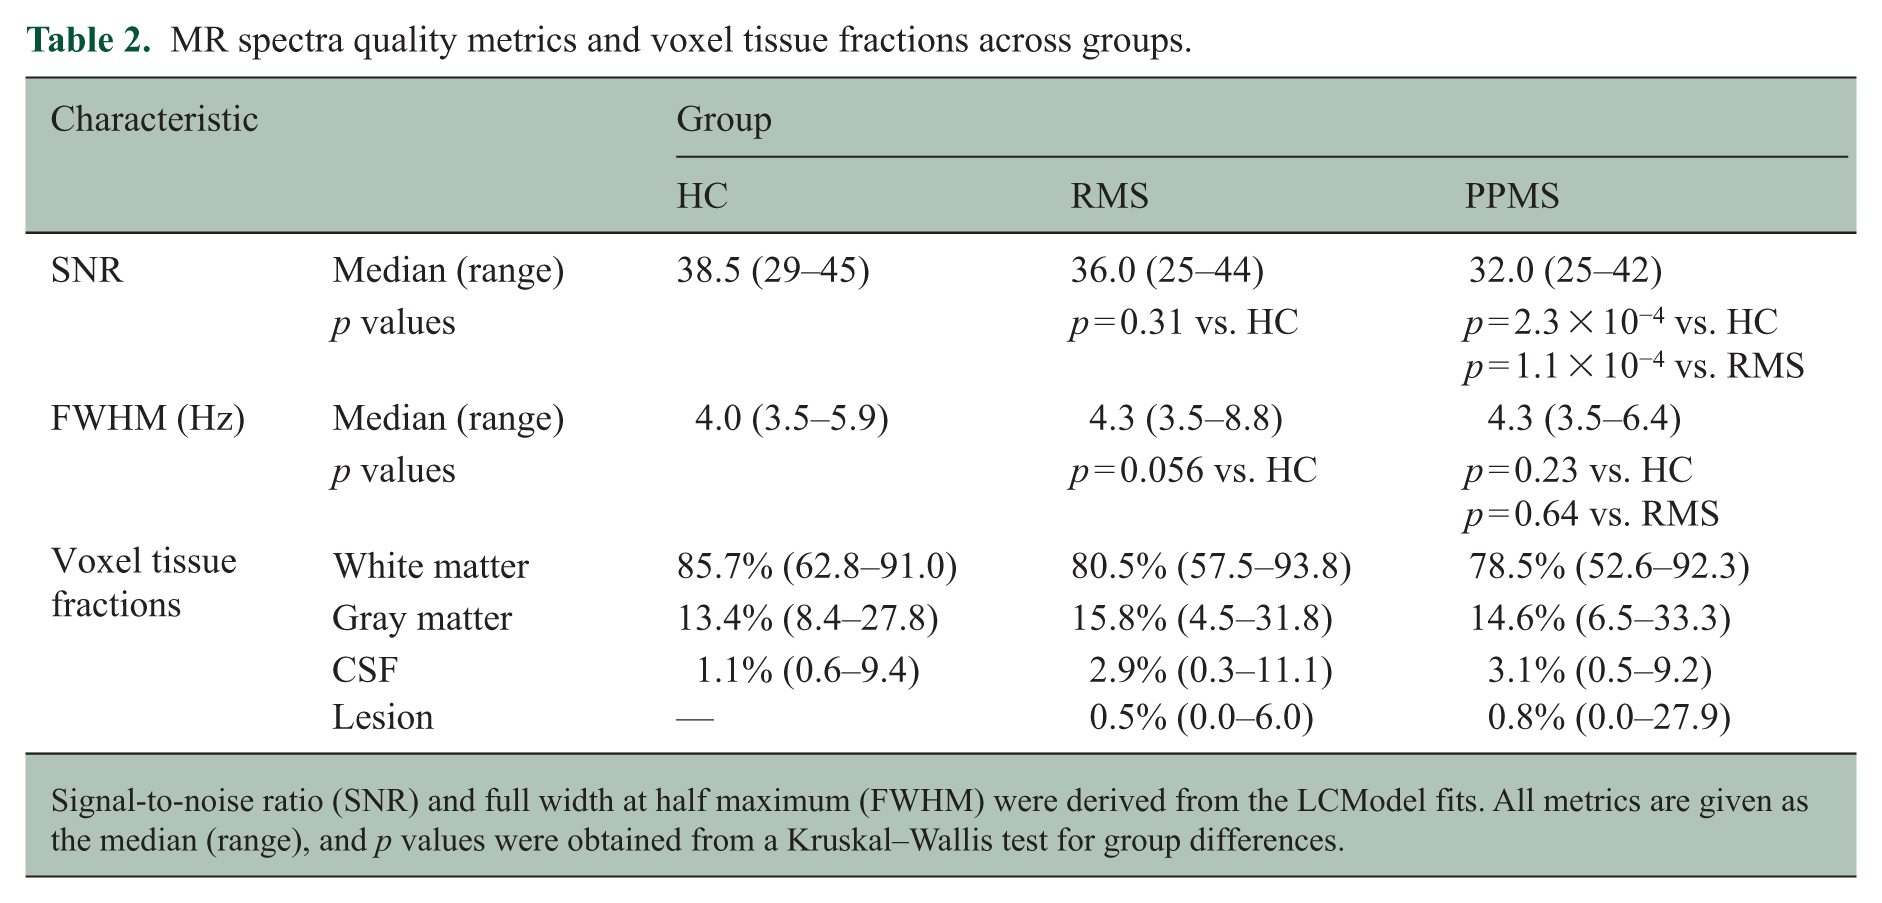
Signal-to-noise ratio (SNR) and full width at half maximum (FWHM) were derived from the LCModel fits. All metrics are given as the median (range), and p values were obtained from a Kruskal–Wallis test for group differences.
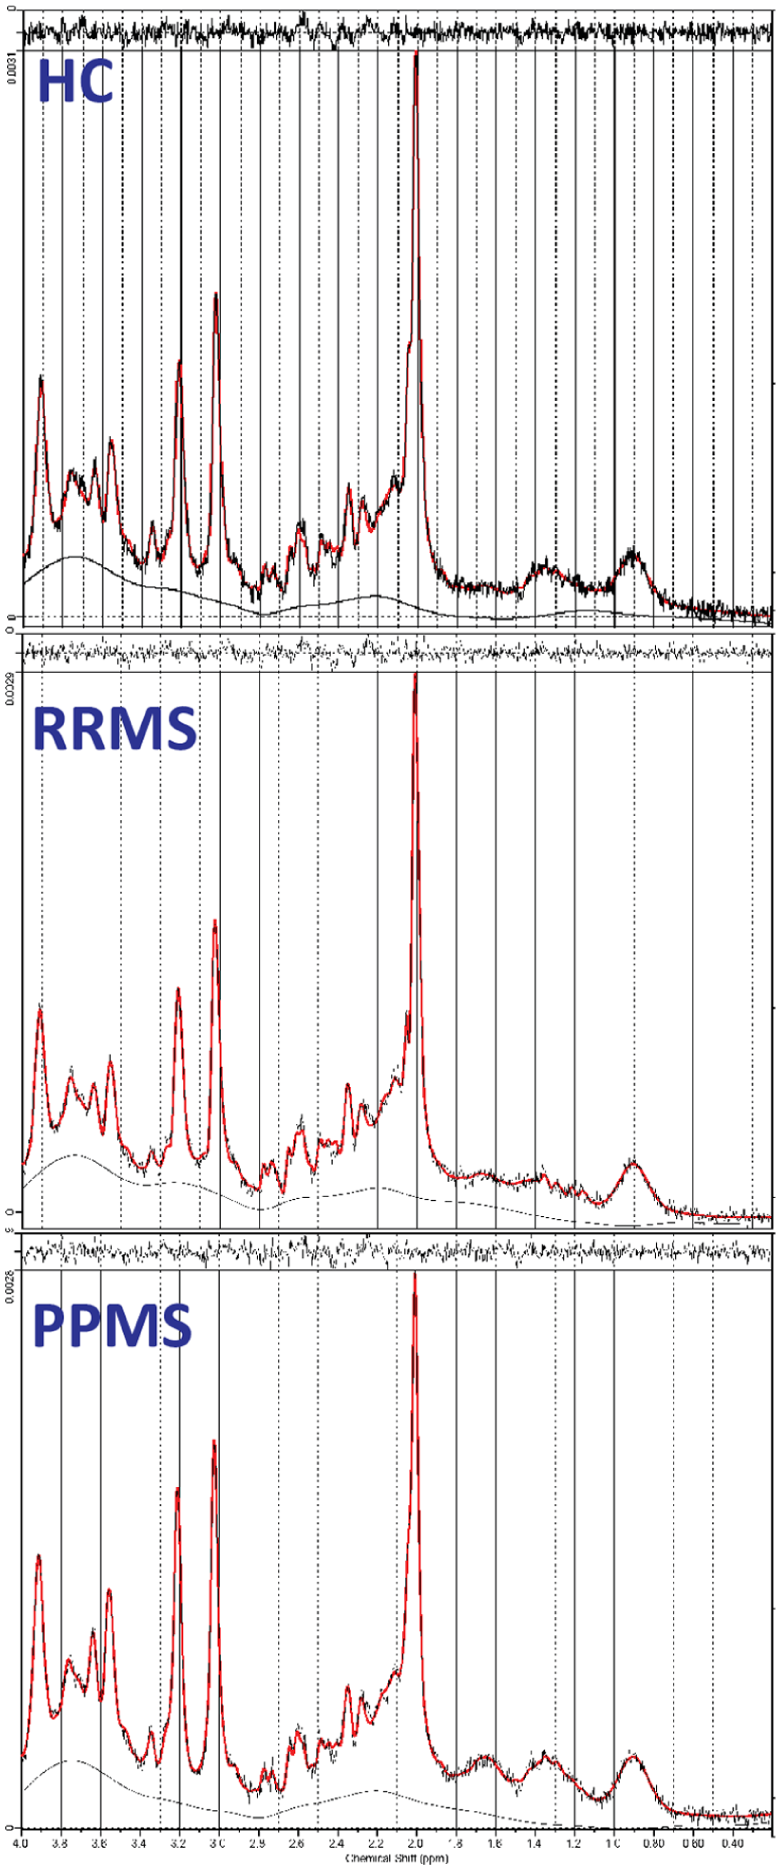
Example LCModel fits of spectra from a healthy control (HC) participant, a person with relapsing MS (RMS), and a person with primary progressive MS (PPMS).
Voxel fractions of GM, WM, CSF, and lesion did not change over time in any of the cohorts (see Supplemental Material).
Baseline metabolite levels
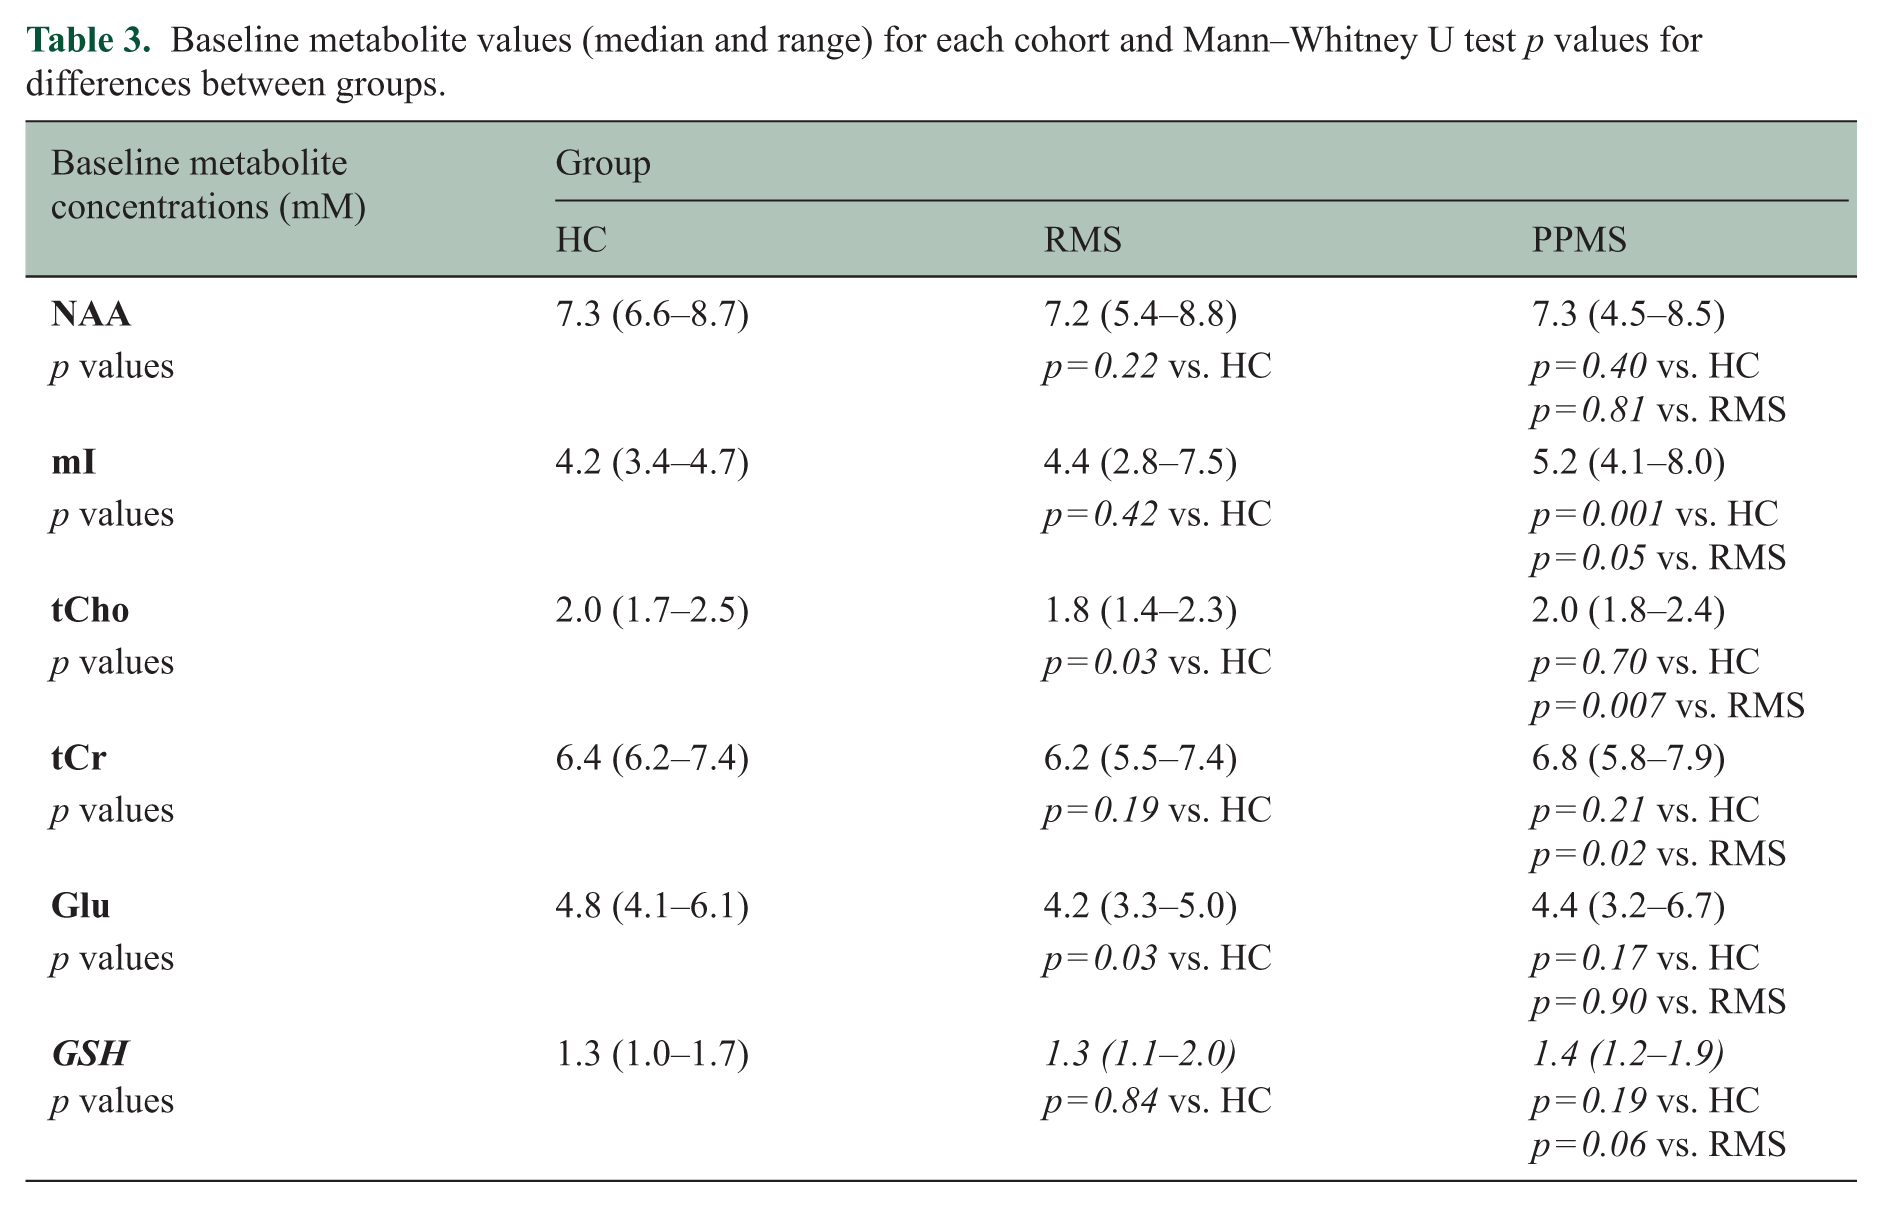
Baseline PPMS mI was 24% higher than HC and 18% higher than RMS. Baseline tCho values were 10% lower in the RMS cohort than both of the other two groups, and the tCr levels were 9% lower in the RMS than the PPMS group. NAA did not exhibit a difference between any groups, and neither did any other metabolites, as detailed in Table 3 and Figure 3.
Baseline metabolite values (median and range) for each cohort and Mann–Whitney U test p values for differences between groups.
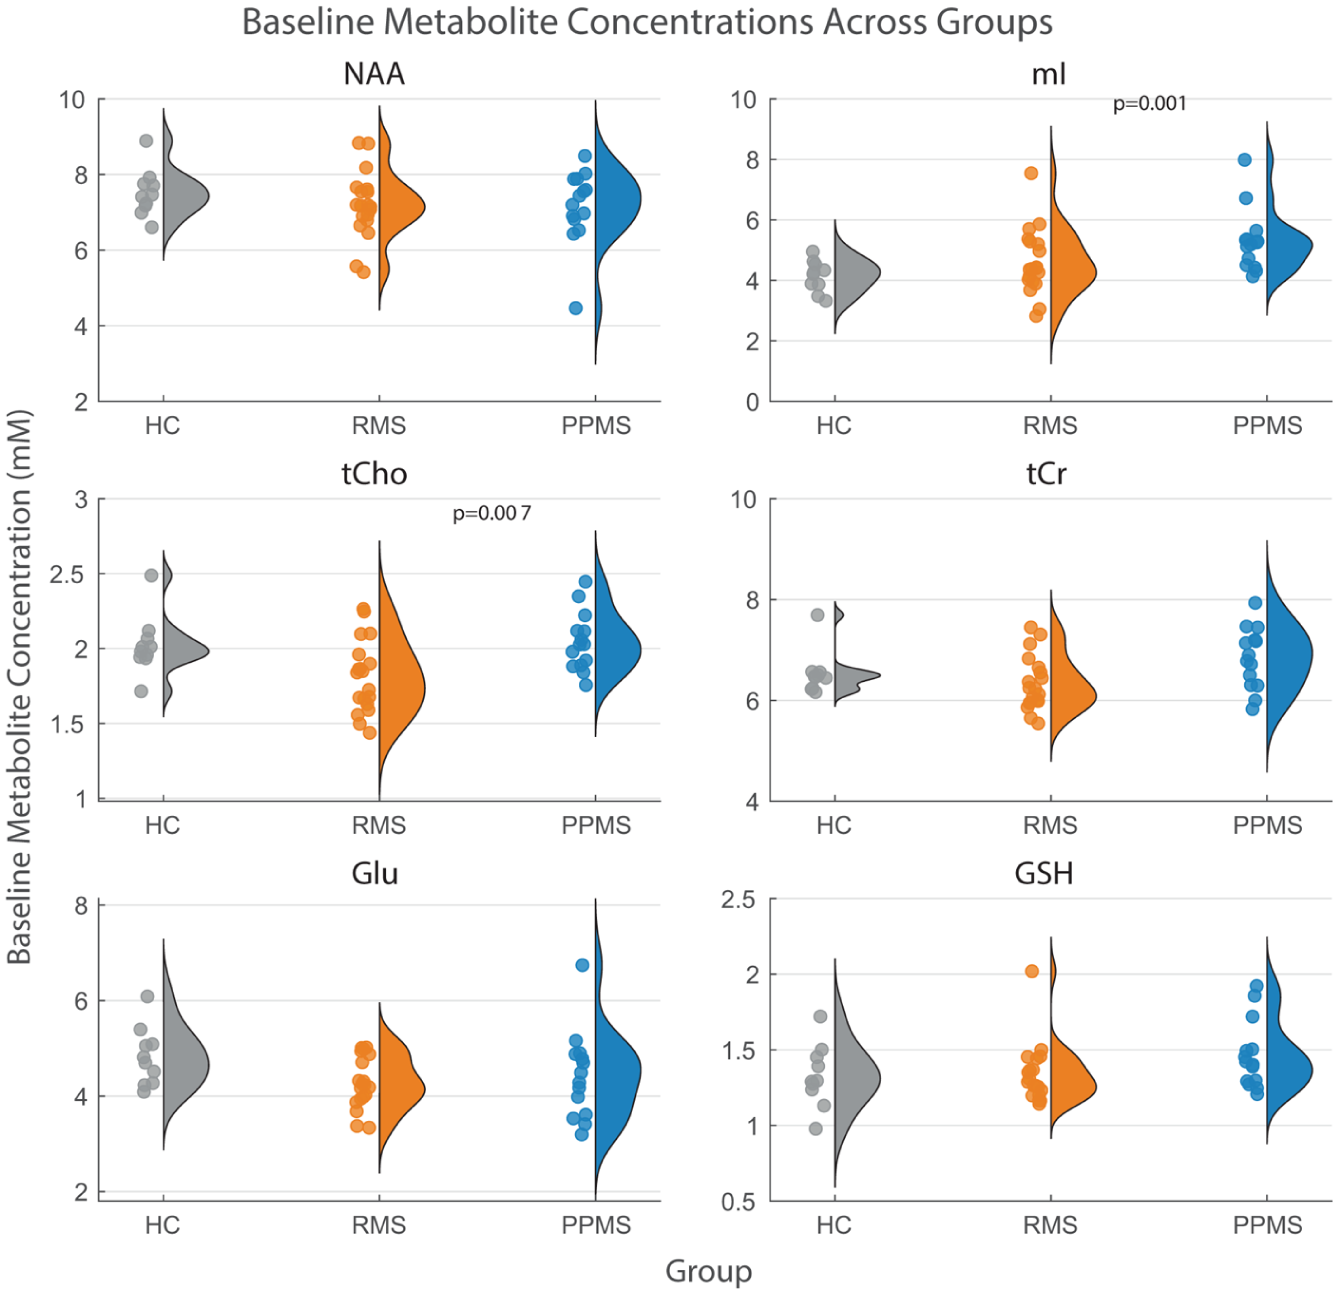
Baseline metabolite concentrations across healthy controls (HC), relapsing MS (RMS), and primary progressive MS (PPMS).
Baseline mI and tCho levels exhibited modest correlations with EDSS across the entire MS cohort (mI: r = 0.42, p = 0.014; tCho: r = 0.41, p = 0.017), as detailed in Table 4 and Figure 4. No correlations within either the RMS or PPMS cohorts between baseline metabolite values and EDSS survived the false discovery threshold procedure; at the same time, there was a trend toward a negative correlation between Glu and EDSS (r = −0.61, p = 0.020).
Summary of linear mixed-effects fit results for the primary and adjusted models.
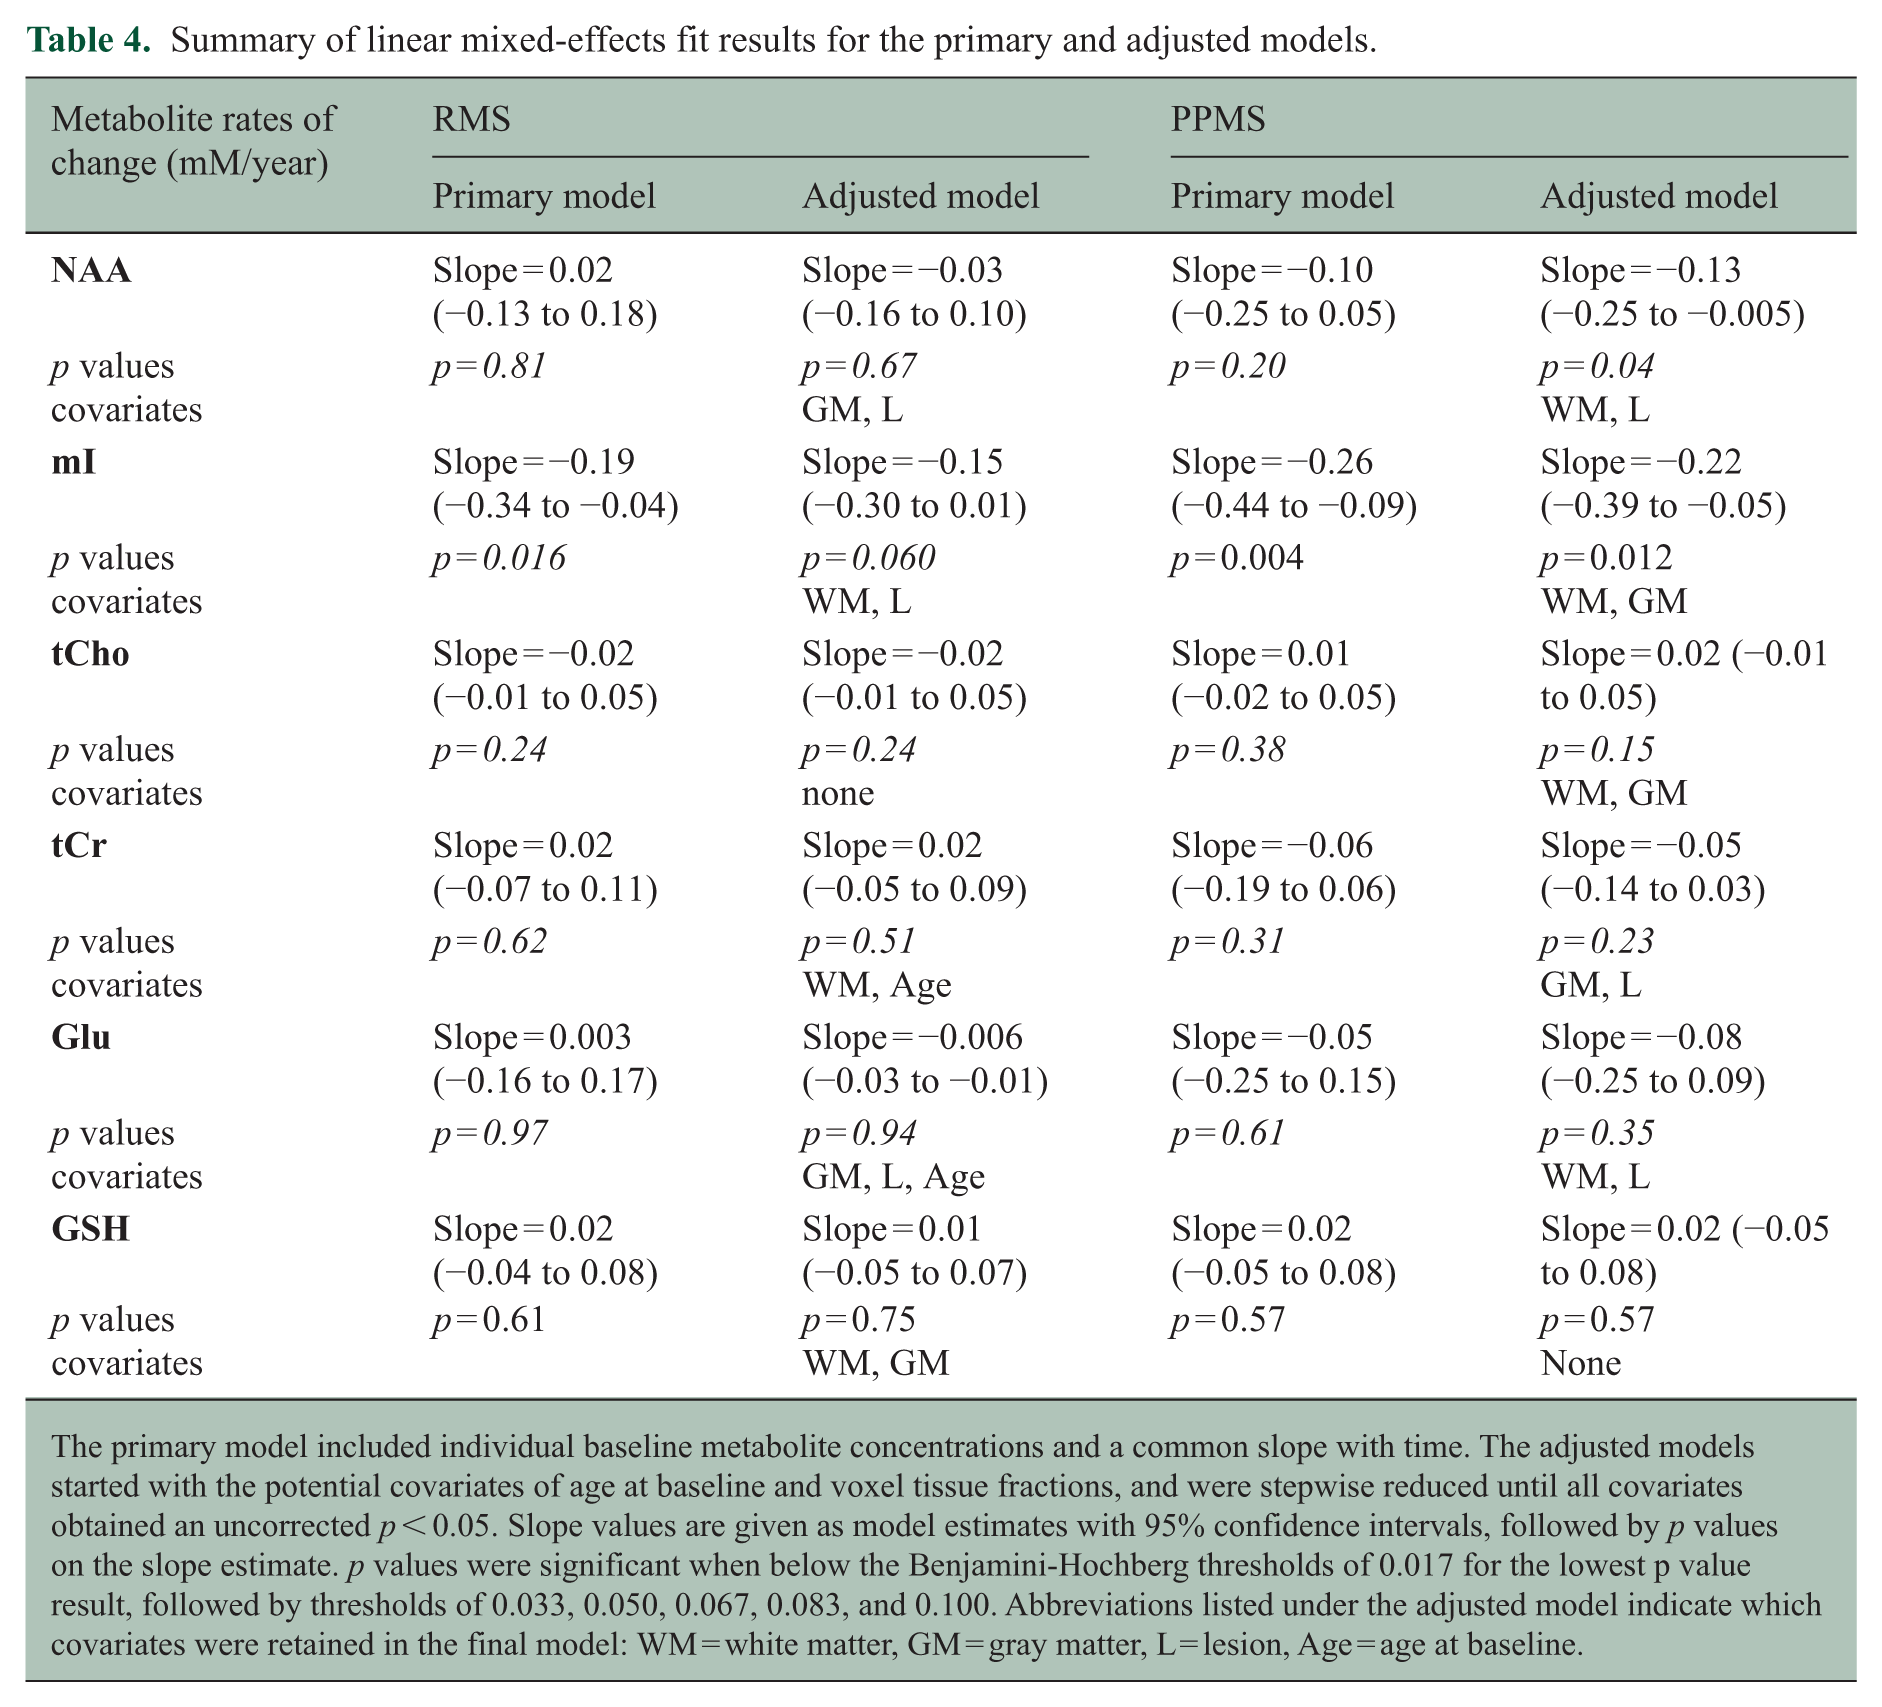
The primary model included individual baseline metabolite concentrations and a common slope with time. The adjusted models started with the potential covariates of age at baseline and voxel tissue fractions, and were stepwise reduced until all covariates obtained an uncorrected p < 0.05. Slope values are given as model estimates with 95% confidence intervals, followed by p values on the slope estimate. p values were significant when below the Benjamini-Hochberg thresholds of 0.017 for the lowest p value result, followed by thresholds of 0.033, 0.050, 0.067, 0.083, and 0.100. Abbreviations listed under the adjusted model indicate which covariates were retained in the final model: WM = white matter, GM = gray matter, L = lesion, Age = age at baseline.
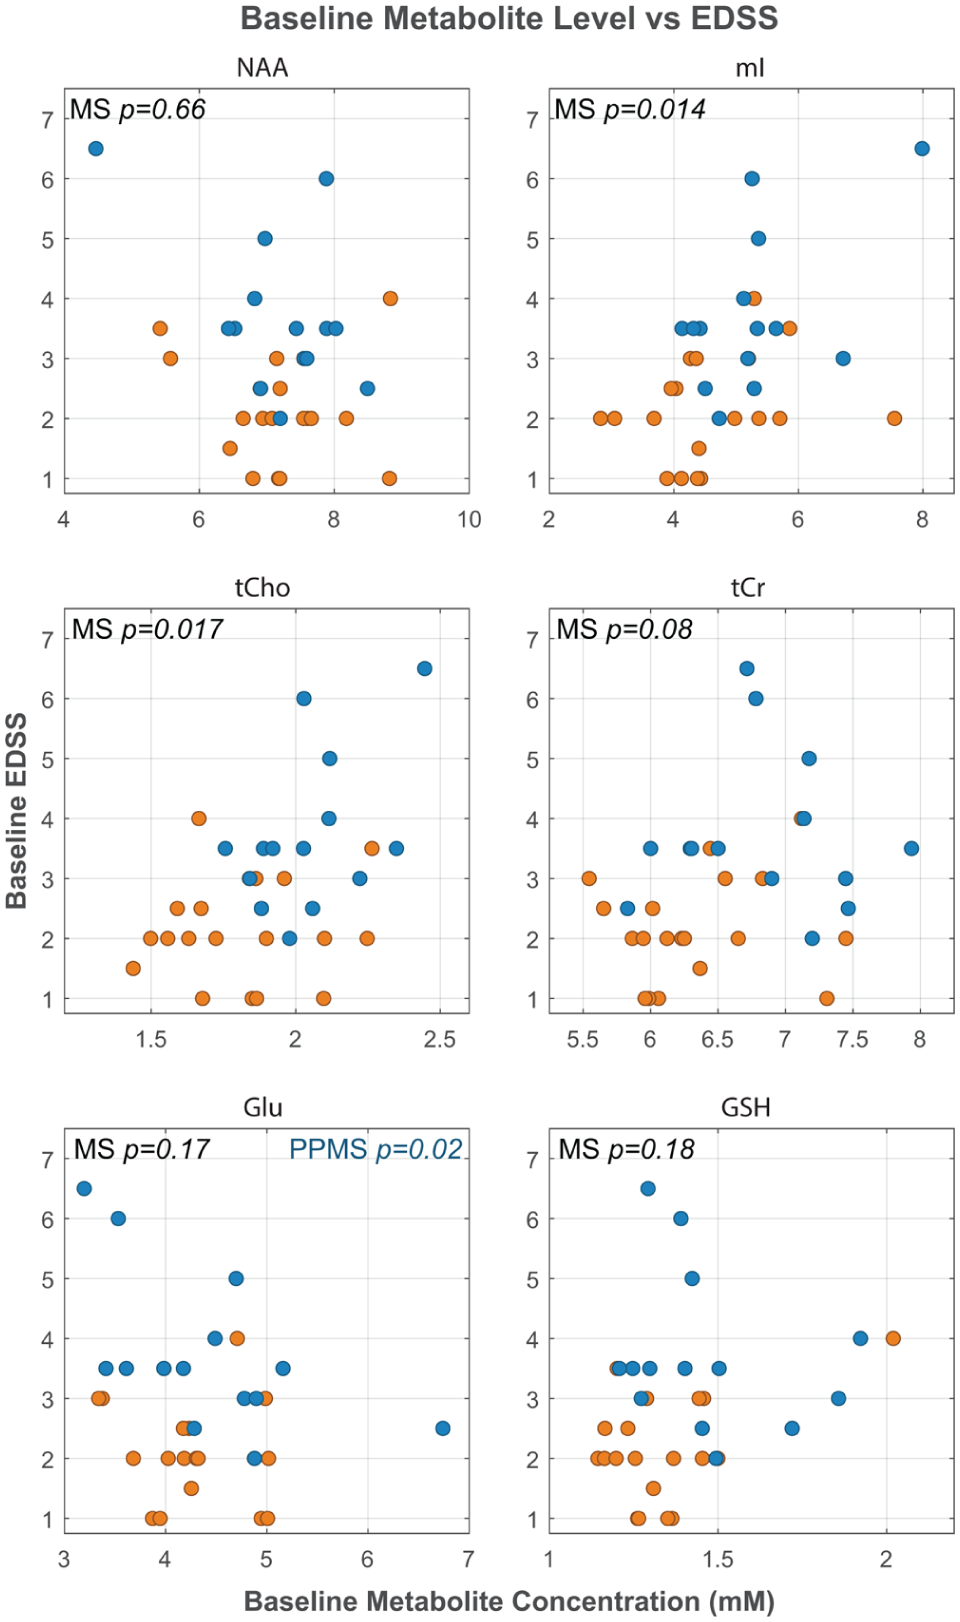
Relationship between baseline metabolite concentrations and the Expanded Disability Status Scale (EDSS).
Longitudinal metabolite changes
Both the RMS and PPMS groups exhibited a decrease in mI over the 2-year treatment period before taking into account potential covariates (Figure 5). The primary linear mixed-effects model estimated the annual rate of decline was −4.0% (−7.3 to −0.01%) for RMS (p = 0.016) and −5.0% (−8.5 to −1.7%) for PPMS (p = 0.004). At each participant’s final scan, 12/19 RMS and 12/14 PPMS participants’ mI levels were decreased relative to baseline. In addition, 6/7 RMS and 9/9 PPMS participants whose baseline mI values were higher than the 90th percentile of the HC levels exhibited a decrease over the treatment period. Other metabolites did not display trends with time over the treatment period (p > 0.20).
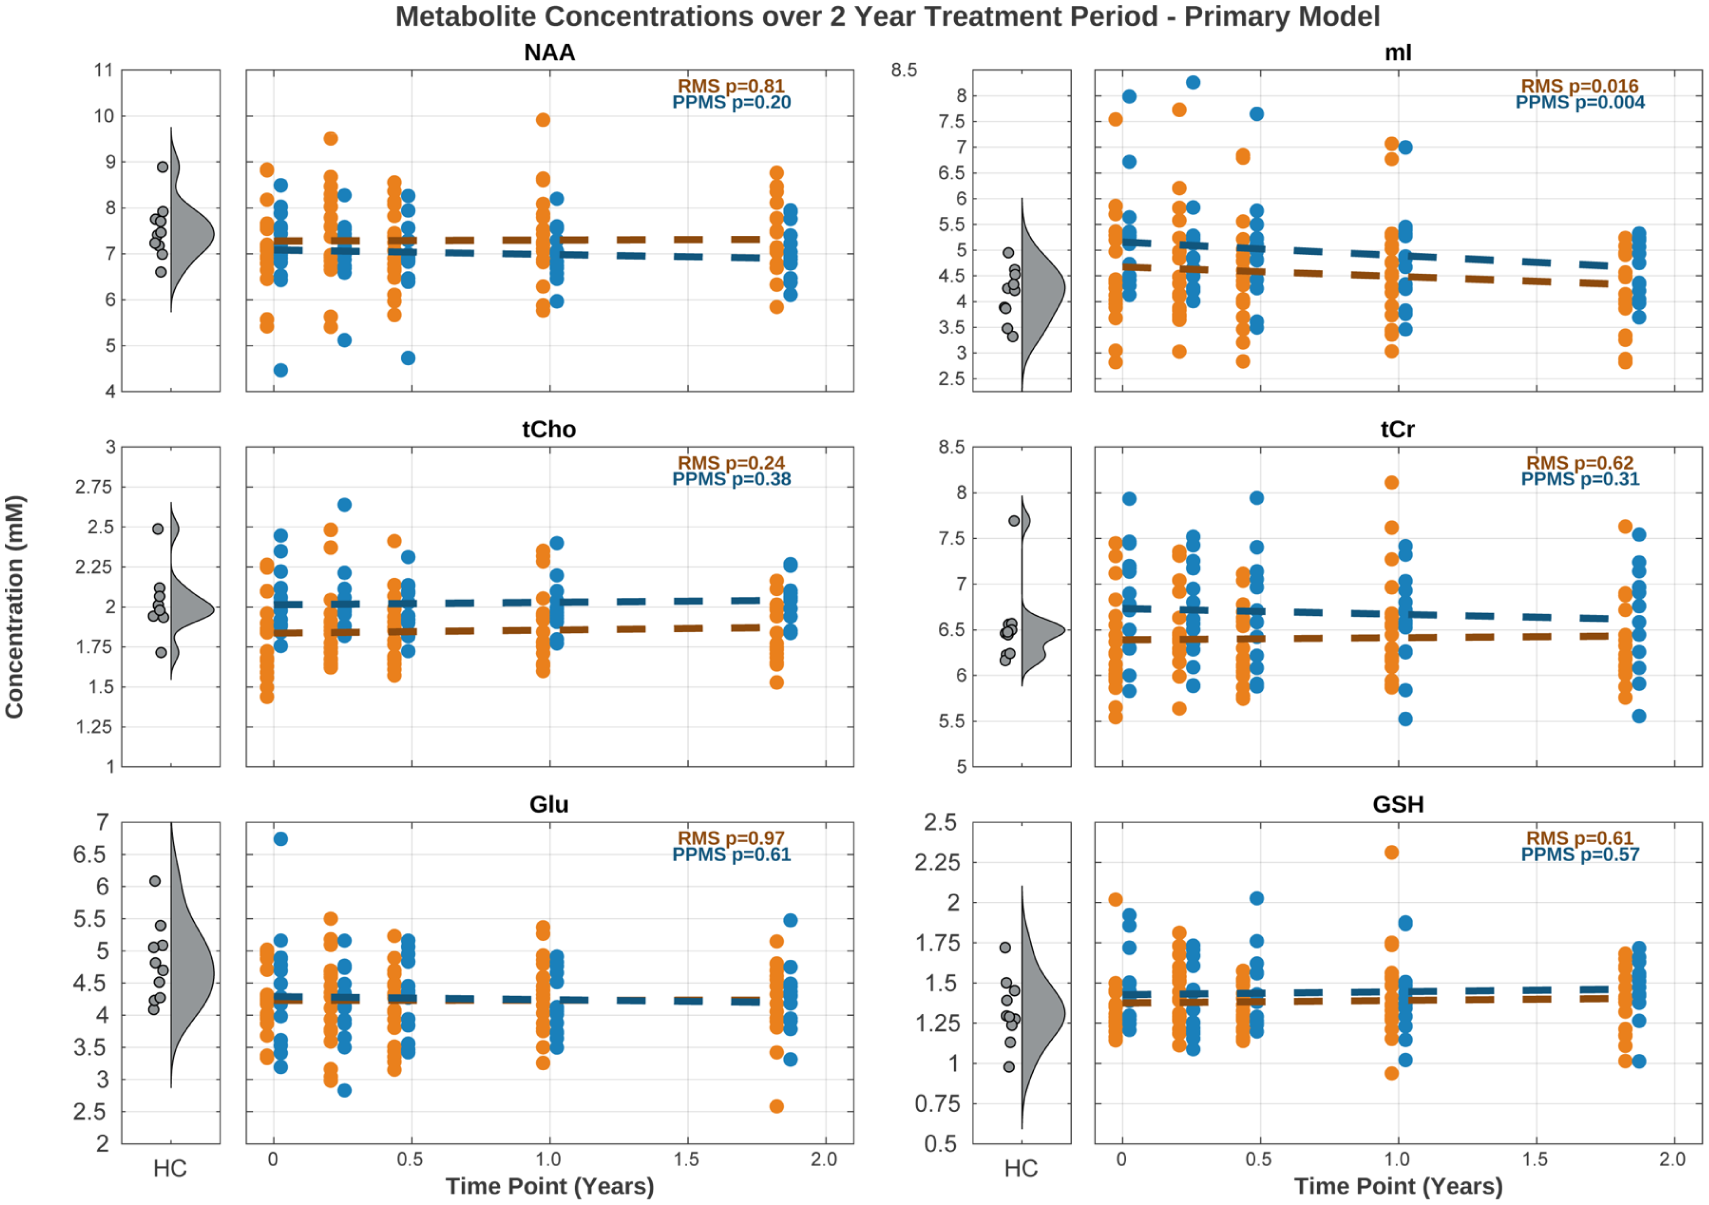
Metabolite concentrations over time in the RMS (orange) and PPMS (blue) participants.
Discussion
This study followed people with RMS and PPMS over 2 years of treatment with OCR and demonstrated declines in the MRS marker of neuroinflammation (mI) in the NAWM in both cohorts. This decline remained significant in the PPMS cohort after adjusting for age and voxel tissue fractions, and maintained a trend in the RMS cohort after adjusting for these covariates (Figure 6). The MRS voxel size and location used in this study were optimized to obtain a high-quality metric reflective of WM health. The decline in mI is in line with our previous study 6 and suggests that there is ongoing glial de-activation in people with MS treated with OCR.
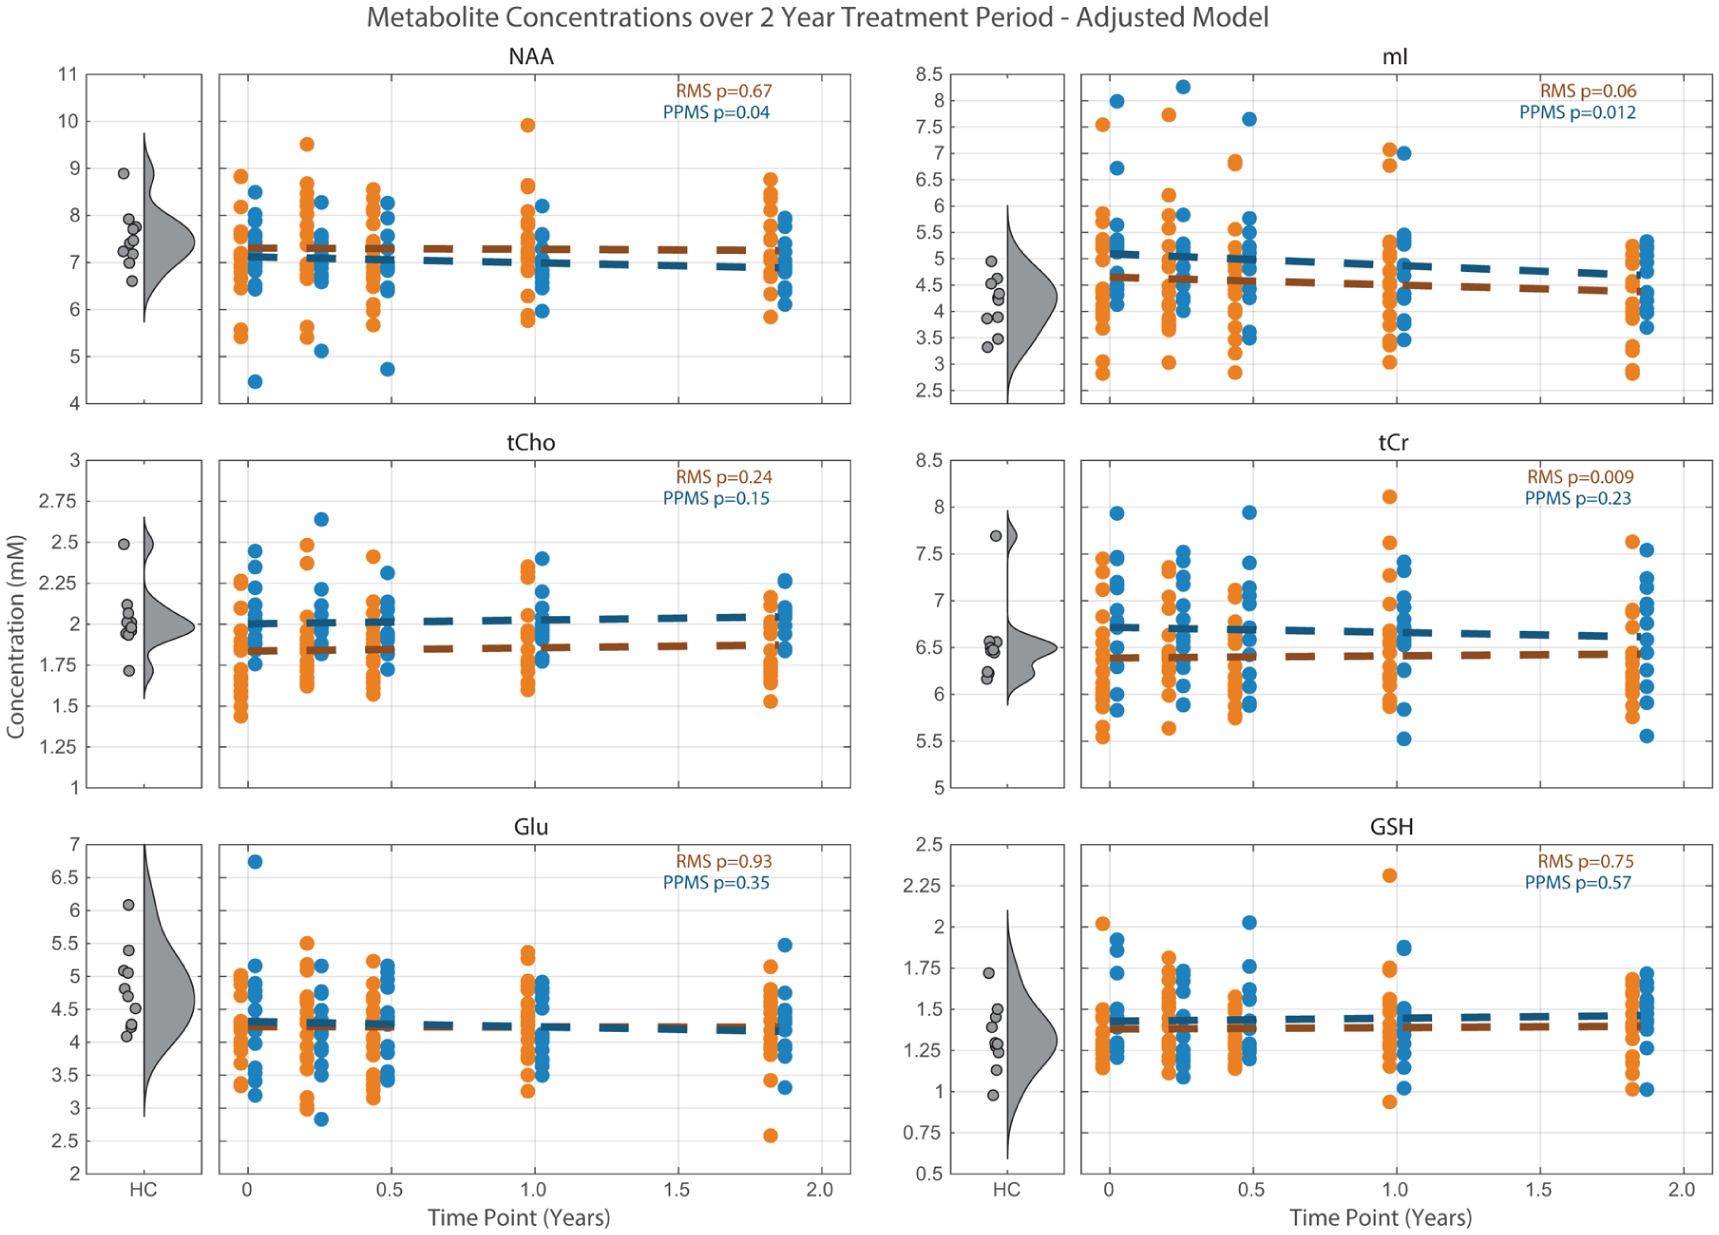
Adjusted linear effects model fit to metabolite concentrations over time.
Resolution of elevated mI
Myo-inositol is a component of phosphoglycerides used in building biomembranes and is an osmolyte that helps to maintain cell volume.18,19 mI is generally found to be more concentrated in glia than in neurons, so it is often interpreted as a glial cell marker, and elevated mI has been observed across a range of glial tumors 20 and subtypes of MS.21–23 Elevated mI may reflect increased membrane synthesis in proliferating glial cells in conjunction with an increase in cellular density of activated microglia. 20
MS participants recruited for this study were selected to have exhibited evidence of disease activity within the past year for RMS, and PPMS participants were recruited with moderate to high EDSS scores. Elevated mI levels were observed in the PPMS cohort, as compared to RMS and HC. Similar mI levels were found between RMS and HC, although there was a large variability in the RMS group. Our previous study of RMS patients treated with OCR in the OPERA II phase 3 study also found no difference in mI between RMS and HC. 6
Notably, there was a modest correlation between baseline mI and EDSS in this study, suggesting that higher levels of ongoing diffuse glial activity in the brain are accompanied by greater levels of disability. Furthermore, this relationship spanned both MS cohorts, suggesting that elevated mI was less related to MS subtype than it was to the level of disability. This relationship was not observed in the previous study, likely due to the very low EDSS scores in that RMS cohort (median: 2.0, range: 0.75–4.5) 6 as compared to this RMS cohort (median: 3.0, range: 1.0–6.5). One previous study using MR spectroscopic imaging at 7T and an EDSS range of 0–6.0 found a relationship between mI/NAA with EDSS, 24 while other studies with participants exhibiting low EDSS ranges25,26 or reporting mI relative to tCr 27 did not. The positive correlation between tCho and EDSS observed in this study also supports the relationship between ongoing diffuse glial activity and greater disability, since increased tCho is involved in increased cellular density. However, tCho is not cell-type specific, so need to be interpreted in the context of the observed changes in mI. Altogether, the positive relationships found here between mI and tCho with increasing EDSS across both MS cohorts may be supportive of the concept of diffuse ongoing “smouldering inflammation” across the disease spectrum,1,2 although we cannot completely rule out the potential contribution of acute inflammation, if any, for participants with recent focal disease activity.
A decline in mI over the 2-year treatment period was observed across both MS cohorts. The annual rate of decline was similar in the RMS cohort from this study −4.0% (−7.3 to −0.01%) and in the OCR-treated RMS group from our previous study (−3.2% (−6.6% to 0.2%), also with 19 patients treated with OCR. 6 The slightly more pronounced decline in mI reported here is potentially due to the increased voxel median NAWM content, from 68% to 80%. While not all MS participants exhibited mI levels higher than HC at baseline, those that did (6/7 RMS and 9/9 PPMS) were more likely to demonstrate a decline in mI. Those participants with mI levels closer to healthy concentrations at baseline may have less glial activation at baseline and, thus, less capacity for treatment-induced reduction. In addition, the lack of change in tCr and tCho levels in this study is also in agreement with our observations in the OCR-treated cohort of our previous study, 6 which may indicate that the cell populations in MS NAWM remained stable while the declining mI may reflect a decrease in microglial activation. This interpretation aligns well with a previous finding that anti-CD20 therapies for two different rat models of MS resulted in reduced microglial activation. 28 For comparison, in our previous study, the group treated with interferon beta-1a tended to exhibit an increase in both mI (3.2% (–0.36% to 6.8%)) and tCr (1.9% (–0.4% to 3.3%)) over 2 years of treatment, which suggested ongoing glial activation and proliferation in that cohort. 6
To our knowledge, this study marks the first time that a decline in mI over time or during treatment was observed in PPMS patients. The rate of decline over 2 years was slightly stronger in the PPMS group −5.0% (−8.5 to −1.7%) as compared to the RMS group −4.0% (−7.3% to 0.01%). This slightly stronger rate of decline may reflect that the PPMS group was experiencing more activated microglia at baseline that were available for de-activation during the treatment period. While this study showed that treatment with OCR led to declining mI in patients with both RMS and PPMS, the findings from phase III clinical trials show that OCR does not eliminate disability progression in either disease subtype. 29 The results of the multi-center OBOE study 9 indicate that CSF markers of microglial activation remain elevated in patients with RMS and PPMS. It remains to be seen whether treatments that target microglial activation are better able to prevent disability worsening as compared to OCR.
Stable neuron–oligodendrocyte coupling
N-acetylaspartate is synthesized in neurons and transported into oligodendrocytes to support myelin synthesis and is also an osmolyte and precursor for the neurotransmitter N-acetylaspartylglutamate. 18 A recent observation of higher NAA in oligodendrocytes and myelin as compared to within the neuron in adult mice suggests that supplying acetate for myelin synthesis is a primary role of NAA. 30 Thus, NAA levels measured by MRS are interpreted as markers of neuronal health and neuron–oligodendrocyte coupling. In this study, we found that NAA levels remained stable over time, which is consistent with our previous study in RMS treated with OCR over 2 years. 6 While the model adjusted for WM and lesion voxel fractions demonstrated a trend with time in the PPMS cohort, a larger sample size would be needed to confirm these interactions. Our group has also observed stable NAA over 2 years in relapsing–remitting MS treated with alemtuzumab over 2 years. 4 To our knowledge, only one previous study reported a change in the absolute concentration of NAA in MS patients on treatment over time, demonstrating an increase in NAWM NAA of 1.4% per year over 3 years. 31 Stable NAA over time suggests that the neuronal support for myelin synthesis remained constant during the treatment period. In addition, we did not observe any differences in baseline NAA concentration between either MS cohort and HC. A reduced absolute concentration of NAA in NAWM between MS and HC has been a consistent finding in the MRS literature,21,23,31,32 although our previous study and one other study also did not find a difference in NAWM NAA in MS patients treated with a disease modifying therapy.6,33
Impact of age and voxel tissue fractions as covariates
Metabolites are known to exhibit different concentrations in different tissue compartments, 34 so metabolite changes over time may be influenced by any changes in voxel tissue fractions. In this study, two participants exhibited large changes in voxel lesion fraction over time. One PPMS participant’s lesion fraction changed from 25.7% at baseline to 27.9%, 14.4%, and 17.5% at weeks 12, 24, and 52, respectively. One other PPMS participant had a baseline lesion fraction of 6.1%, which increased to 10.4% at week 12, and then decreased to 4.7% and 4.2% at weeks 24 and 52, respectively. The voxel lesion fraction was below 6% for all other measurements.
The potential covarying factors of age at baseline and voxel were investigated in the adjusted linear mixed-effects models (Figure 6). The surviving tissue covariates were different for each metabolite in each cohort. This lack of consistency likely arises from the small dynamic range of the voxel tissue fractions in this study due to the optimization of the voxel placement to maximize the fraction of NAWM. Studies that have revealed consistent metabolite trends with WM and GM values have analyzed spectra from voxels specifically targeted to each tissue type. 34
Study strengths and limitations
The design of this study minimized confounds and maximized the detection of metabolite changes over time by optimizing the protocol in several ways. The inclusion criteria for the RMS cohort were selected to ensure that participants exhibited disease activity at baseline. As well, the inclusion of HC data helped clarify whether changes in treatment were returning toward normal levels or not. In addition, five MRS scan sessions were collected over the 2-year treatment period to better characterize trends. Furthermore, the MRS region of interest was chosen to maximize NAWM within the voxel, with a large voxel size to obtain high SNR spectra, and the region of interest excited for water was shifted away from the ventricles to improve data quality. The success of this approach is evident from the fact that all MR spectra passed the thresholds of SNR and FWHM. Another strength of this study was the long TR of 4 seconds to minimize metabolite T1 weighting and allow for the calculation of absolute metabolite concentrations. 6 Reporting absolute metabolite concentrations increases the chances of detecting true changes over time by removing the confounding factor of a potentially varying metabolic denominator.
One limitation was the small sample size of only 19 RMS and 14 PPMS. However, the high retention rate across the study duration resulted in a total of 93 MRS measurements for RMS and 67 for PPMS. Future research can build upon these results by repeating a similar approach in larger sample sizes to understand generalizability. Furthermore, the MRS data in this study were acquired using PRESS for localization. The MRS community now recommends the localization sequence semi-Localization by Adiabatic Refocusing (semi-LASER) 35 for improved spatial congruence between metabolites and improved detection of J-coupled resonances, which might enable future studies to detect changes over time in glutamate, glutamine, and glutathione. In addition, future work would benefit from also imaging the spinal cord to provide a more complete characterization of disease pathology in PPMS.
Conclusion
The consistent declines in myo-inositol observed during treatment with OCR across both RMS and PPMS demonstrate the usefulness of the absolute concentration of mI as an additional outcome measure in longitudinal studies and clinical trials to detect resolution of activated microglia. In addition, the positive relationships between markers of neuroinflammation and increasing disability across both MS subtypes at baseline support the presence of diffuse “smouldering inflammation” as a disease process across the spectrum of MS.
Supplemental Material
sj-docx-1-msj-10.1177_13524585261456964 – Supplemental material for Longitudinal magnetic resonance spectroscopy study of metabolite changes over 2 years in relapsing and primary progressive multiple sclerosis treated with ocrelizumab
Supplemental material, sj-docx-1-msj-10.1177_13524585261456964 for Longitudinal magnetic resonance spectroscopy study of metabolite changes over 2 years in relapsing and primary progressive multiple sclerosis treated with ocrelizumab by Erin L MacMillan, Bretta Russell-Schulz, Glaynel Alejo, Christopher Harp, Briana Cameron, Ryan Winger, Sherman Jia, Ann Herman, Jasmyne Kassam, Michael Waine, Irene M Vavasour, Helen Cross, Roger Tam, Anthony L Traboulsee, Robert Carruthers and Shannon H Kolind in Multiple Sclerosis Journal
Footnotes
Acknowledgements
The authors would like to gratefully acknowledge support from the study participants, volunteers, staff at the UBC Hospital MS Clinic, and MRI technologists. This work was performed with the support of the UBC MRI Research Centre (RRID: SCR_025374), a core facility within the Department of Radiology in the Faculty of Medicine at the University of British Columbia, which was established with funding from the Canadian Foundation for Innovation.
Declaration of Conflicting Interests
The authors declared the following potential conflicts of interest with respect to the research, authorship, and/or publication of this article: Erin MacMillan received salary support from Philips Canada. Bretta Russell-Schulz, Glaynel Alejo, Irene Vavasour, and Roger Tam declared no potential conflicts of interest with respect to the research, authorship, and/or publication of this article. Christopher Harp, Briana Cameron, Ryan Winger, Sherman Jia, and Ann Herman are/were employed by F. Hoffmann-La Roche Ltd. during their work on this project. Anthony Traboulsee is the MS Canada Research Chair at UBC and has received grant funding from MS Canada, Consortium of MS Centers, Hilton Foundation, Roche, and Genzyme; honoraria from Roche, Genzyme, Biogen, EMD Serono, and Novartis. Robert Carruthers has received study funding from Roche, Genentech, Novartis, EMD Serono, Teva Innovation Canada, and Roche Canada and has received honoraria from Teva, Roche, EMD Serono, Sanofi, Biogen, and Novartis. Shannon Kolind has received study funding from Roche, Genzyme, and Biogen, and consulting fees from Roche and AbbVie.
Funding
The authors disclosed receipt of the following financial support for the research, authorship, and/or publication of this article: This OBOE clinical trial was funded by Genentech, a subsidiary of F. Hoffmann-La Roche Ltd. The MRS sub-study was an independent investigator-initiated study supported in part by Genentech and the UBC MSMRI Research Group (SHK, AT). SHK received support from Michael Smith Health Research BC.
Ethics approval and consent
The Clinical Research Ethics Board Committee at the University of British Columbia approved our MRI study (approval: H16-01199) on 7 November 2016 for MS participants, and (H19-03364) on 6 December 2019 for healthy controls. Participants gave written informed consent for review and signature before the first MRI scan.
Supplemental material
Supplemental material for this article is available online.
References
Supplementary Material
Please find the following supplemental material available below.
For Open Access articles published under a Creative Commons License, all supplemental material carries the same license as the article it is associated with.
For non-Open Access articles published, all supplemental material carries a non-exclusive license, and permission requests for re-use of supplemental material or any part of supplemental material shall be sent directly to the copyright owner as specified in the copyright notice associated with the article.