



Abstract
Political campaigns are much more attack-filled in some countries than in others. What accounts for it? One answer hinges on the country’s party system. We propose that two-party systems encourage more negativity than multiparty systems because parties in a multiparty system (1) must maintain good relationships with parties with which they may want to enter into coalition and (2) run the risk of supporters of the attacked party moving to support a third party. We test the relationship between party system and attack behaviour in New Zealand, which in 1996 changed from a single-member district, first-past-the-post system to a mixed-member proportional system. The result was a more fragmented party system, resulting in coalition and minority governments. Analysing over 250 adverts and party election broadcasts aired from 1969 to 2011, we find that advertising has become more positive since 1996, suggesting that party systems affect the tone of election campaigns.
Introduction
Negative campaigning, i.e. the practice of criticizing one’s opponent during the election campaign, is a global phenomenon, and yet there is substantial variation in the degree to which candidates and parties attack each other (e.g. Salmond, 2011; Kaid and Holtz-Bacha, 2006; Walter et al., 2013; Walter, 2013). Why are campaigns relatively amiable in some countries and rough-and-tumble in others? Some might chalk this up to political culture, and cultural factors probably do matter, but in this research we focus on an institutional explanation for variations in negativity, namely, the party system.
The way political parties compete during election campaigns can be expected to be affected by the characteristics of the party system in which they operate. Several studies have documented that negative campaigning in a multiparty system is different from what it is in a two-party system (e.g. Elmelund-Praestaeker, 2010; Hansen and Pedersen, 2008; Kaid and Holtz-Bacha, 2006; Walter and Van der Brug, 2013; Walter et al., 2013). Owing to the larger number of parties competing and the common need to form a coalition government in a multiparty system, the costs of negative campaigning are thought to be higher and the benefits lower compared to in a two-party system. Therefore, we expect the overall level of negative campaigning to be higher in the latter.
Very little research has compared levels of campaign negativity across countries. A few studies rely on a small number of countries and/or a few elections (Kaid and Holtz-Bacha, 2006; Salmond, 2011; Schweitzer, 2009; Walter, 2013; Walter et al., 2013) or use implicit comparisons with the United States (Elmelund-Praestekaer, 2010; Van Heerde-Hudson, 2011). Thus, it remains difficult to gain leverage on how the characteristics of the party system influence levels of negativity. In order to shed some light on this question, we take advantage of an institutional change that occurred in New Zealand in 1996 when a change in the country’s electoral system brought about a change in its party system (Wolinetz, 2006). The country abandoned its first-past-the-post (FPP) electoral system – which resulted in a classic two-party system with a single-party majoritarian government – and moved to a mixed-member proportional (MMP) electoral system, which led to a multiparty system with a practice of coalition and minority governments (Levine, 2004; Lundberg, 2012). We are thus able to compare levels of negativity both before and after the change, holding ‘other factors’ (such as political culture, the size of the electorate, the political system, etc.) relatively constant. We study the use of negative campaigning by examining the behaviour of political parties in 252 party election broadcasts aired in New Zealand parliamentary election campaigns between 1969 and 2011. We find that the party system is related to levels of negativity, with positive advertising more common in a multiparty system.
Our research on the relationship between the party system and campaign negativity is important for a few reasons. First, although we hesitate to argue that the party system ‘causes’ campaign negativity to rise or fall, we are able to provide better evidence speaking to that relationship than previous researchers who have examined single cases or only a limited number of countries. 1 Second, our research on the determinants of campaign negativity ventures beyond the United States, a country on which most of the research on campaign negativity has been conducted (exceptions include Borba, 2012; Curini and Martelli, 2010; DeNooy and Kleinnijenhuis, 2013; Desposato, 2008; Doron and On, 1983; Elmelund-Praestekaer, 2008, 2010; Hansen and Petersen, 2008; Holtz-Bacha, 2001; Russmann, 2012; Sigelman and Shiraev, 2002; Sullivan and Sapir, 2012; Van Heerde-Hudson, 2011; Walter et al., 2013; Walter and Van der Brug, 2013). Given that the US has a stable two-party system, scholars have not investigated how variations in the party system have affected negativity. Rather than examining the party system, most work focuses on how candidate and/or party characteristics and features of the campaign environment influence the level of negative campaigning, such as incumbent status, position in the polls, the competitiveness of the race and money spent. Finally, if campaign tone depends on electoral institutions and party systems, then the tone of the campaign can be influenced by changes in those institutions, should citizens and their governments desire such change.
The party system and negativity
What constitutes negative campaigning? In this study we define negative campaigning in line with scholars who have adopted a so-called directional definition, namely, any statement that criticizes the opponent (see Benoit, 1999; Buell and Sigelman, 2009; Geer, 2006; Lau and Pomper, 2004). We make use of this definition because it ensures the validity and reliability of our measures more than an evaluative definition does. What appears to be harsh – even mudslinging to one person – may not appear the same to the next person, and such definitions might even be time and context-dependent. We are aware, however, that this definition may miss the nuances of some political ads. For instance, the most famous ‘negative’ ad in the history of the United States, the ‘Daisy Girl’ ad employed by the Johnson campaign in the 1964 race for president, would be coded as a positive ad under the directional approach.
Scholars have suggested that the type of party system a country has is related to the degree of negative campaigning (Elmelund-Praestaeker, 2010; Hansen and Pedersen, 2008; Walter et al., 2013; Walter forthcoming). The general expectation is that campaigning in two-party systems is more negative than campaigning in multiparty systems. In a two-party system, the party that wins the election ends up in government. In a multiparty system, this is not necessarily the case, and even if the party ends up in government it generally must share power. The first argument, then, is that overly aggressive and negative campaigning might damage parties’ opportunities of governing together, thereby increasing the costs of negative campaigning (Andeweg and Irwin, 2009; Brants et al., 1982; Kaid and Holtz-Bacha, 2006; Sjöblom, 1968; Walter and Van der Brug, 2013). Indeed, Walter and Van der Brug (2013) find that in the Dutch multiparty system parties with the least ‘coalition potential’ are those most likely to attack other parties.
A second reason we might find negative campaigning less common in a multiparty system than in a two-party system hinges on the multitude of parties competing in a multiparty setting. As the number of parties increases, it is less likely that the attacker will benefit from an attack (Elmelund-Praestekaer, 2010; Hansen and Pedersen, 2008; Walter and Van der Brug, 2013). Negative campaigning is used by parties to affect the voter’s decision calculus. As a result of negative campaigning, a voter’s expected utility for voting for the attacked party may decline, but that may not result in an increase in the expected utility for the party doing the attacking. Think of it this way: If Party A attacks Party B, support for Party B may decline, but instead of those voters turning to Party A, they may decide to support Party C or Party D. This is likely because some voters prefer or ‘identify’ with more than one party (Schmitt, 2002; Tillie, 1995; Van der Eijk and Niemöller, 1983). In particular, this is the case in multiparty systems, where it is likely that there are a number of fairly ideologically similar parties competing (Tillie, 1995; Van der Eijk and Niemöller, 1983). It is argued that voters have a choice set of preferred parties from which they choose at every election (Tillie, 1995). After the utility for the first preferred party is lowered, these voters are likely to vote for another party in their choice set. This means that the benefits a party can expect from negative campaigning are typically lower in a multiparty system than in a two-party system.
Salmond (2011) makes a similar argument but takes it back a step, focusing on the electoral system instead of the party system. He suggests that countries with proportional representation (PR) (which generally coincide with a multiparty system) have less negative campaigning than countries with winner-take-all, single-member district systems (which generally coincide with a two-party system). He supports this statement with two arguments. The first is similar, namely, that PR systems usually result in no majority government, which means ‘today’s enemy is … likely to be tomorrow’s ally’ (Salmond, 2011: 12). His second argument is different and has to do with efficiency. Namely, Salmond (2011) proposes that the fewer the parties, the fewer opponents one needs to disqualify. An example may help to clarify: in a system with two parties, your choice is either to promote yourself or attack the opponent, but whichever path you choose, you can do so using a single message. But in a system with multiple parties, the choice is to promote yourself or to attack party A, party B and party C – or at the very least that subset of parties that is ideologically proximate. Given a limited number of messages that one can send – and the electorate can comprehend – it is most efficient in this situation to promote oneself. In sum, there are good reasons for believing that moving from a two-party to a multiparty system leads to a more positive campaign overall. We formulate the following hypothesis:
There are not many empirical findings regarding the relationship between the party system and campaign tone, but the evidence suggests that more parties and the presence of coalition or minority governments lead to less negativity. Salmond’s (2011) analysis of YouTube videos of 72 parties aired in 13 elections in 13 countries confirms the general idea that the electoral system matters. He finds that district magnitude (the number of candidates sent to the legislature from an electoral district) is negatively related to attack behaviour. We would expect more parties to be competing in districts with higher magnitude, but obviously Salmond’s analysis is not a direct test of the effect of the number of parties. Walter, Van der Brug and Van Praag (2013) examine which kinds of parties resort to negative campaigning in 23 elections in three countries: The Netherlands, Britain and Germany. They find higher levels of negativity in the British two-party system than in the German and Dutch multiparty systems, which suggests that the context of the party system indeed matters for the use of negative campaigning. In a different study, Elmelund-Praestekaer (2010) compares levels of negativity in the multiparty Danish system with levels of negativity in the two-party American system, finding much more negativity in the United States. This analysis, however, does not control for all of the other differences between the two countries, and thus any causal linkage here is only speculative.
Of course, there may be other factors that drive campaign tone, and some suggest that there is a trend of increasing campaign negativity over time. There is some support for this idea in the United States (Benoit, 1999; Fowler and Ridout, 2010; Geer, 2006), but there is also evidence against it (Buell and Sigelman, 2008; Lau and Pomper, 2004). And the evidence from outside the United States points to no consistent trend in the tone of campaigning. For instance, Walter (2013) finds no evidence of increasing campaign negativity in three Western European countries (Netherlands, Great Britain and Germany); Elmelund-Praestekaer and Svensson (2014) find no changes in the tone of campaigns in Denmark over time; and similar results were obtained by Van Heerde-Hudson (2011) for Great Britain, Holtz-Bacha (2001) for Germany and Esaiasson and Hakansson (2002) for Sweden. It seems that, in general, campaign negativity ebbs and flows over time, responding to system-level factors and the characteristics of both the party system and the parties (Elmelund-Praestekaer and Svensson, 2014; Walter, Van der Brug and Van Pragge, 2013). In sum, there has been no consistent trend in levels of campaign negativity, with the possible exception of the United States.
In this research, we argue for the importance of examining the party system in explaining the degree of negativity during election campaigns. In particular, we focus on the structure of competition for government. Having said that, we acknowledge that the electoral system and party system are not perfectly related. There are exceptions to Duverger’s law, which states that single-member district plurality electoral systems tend to result in two-party systems and that double-ballot majority electoral systems and PR electoral systems tend to result in multiparty systems. Moreover, whether the electoral system always causally precedes the party system is a matter for debate (Benoit, 2007), and there are also many other factors that can cause party system change (Mair, 1997). Still, in the case of New Zealand the introduction of a new electoral system very clearly led to party system change (Wolinetz, 2006).
Campaigning in New Zealand
New Zealand is a parliamentary democracy in which parliamentary elections are generally held every three years, the most recent of which occurred in November 2011. The formal campaign period is short, about one month. Campaigning takes many forms, including radio advertising, television commercials, newspaper advertisements and party election broadcasts. Since 1938, there have been political broadcasts on the radio (Stewart, 2006), while the first televised political advertisements in New Zealand were aired in 1963. Parties are eligible for free airtime for both an opening statement at the beginning of a campaign and a closing statement at the end. The amount of free time the party qualifies for depends on its strength, which is measured by votes garnered in the past, seats in parliament and public opinion polls, among other factors. 2 Parties are also allocated public funding to promote themselves, and parties typically use some of this money to purchase 15 or 30-second political commercials like those seen in Australia, Canada or the United States.
New Zealand offers an excellent test case for the hypothesis that negativity is greater in two-party than in multiparty systems because, through the 1993 elections, New Zealand had an almost ideal two-party system. Members of parliament were elected first-past-the-post in single-member districts. By the second half of the 20th century, New Zealand had developed strong two-party competition between the Labour Party on the left and the National Party on the right, which resulted in majorities in parliament and strong cabinet governments (White, 2005). But in a 1993 referendum, the people voted to end the ‘Blitzkrieg politics and sweeping across-the-board changes to their way of life’ (Levine et al., 2007: 445). In place of the old system, the people instituted a MMP electoral system based on the German electoral system. This system, which was in place for the 1996 parliamentary elections, allowed people to cast a vote for both a member of parliament for their own electoral district and a vote for a party. 3
The change in the electoral system had an immediate impact on the party system. First, the disproportionality between the number of votes a party obtained and the number of seats it was awarded dropped dramatically (Levine et al., 2007). No longer did the major parties receive a substantially higher proportion of the seats than votes cast for them. Second, the effective number of parties in parliament (essentially, the number of parties weighted by their number of seats in parliament) increased (Levine et al., 2007). This is shown in Table 1 for all New Zealand parliaments between 1946 and 2011. The effective number of parties rose from just around two to almost four in 1996 before declining in subsequent elections.
Effective number of parties in parliament.
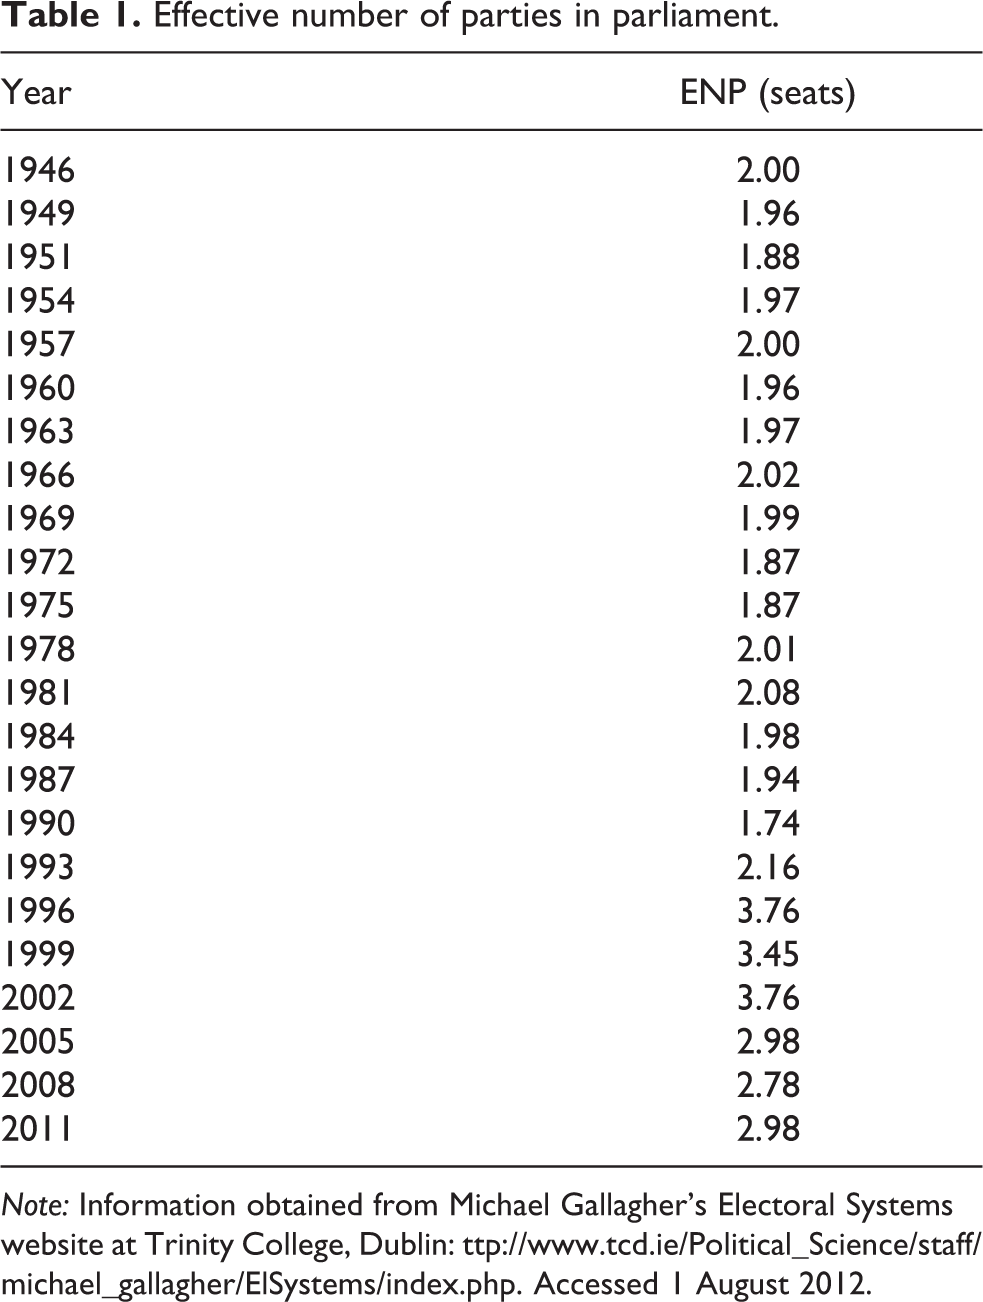
Note: Information obtained from Michael Gallagher’s Electoral Systems website at Trinity College, Dublin: http://www.tcd.ie/Political_Science/staff/michael_gallagher/ElSystems/index.php. Accessed 1 August 2012.
What is more, the ways in which the parties interacted with each other changed. For the years prior to 1996, New Zealand could be classified as having a party system with a completely closed structure of party competition, as the Labour Party and National Party alternated in government. After the introduction of MMP, the structure of competition for government became more open. New Zealand now has a party system where smaller parties have been needed by Labour and National to form coalition or minority governments. As various small parties have been involved, governing formulas have been various since 1996. 4 In addition, the practice of wholesale alternation of government is becoming less frequent.
Indeed, this latter change may have been the most important because, as Mair (1997, 2006) argues, the essence of a party system is not the number of parties but the principal modes of interaction between parties and the way in which they compete (Mair, 1996, 2006). Mair states that the core of any party system is the structure of competition for control of the executive, and thus defining a party system begins with an understanding of how governmental power is contested. As a result, one can speak of party system change when there is a change in the structure of competition (Mair, 1996, 2006). This can be the result of ideological, strategic or electoral shifts (Mair, 1996).
In sum, the change in electoral law in New Zealand did not only affect the number of parties competing. The practice of single majoritarian governments was also traded for one of coalition and minority governments (Levine, 2004; Lundberg, 2012). Thus, New Zealand fits Mair’s notion of party system change (1996, 2006) as the structure of party competition has changed (Wolinetz, 2006).
New Zealand’s change from single-member-district, first-past-the-post to MMP – and its impact on the party system – has been used by several scholars to analyse the impact of electoral and party system change on outcomes such as citizen efficacy (Banducci et al., 1999), voter turnout (Bowler and Donovan, 2012) and the gender gap in political involvement (Kittilson and Schwindt-Bayer, 2011). There is, however, a danger in interpreting these relationships causally because there may have been other changes that were more causally important that coincided with the switch to MMP. Offhand, this seems unlikely given the stability of New Zealand’s democracy and the lack of evidence that the tone of campaigns generally is changing over time.
Data and methods
To examine the relationship between the party system and attack behaviour, we rely upon an extensive database of party election broadcasts and television commercials aired in parliamentary election campaigns in New Zealand between 1969 and 2011. 5 We measure the level of negative campaigning on the basis of party election broadcasts, as party election broadcasts are completely controlled and officially approved by the party leadership and are therefore a direct measure of party behaviour. The collection includes 252 ads aired by parties that were obtained from a variety of sources, including the New Zealand Film Archive in Wellington, the Chapman Archive at the University of Auckland, a private collection and YouTube (See Appendix). 6 An attempt was made to access all party-sponsored ads ever aired on television during parliamentary election campaigns, 7 but our collection is likely not exhaustive of all television commercials and party election broadcasts created and aired. This could create inference problems if the missingness were systematic, e.g. we were more likely to collect negative ads in some years than in other years. Although it is plausible that more controversial ads – and thus ads more likely to be negative – are more likely still to survive in archives, we do not believe that was the case here. First, we obtained many of the ads from more recent years from multiple sources, suggesting that we had reached the point of saturation, i.e. there are just not many ads still to be found. Second, we were assured by a curator of the Chapman Archive that the archivists were quite diligent in collecting all party election broadcasts from 1987 to 1999. Third, the data in the appendix on the parties for which we have no ad data in each year suggest that most of the parties for which we had no advertisements were small ones that would not have qualified for much free air time and would have lacked the resources to pay for their own advertising. Given the large size of our collection, the tone of the ads represented in our sample prior to and after 1996 should not be dramatically different from the tone of the ads produced and aired. But because we do not have numbers on how often, when and where each ad was aired, we are unable to conduct frequency-weighted or rate-weighted analyses, as is sometimes done in studies on negative campaigning in the US (see Prior, 2001).
Each of the ads in our collection was transcribed to allow for coding, which was similar to the procedure of Geer (2006). The unit of analysis was the appeal, which we defined as any statement that praises or criticizes a candidate, party, cluster of candidates/parties or the status quo. 8 We did not code general statements of fact (neutral appeals) that neither praised nor criticized a political object. We focused on the appeal as the unit of analysis because the appeal is a natural speaking-unit, and doing so allows us to account for the fact that ads often contain both positive and negative messages. Moreover, this method has proven to be reliable (Benoit et al., 2003; Geer, 2006; Walter, 2013). For each of the 2,293 appeals in our dataset, we determined whether it was a trait, issue or value appeal, and we coded each appeal as either negative (it criticizes an opponent) or positive (self-praise of the party or politician). 9 For instance, we coded as positive this statement from a 2002 ad: ‘National will put 500 more police on the street.’ We coded as negative this charge from Labour in a 2011 ad: ‘Since National became government, 100,000 Kiwis moved to Australia.’
Seventy-two percent of the appeals were positive, while 28 percent were negative. Though by and large positive, our data do indicate that negativity is not rare in New Zealand, a point emphasized in Salmond’s (2010) analysis of television commercials and YouTube videos posted by the parties during the 2008 campaign. That study found there were far more negative ads than positive ads (both online and offline) during that campaign. Salmond’s data do not, however, provide a straightforward comparison to our data, as Salmond’s unit of analysis is the entire ad, not the statement.
Data Analysis Plan. We aggregate our dataset to the party-election broadcast level. 10 This transformation turns our dichotomous dependent variable into a continuous variable, which measures the percentage of statements in each ad that were negative. The 252 party election broadcasts are nested in the 29 different parties competing, and these are nested in the 13 election campaigns studied. Because some parties did not compete in some years, the result is 76 party-year observations. 11 Because we must take into account the dependence of observations, we estimate a regression model with White’s heteroskedastic standard errors clustered on party-year combinations, thereby correcting for the non-independence of data in parties and elections. We do not correct for the grouping of data in elections by entering election dummies in the model as this would withdraw all time variation, which is the main focus of this study. Given the hierarchical data structure and our limited sample size at the highest level of analysis, the chosen method is appropriate. Nevertheless, the choice to aggregate the data to the party election broadcast level comes at the cost of decreasing our number of observations from 2,293 statements to 252 ads. This decreases the power of our test and increases the likelihood of type-two errors.
Variables. To test the impact of the party system on negativity, we not only examine changes in levels of negativity over time, we also control for party characteristics that might influence negative campaigning. The first set of variables is prominent in both US and European literature on negative campaigning.
The first variable is Government or Support Party Status, whether the party is part of the government, or a party supporting the government, prior to the election (0 = No; 1 = Yes). This is in line with the work of Elmelund-Praestaeker (2008, 2010) on negative campaigning in Denmark. The opposition parties serve as the reference category. The second variable is Loss in Support, whether the party is gaining or losing support, which we measure as the difference between a party’s percentage of the vote in the previous election and in the current election. 12 Parties whose support had declined were coded 1, while those whose support had stayed the same or increased were coded 0.
The second set of variables stems from the European literature on negative campaigning in a multiparty system, and they measure the concept of coalition potential (for the logic behind this, see Walter et al., 2013 ; Walter, 2012). Our third variable, Party Size, is measured by the percentage of seats the party held in the previous parliament. We also measure coalition potential through Median Party Distance, which is a party’s ideological distance from the median party. These numbers were the expert-rated positions of the parties in the Parliament and Government Composition Database. 13 We took the average for each party and then calculated the absolute distance between the average party placement and the median party’s placement. Unfortunately, we do not have this measure for all political parties, 14 and thus our sample size is reduced in our models that include this variable. Another indicator of coalition potential is the variable Government Experience. We measure government experience as whether the party has been part of one of the last three governments, either in formal coalition or through a confidence and supply agreement (0 = No; 1 = Yes), excluding the National and Labour parties, as these parties form coalitions rather than being seen as potential coalition partners. 15 Finally, our models include an indicator of whether the election is taking place after the implementation of MMP, named Post1996 (0 = No; 1 = Yes).
Results
Is there a relationship between the party system and parties’ use of attack behaviour in an election campaign? First, we look at the overall level of negative campaigning, using the ad as the unit of analysis. Table 2 shows us the average percentage of negative statements in each ad in each year, along with the number of ads made in each year. Offhand, it appears that negativity was a bit higher before 1996. Over 40 percent of the statements in the average ad in the 1970s and early 1980s were negative, whereas that percentage has been in the teens in three of the four most recent elections. In New Zealand, we do not see an upward trend in negativity as observed in studies of US elections.
Negativity by year.
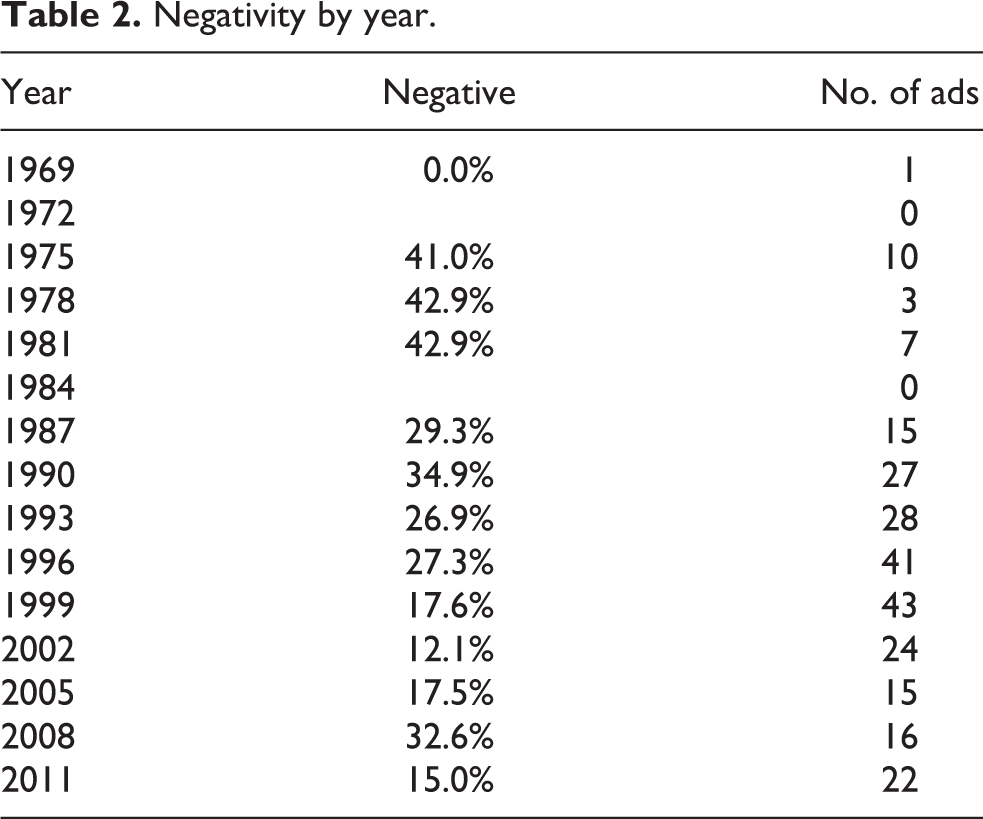
Looking more closely at the raw percentages, we see that the average level of negativity in each ad was 32.7 percent before 1996 compared to 20.4 percent from 1996 to 2011, a significant difference at the 0.005 level. This very basic measure, then, supports our contention that negativity should be higher under two-party than under multi-party competition.
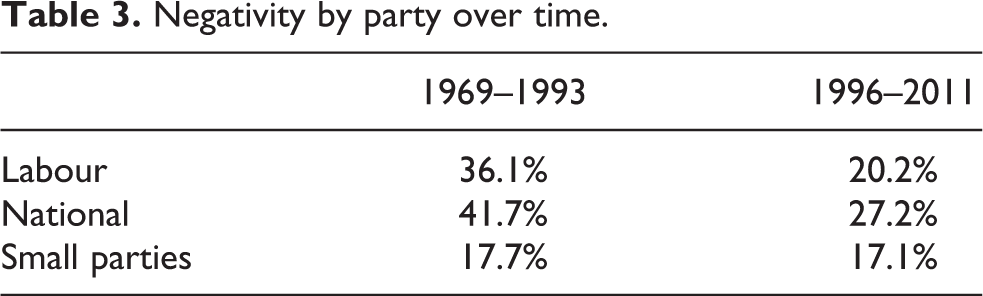
This relationship holds even when breaking the analysis down by party, as Table 3 shows. Statements made by Labour, National and the smaller parties are all less negative in the 1996–2011 period than in the period before MMP, though the decline is small for the smaller parties.
Negativity by party over time.
But do these associations hold up when we control for other factors? To examine this, we turn to these estimates from our regression models, which are displayed in Table 4. Recall that the standard errors reflect clustering on the party-year. Model 1, in which only the post-1996 indicator variable has been included as a predictor, shows a significant negative effect, indicating that it is indeed the case that from 1996 onwards party election broadcasts contained less negative campaigning. Model 2 estimates this relationship with the first set of variables. We find again a significant effect for the variable Post1996. The variable Loss in Support runs in the expected direction, i.e. parties that are losing support are more likely to resort to negative campaigning, and this effect is statistically significant. Given the existing literature, somewhat surprising was our finding that government and support parties are neither more nor less likely to go negative than other parties.
The effects of the party system change and party characteristics on negative campaigning.
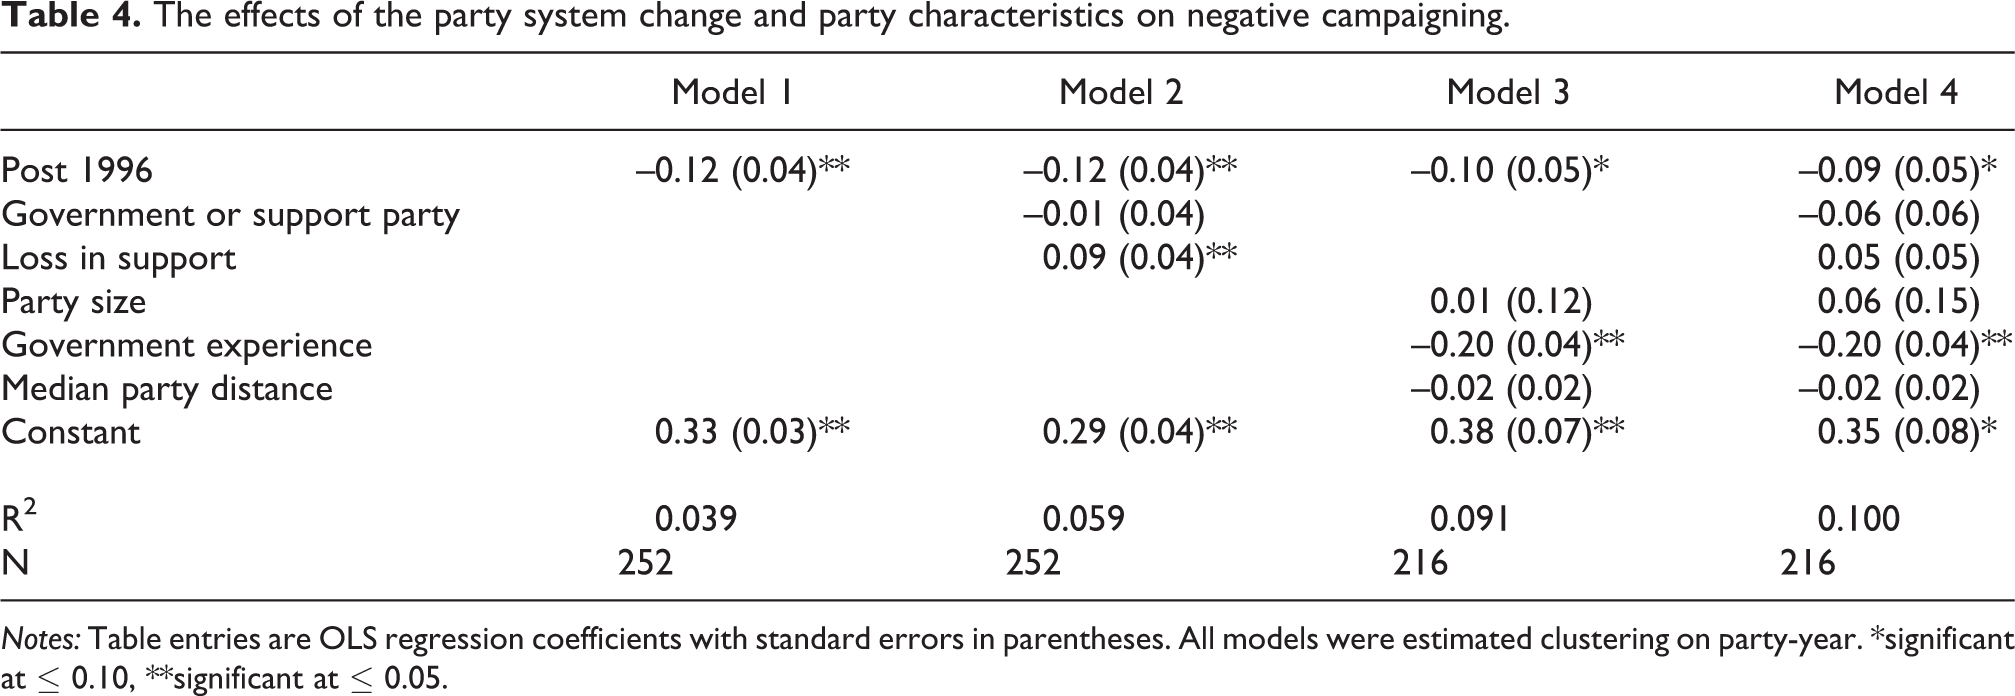
Notes: Table entries are OLS regression coefficients with standard errors in parentheses. All models were estimated clustering on party-year. *significant at ≤ 0.10, **significant at ≤ 0.05.
Model 3 shows us the variables included in Model 1 along with the indicators of coalition potential. The number of observations falls from 252 to 216 because we do not have positions for all parties on the left–right scale. Our indicator of the post-1996 period has again a negative coefficient and remains statistically significant at the 0.10 level. Only one of the three indicators of coalition potential is a significant predictor. The more experience in government a party has, the less likely it is to attack, which is consistent with our expectations. The coefficients on the Median Party Distance and Party Size variables, however, are insignificant predictors. Model 4 combines models 2 and 3. Here the only significant predictors are the post-1996 indicator and a party’s government experience. Importantly, though, all of the models support our contention that campaigning is less negative in New Zealand’s current multiparty system era.
There is a potential objection to this central finding, however, which is that the transition from a two-party to a multiparty system did not take place instantaneously. Perhaps the 1996 elections were a transition year in which the parties were still figuring out communication strategies under the new electoral rules. Thus, we re-estimated all four models reported in Table 4, removing all observations from 1996, to see if the post-1996 indicator variable would remain a significant predictor. It did in all four models. A similar objection is that the parties may have been anticipating a change to the party system, especially in light of the success of a non-binding referendum on the question in 1992. Thus, the 1993 campaign may have been transitional as well. To explore this possibility, we re-estimated the four models reported in Table 4, eliminating observations from both 1993 and 1996. Again, the post-1996 indicator variable was a significant predictor in all models.
In sum, all of our findings point to a similar conclusion: New Zealand’s multiparty system in the 1996 to 2011 period is associated with less campaign negativity than the two-party system that came before.
Conclusion
This study of party system change and negative campaigning, which examines 252 party election broadcasts in New Zealand parliamentary elections from 1969 to 2011, finds evidence in favour of our Party System Hypothesis. Our findings point to the idea that the use of negative campaigning is related to the party system. The multitude of parties and the interaction among them affects the way parties compete in an election campaign. New Zealand proved an excellent case with which to test this hypothesis given its party system change as a result of the change in electoral system, at a time during which other factors were held relatively constant.
Of course, our study is not the final word on the relationship between the party system and campaign behaviour. One limitation is missing data. Although our sample of ads is quite large and broad, we were unable to obtain all New Zealand party election broadcasts that have been aired since the dawn of television campaigning in that country, making it possible that our findings are affected by the missing data. Although the advertisements in our collection were created by a variety of parties and span a variety of years, it is difficult to know how much different from a representative sample they are, and therefore one should regard our findings as preliminary. Another limitation is that our study is confined to one polity. Although we believe New Zealand provides an excellent opportunity to examine the impact of party system change on campaign behaviour, we encourage researchers to analyse such impacts in other countries that have experienced electoral and party system change, such as France or the Ukraine. It might also be useful to see what has happened to levels of negativity in a country similar to New Zealand, such as Australia, during the same time period. If levels of negativity remained the same in Australia, whose electoral and party system has remained constant, then that would provide additional evidence in support of our conclusions. Finally, if the number of ads aired is any indicator, television advertising has become more central to New Zealand political campaigns over time, and thus television advertising may be a better indicator of the overall tone of the campaign in recent years.
In spite of these limitations, our research has much to recommend to the literature on negative campaigning. First, this study has contributed to the growing literature on negative campaigning in multiparty systems and in two-party systems outside the US, thereby broadening the scope of existing research. Second, the study confronts the conventional wisdom that politics across the globe is getting nastier as a result of the ‘Americanization’ of campaign techniques. Third, this research can be seen as a step towards the development of a more general theory of negative campaigning, as it provides a theoretical argument and evidence that point towards more structural causes of negative campaigning. Parties do not compete in a vacuum; they are inhibited by the features of the institutional environment they are competing in, such as the party system. We urge researchers to pay more attention to these factors.
Footnotes
Appendix
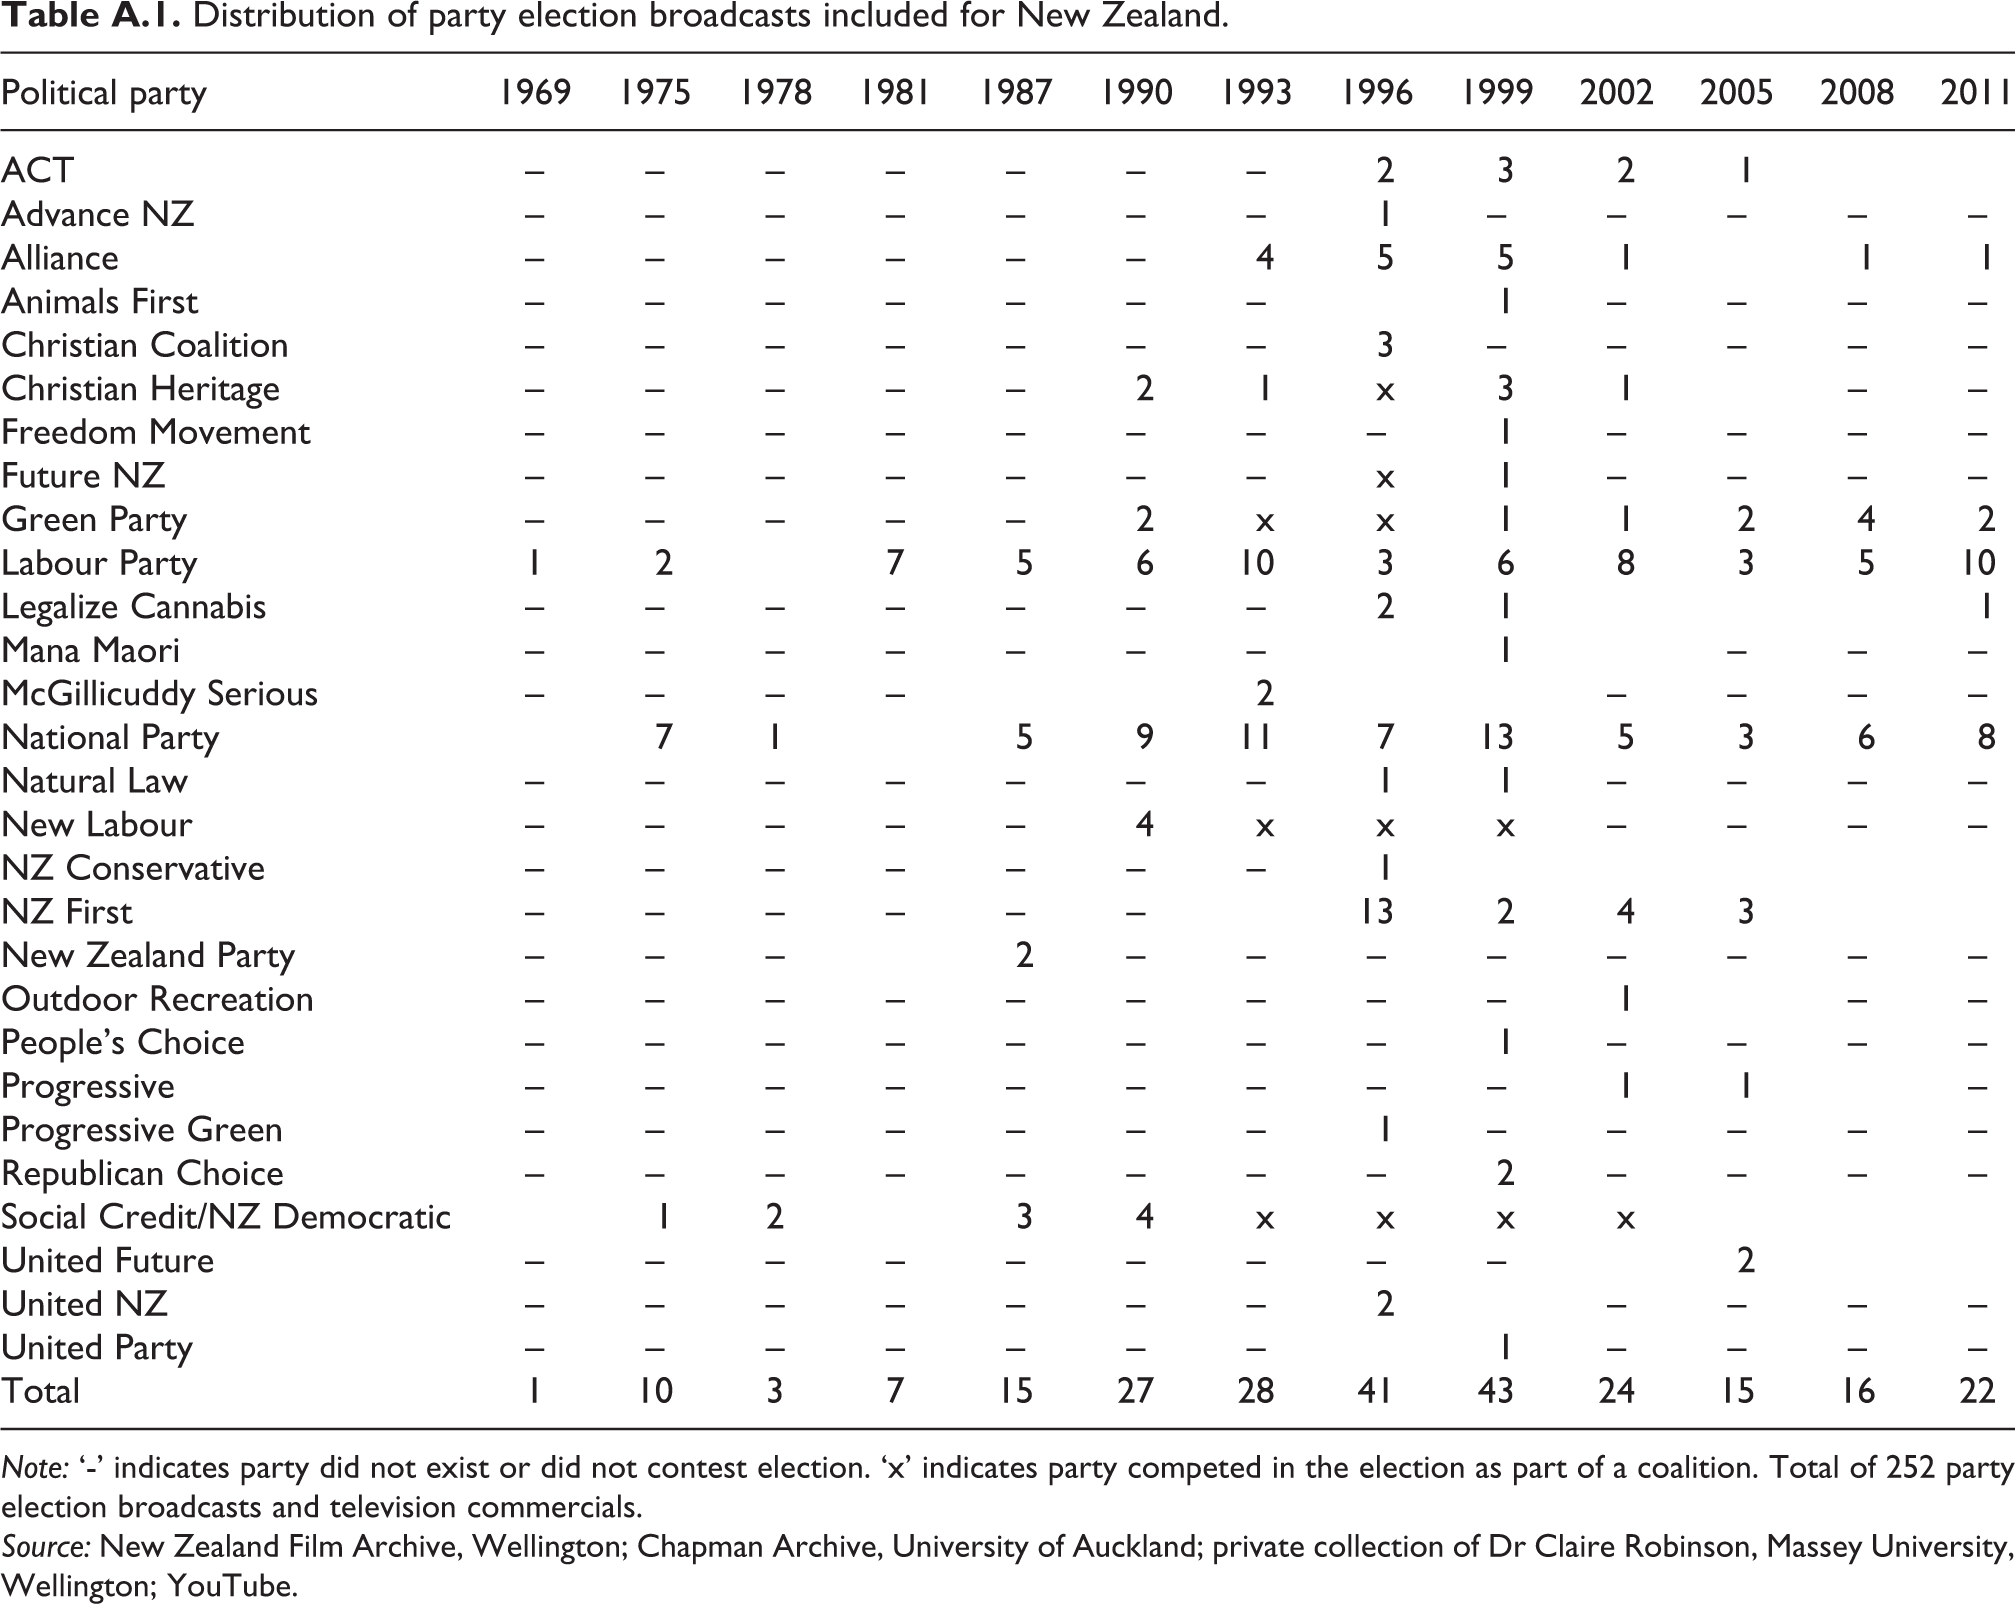
Distribution of party election broadcasts included for New Zealand.
| Political party | 1969 | 1975 | 1978 | 1981 | 1987 | 1990 | 1993 | 1996 | 1999 | 2002 | 2005 | 2008 | 2011 |
|---|---|---|---|---|---|---|---|---|---|---|---|---|---|
| ACT | – | – | – | – | – | – | – | 2 | 3 | 2 | 1 | ||
| Advance NZ | – | – | – | – | – | – | – | 1 | – | – | – | – | – |
| Alliance | – | – | – | – | – | – | 4 | 5 | 5 | 1 | 1 | 1 | |
| Animals First | – | – | – | – | – | – | – | 1 | – | – | – | – | |
| Christian Coalition | – | – | – | – | – | – | – | 3 | – | – | – | – | – |
| Christian Heritage | – | – | – | – | – | 2 | 1 | x | 3 | 1 | – | – | |
| Freedom Movement | – | – | – | – | – | – | – | – | 1 | – | – | – | – |
| Future NZ | – | – | – | – | – | – | – | x | 1 | – | – | – | – |
| Green Party | – | – | – | – | – | 2 | x | x | 1 | 1 | 2 | 4 | 2 |
| Labour Party | 1 | 2 | 7 | 5 | 6 | 10 | 3 | 6 | 8 | 3 | 5 | 10 | |
| Legalize Cannabis | – | – | – | – | – | – | – | 2 | 1 | 1 | |||
| Mana Maori | – | – | – | – | – | – | – | 1 | – | – | – | ||
| McGillicuddy Serious | – | – | – | – | 2 | – | – | – | – | ||||
| National Party | 7 | 1 | 5 | 9 | 11 | 7 | 13 | 5 | 3 | 6 | 8 | ||
| Natural Law | – | – | – | – | – | – | – | 1 | 1 | – | – | – | – |
| New Labour | – | – | – | – | – | 4 | x | x | x | – | – | – | – |
| NZ Conservative | – | – | – | – | – | – | – | 1 | |||||
| NZ First | – | – | – | – | – | – | 13 | 2 | 4 | 3 | |||
| New Zealand Party | – | – | – | 2 | – | – | – | – | – | – | – | – | |
| Outdoor Recreation | – | – | – | – | – | – | – | – | – | 1 | – | – | |
| People’s Choice | – | – | – | – | – | – | – | – | 1 | – | – | – | – |
| Progressive | – | – | – | – | – | – | – | – | – | 1 | 1 | – | |
| Progressive Green | – | – | – | – | – | – | – | 1 | – | – | – | – | – |
| Republican Choice | – | – | – | – | – | – | – | – | 2 | – | – | – | – |
| Social Credit/NZ Democratic | 1 | 2 | 3 | 4 | x | x | x | x | |||||
| United Future | – | – | – | – | – | – | – | – | – | 2 | |||
| United NZ | – | – | – | – | – | – | – | 2 | – | – | – | – | |
| United Party | – | – | – | – | – | – | – | 1 | – | – | – | – | |
| Total | 1 | 10 | 3 | 7 | 15 | 27 | 28 | 41 | 43 | 24 | 15 | 16 | 22 |
Note: ‘-’ indicates party did not exist or did not contest election. ‘x’ indicates party competed in the election as part of a coalition. Total of 252 party election broadcasts and television commercials. Source: New Zealand Film Archive, Wellington; Chapman Archive, University of Auckland; private collection of Dr Claire Robinson, Massey University, Wellington; YouTube.
Acknowledgements
We thank Stephen Levine, Claire Robinson, Rob Salmond, Alessandro Nai, Michael Miller, Jürgen Maier, André Blais, Emre Toros, Scott Desposato, Wouter de Nooy, Huib Pellikaan and Sarah de Lange for useful comments and Jennifer Lees-Marshment and Claire Robinson for their help in gaining access to the advertisements we analysed.
Funding
The author(s) received no financial support for the research, authorship, and/or publication of this article.