
Abstract
We know that most House seats remain within the same party over the course of a redistricting decade. For example, over 75% did so in the last decade. This gives rise to the question: “Why do some seats change hands and others not?” We seek to go beneath the standard answers (such as extent of electoral vulnerability as indicated by the previous victory margin, challenger qualifications, relative spending of challenger and incumbent, midterm loss affecting districts newly won by the president’s party, realignment effects that made Democrats in the South vulnerable) to examine the conditions of ideological competition that affect each of these factors and the concomitant probability of electoral defeat. We offer a general model of unidimensional party competition across multiple constituencies, where a party “chases the outliers” of the other party that are closest to its own ideological mean, thus eliminating “anomalous” districts which should be vulnerable to change in party control, and we test that model with data from the U.S. House of Representatives 1980–2006. Over time, Democrats capture liberal and moderately liberal districts held by Republicans, while Republicans capture conservative and moderately conservative districts held by Democrats. In a neo-Downsian world where candidates do not locate at the preferences of the median voter in the district but, rather, are shifted in the direction of their own party mean, we show that this outlier-chasing dynamic can be expected, in the long run, to “empty” out the center. This results in an equilibrium of ideologically distinct parties and a high level of polarization, involving a self-reinforcing dynamic in which the seats that become vulnerable change as the parties become more distinct. Indeed, rather than puzzling about why so much polarization exists, our work suggests that the real puzzle is why it has taken so long to get to the level of polarization we presently enjoy. We suggest that the combination of incumbency advantage, and multidimensionality of political competition might be the answer, with the Civil War role of race as an independent dimension slowly wearing off.
Introduction
Increased party polarization is arguably the most important phenomenon of the modern U.S. Congress. There has been a vast literature looking for the macro-level socio-economic roots of polarization, e.g. changes in immigration flows and in inequality of income distribution (Poole et al., 2006), or changes in race relations and the factors structuring party competition (Fiorina, 2005, 2006); and there has also been work at a more micro level that focuses on electoral dynamics. In a comprehensive study of recent replacement patterns in the Congress, Theriault (2006, 2008) has linked changes in party polarization in the House to a combination of between-party and within-party replacements and what he refers to as “conversion” effects, where, gradually, over the course of a career in the legislature, on balance, incumbents move to be more compatible with the mean ideology of their own party. Based on his reading of the evidence, Theriault (2006) argues that replacement effects are considerably more important than the conversion effect in producing polarization in the legislature as a whole.
Here we seek to build on Theriault’s work by recognizing that replacement effects on polarization must be seen as a two-stage process. First we must identify which districts are most likely to change partisan control. Then we must model the expected roll call voting changes in districts that undergo a change in partisan control as compared to those that do not – recognizing, too, that some effects may be party specific. Failure to model the first element, namely which districts can be expected to change partisan control, can lead to a misinterpretation of the relative importance of different factors. This concern is particularly salient for the U.S. House since only a small portion of districts experience partisan change. For example, in the 2002–2010 cycle only 56 House seats (12.9%) ended the decade under control of the opposite party compared to the start of the decade. An additional 47 seats (10.9%) changed party hands twice and ended up under the same party control as in the start of the decade. The overwhelming majority (76.3%) of seats in the House of Representatives stayed under the control of the same party for the entire redistricting decade. 1
It is the first of these two stages that is the principal concern of this essay, namely “Why do some seats change partisan control and others not?” From a micro-level perspective, political scientists have traced the likelihood of electoral defeat as a function of factors such as margin of previous electoral success, seniority, level of opposition (e.g. challenger qualifications and relative campaign spending), as well as national factors such as presidential approval rating and strength of presidential coattails, and long term phenomena such as realignment 2 and midterm loss 3 (Engstrom and Kernell, 2005; Erikson, 1976; Golder, 2006; Jacobson, 2004, 2013). Here we take a meso-level perspective, seeking to go “below the surface” to characterize the seats most likely to change hands in ideological terms, and to offer a model that can help explain electoral vulnerability and which districts are most likely to be affected by midterm tides or by realignment effects.
In seeking to answer the question of which districts, on average, are most likely to change in partisan control, we rely on two stylized facts: that constituencies differ in the location of their median voter, and that partisan candidates in each district typically have distinct platforms. In addition, we rely on the following two fundamental intuitions.
The first stylized intuition is that candidates in each party have their potential policy location constrained by the overall position of the party/party activists and the variance around those positions. In other words, as the parties become more sharply differentiated, Democratic (Republican) candidates in constituencies with a right (left) of center median voter find it harder to compete successfully, since they will not be able to convincingly offer a position close to that constituency’s median voter. The nature of the constraints will affect which seats are competitive and which are not (Winer et al., 2014). Moreover, when the party’s legislative incumbents are more homogeneous ideologically, it is much easier for activists to seek to enforce ideological conformity on party candidates and to threaten to run opponents if they do not toe the party line.
Our second intuition is that the potential ideologically driven vulnerability of incumbents in some districts will encourage strong challengers from the other party. This leads to a phenomenon that we call “outlier-chasing,” in which Democrats (Republicans) are, ceteris paribus, most likely to be successful in replacing incumbents who are ideologically at the left (right) edge of the Republican (Democratic) party. 4 When the district median is actually closer to the (national) position of the non-incumbent party in the district, only the presence of an incumbent who is taking a position close to the constituency median but far away from the (national) position of her/his own party allows that party to continue to hold the district. In the longer run, that is not a stable situation, especially as the parties become more polarized nationally.
Our general model of party competition across multiple constituencies has a predator–prey characteristic to it. Wolves attacking a herd of animals that they feed upon look for the most vulnerable animals in the group, and these vulnerable members are the ones most likely to succumb to the attack. Very frequently this means that the attack is concentrated on those who are outliers in terms of distance to the herd; although the aged, the young, or those who are vulnerable for other reasons such as injury are also targets. Analogous strategic considerations apply to U-boats attacking a merchant convoy protected by a destroyer. By analogy we also expect that – while there will be many idiosyncratic reasons why particular incumbents lose or choose to retire, or why particular seats become open – the most likely representatives to fall to replacement will be those who are “far away” from the rest of their party in the direction of the other party and thus in districts that might seem to be “more naturally” represented by someone from the other party.
In the next section, using data from the U.S. House of Representatives, 1980–2006, we investigate whether replacement effects are compatible with the predictions of a party seeking the outlying seats of the other party that are closest to its own position, i.e. being most successful in eliminating the “anomalous” districts controlled by the other party which should be vulnerable to change in party control. We test the hypothesis that Republicans are more likely to succeed in capturing conservative and moderately conservative districts held by Democrats, with Democrats more likely to succeed in capturing liberal and moderately liberal districts held by Republicans. 5 In another more indirect approach, using presidential voting as a proxy for the ideological characteristics of constituencies, we find further strong evidence in support of this claim. We then consider issues of within-party replacement and ideological drift.
In the following section we sketch out in analytic form the implications of the outlier-chasing model for the equilibrium level of ideological polarization. For unidimensional politics, we show how this model, when combined with constraints on candidate positioning linked to the overall composition of the party delegation in Congress, can result in an equilibrium of ideologically distinct parties.
Moroever, the supplementary assumptions we make about how candidate positions are constrained by national party positions 6 can also help explain the patterns found by Theriault (2006, 2008) of greater extremism resulting from within-party replacements, and the likelihood of incumbent drift in a more extreme direction. The twin factors of limited “wiggle room” to accommodate one’s position to that of the median voter in the district and the increased “tightness” of ideological constraints caused by the increased polarization of national party and activist positions can lead to a self-reinforcing dynamic of ever further increasing polarization. In this dynamic, not only is it the case that right-of-center Democrats and left-of-center Republicans will tend to be eliminated through partisan replacement, thus increasing polarization, but same-party replacements will also be more ideologically extreme (to one side or the other) than previous incumbents because they will be facing greater pressure from activists in their own party, and will be forced to take a position closer to the (new) position of their own party. Indeed, even many long term incumbents will be forced to respond to this kind of pressure to adapt to a changed party legislative base.
Just as recent work (Grofman, 2004) has argued that Downs’ convergence result for two-party plurality competition is a “knife-edge” result resting on very strong assumptions unlikely to be met in the real world, so we would argue that, where politics is unidimensional, the Downsian expectation of party convergence in individual constituencies has led to a quite misleading view that polarization in the legislature when there is competition across multiple constituencies is peculiar and needs to be explained. In place of the standard Downsian story we offer a theoretical model based on picking off outliers in which, in equilibrium, polarization will be what we should expect. In the concluding discussion we consider the real puzzle suggested by this result, namely: why it has taken so long to get the high levels of polarization presently found.
Empirical tests of the outlier-chasing hypothesis: U.S. House of Representatives, 1980–2006
As we have argued earlier, it is important to distinguish two different questions. The first question is which districts are most likely to change partisan control. The second is what are the consequences of change in party control (or within-party replacement) for change in the voting behavior of the representative. In other words, do representatives from the same constituency vote alike? It is the first question which is of greatest concern to us. Regarding the first question, we claim that, ceteris paribus, over time, districts that were ideologically more proximate to the opposite party, i.e. districts at the tail of one’s own party’s ideological distribution, were the ones most likely to experience a shift in partisan control. In the remainder of this section we will address evidence bearing on this claim. In the next section we will look at the ideological characteristics of new representatives as compared to old ones, especially those they replace.
In what kinds of districts do losses occur in the House, 1980–2006?
In the immediate post-WWII period both parties were characterized by a mix of liberal, moderate, and conservative districts – albeit ones in which the Democrats might better be characterized as a catch-all party than the Republicans, with the former having an especially large right tail (e.g. white Southern Democrats and other moderates). Thus, we began the latter part of the 20th century with an overlapping distribution of Republican-held and Democratic-held districts, such as was the case, for example, in 1956 in the House. Then, over time, if replacements are most likely to take place in the constituencies where the other party is most vulnerable, i.e. losses are more likely in conservative constituencies for the Democrats, but in liberal or moderate constituencies for the Republicans, we can expect to see the parties diverge. As Republicans lose seats in moderately leftist districts and replace them with wins in moderately rightist districts, then the Republican mean will move right and the Democratic mean will move left. However, electoral tides will also matter since they will determine whether the seats changing hands are primarily left-of-center or right-of-center.
In this section, we reexamine the same kind of roll call data as that reviewed by Theriault (2006, 2008) on the links between replacement and polarization, but viewed in the light of our outlier-chasing hypothesis. We present basic data on the replacement effect for the Congresses from 1980 through 2004 in Tables 1 and 2. Table 1 shows the DW-NOMINATE 7 scores for current House members for a given Congress in districts of six types: those held by Democrats and retained by the same Democrat (DD) in the subsequent election, those held by Democrats and retained by Democrats but with a change (due either to death, or retirement, or primary loss) in which a Democrat holds the seat (Dd), those formerly held by Democrats but lost to a Republican (Dr) and the corresponding categories for the Republicans (RR, Rr and Rd). 8 Table 2 shows the DW-NOMINATE scores for the current House members in districts of the same six types (where the first letter now refers to the party of the previous incumbent). Each table also presents information about cell sizes in each of the six categories in each of the Congresses.
DW-NOMINATE scores for previous MCs by category of election outcome.

*Entries give information on the distribution of first dimension DW-NOMINATE scores for members of Congress depending on the outcome of the election that follows each Congress. So the entries in the 100th Congress (elected in
DW-NOMINATE scores for current MCs by category of election outcome.
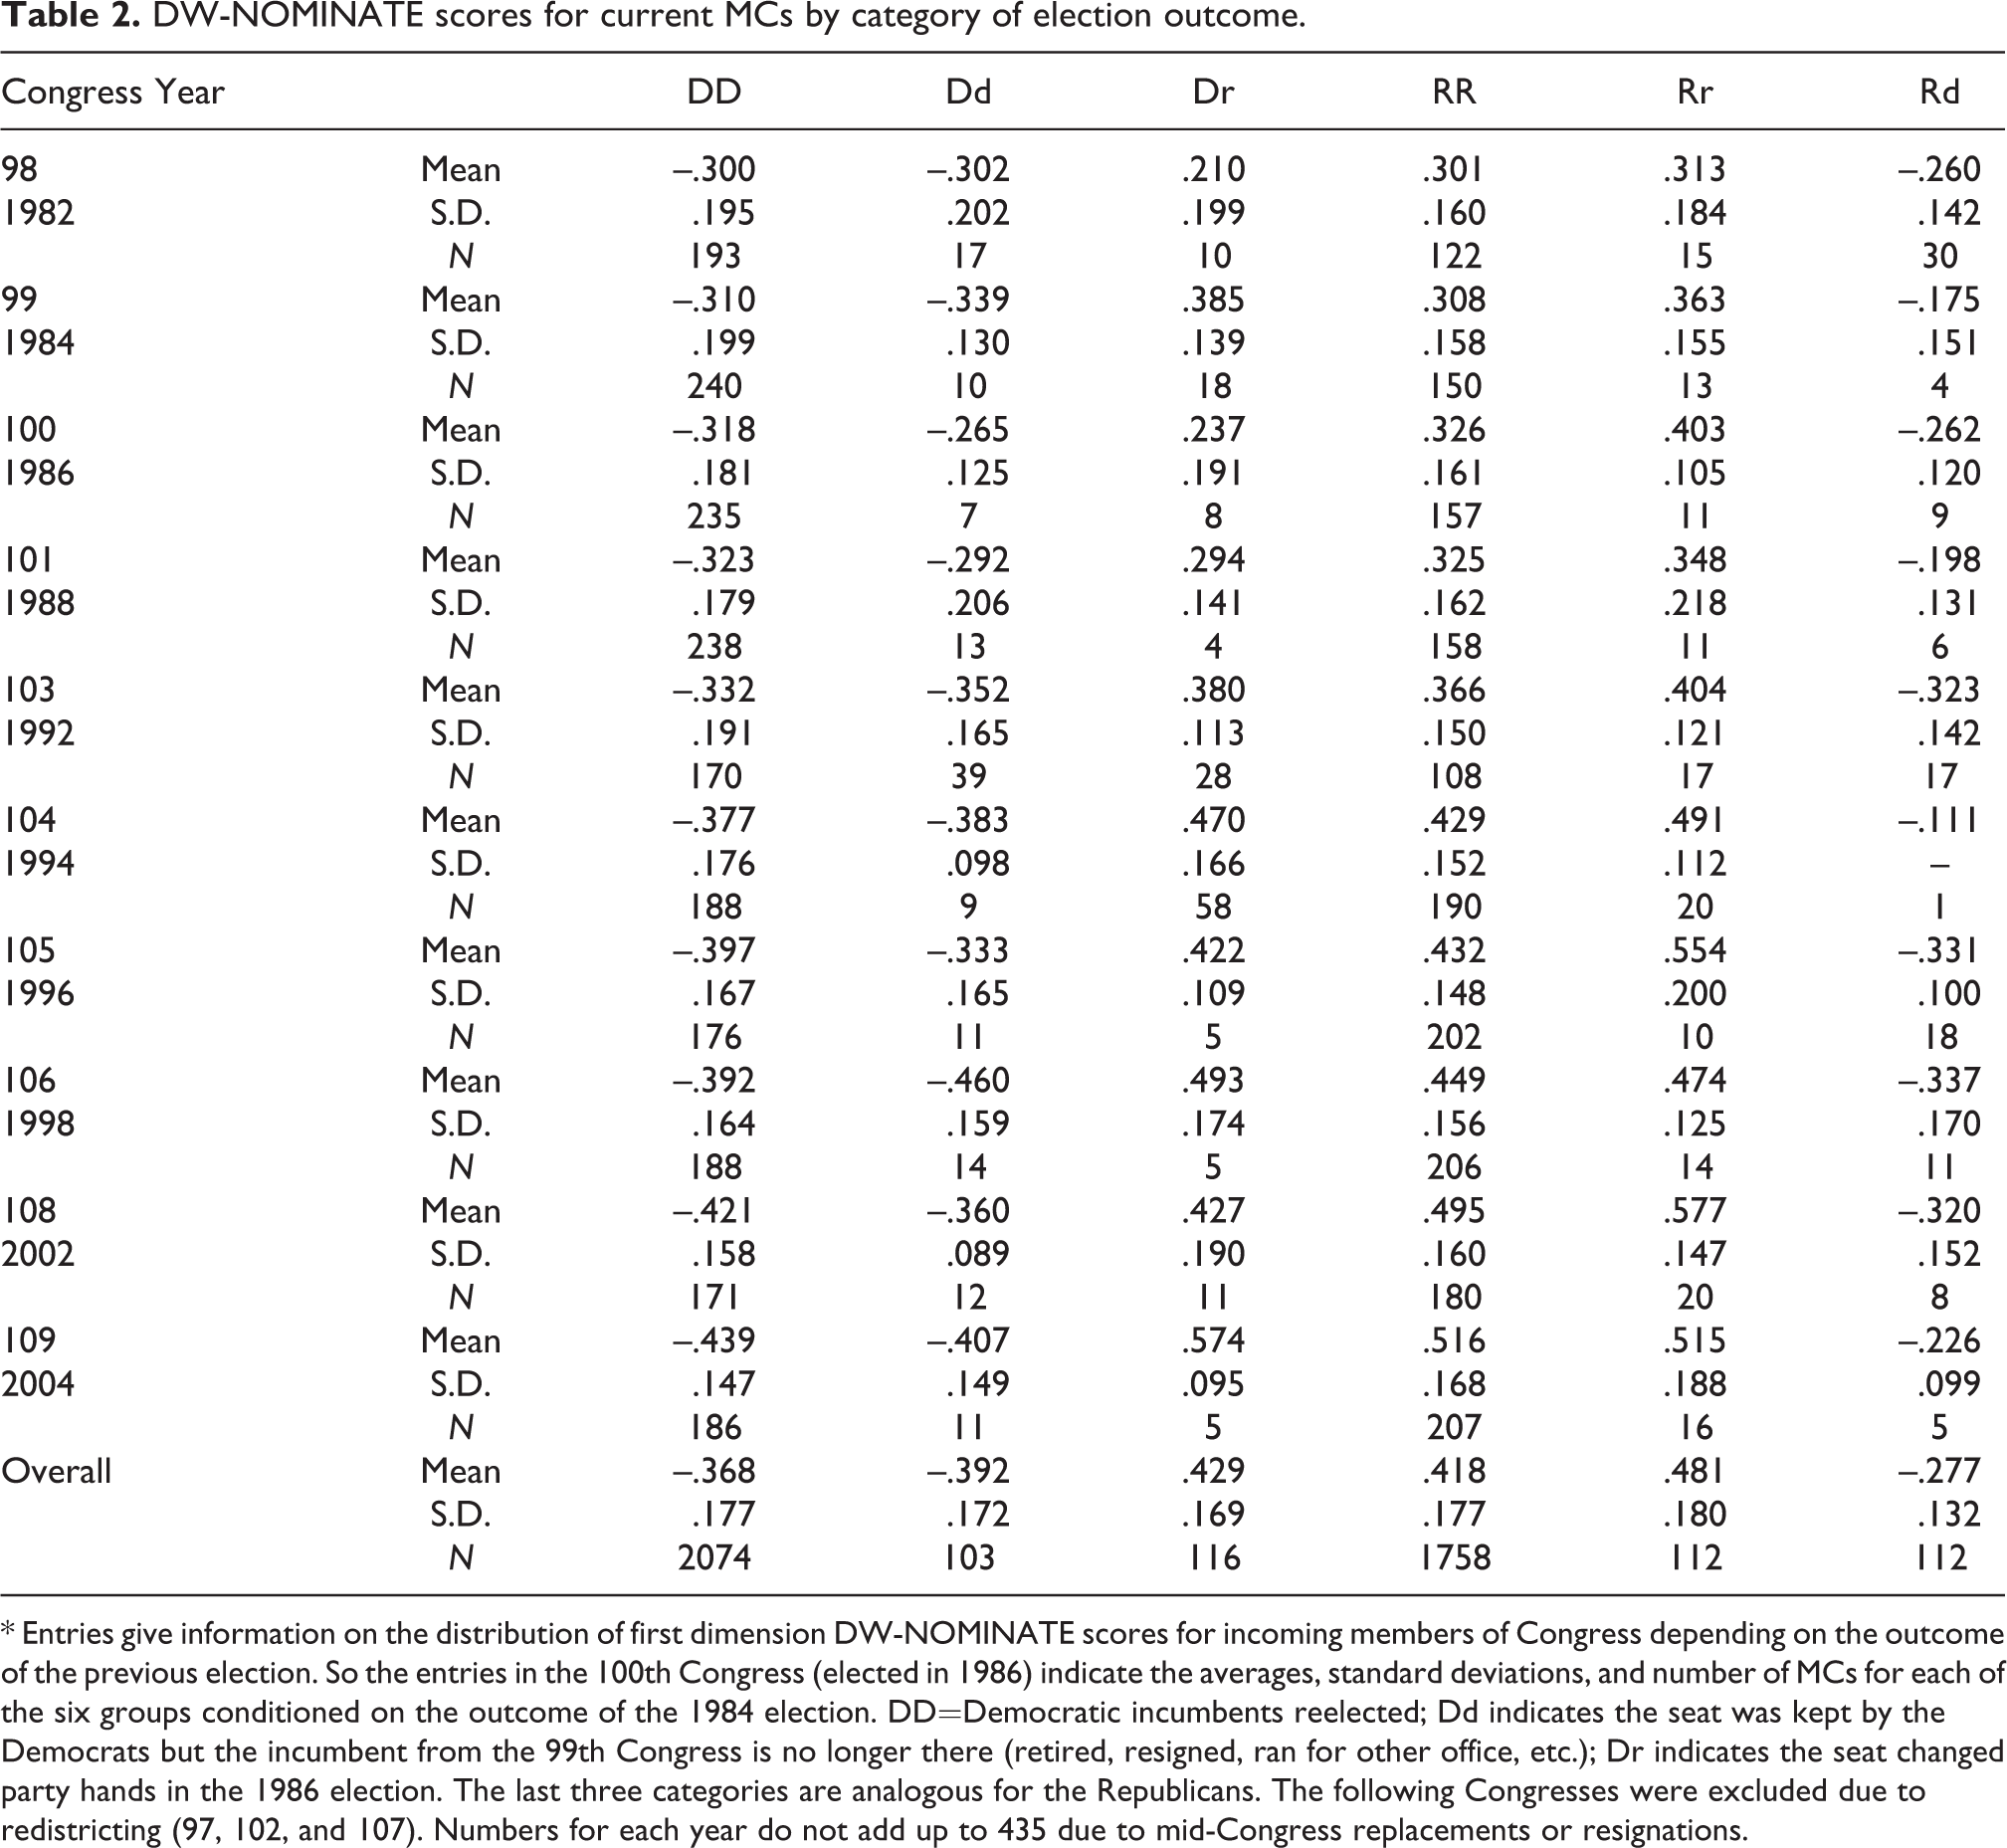
* Entries give information on the distribution of first dimension DW-NOMINATE scores for incoming members of Congress depending on the outcome of the previous election. So the entries in the 100th Congress (elected in 1986) indicate the averages, standard deviations, and number of MCs for each of the six groups conditioned on the outcome of the 1984 election. DD=Democratic incumbents reelected; Dd indicates the seat was kept by the Democrats but the incumbent from the 99th Congress is no longer there (retired, resigned, ran for other office, etc.); Dr indicates the seat changed party hands in the 1986 election. The last three categories are analogous for the Republicans. The following Congresses were excluded due to redistricting (97, 102, and 107). Numbers for each year do not add up to 435 due to mid-Congress replacements or resignations.
In this section we will focus on what we learn from Table 1. Table 1 allows us to see whether, say, the Democratic-held districts that shift party control had incumbents who were more conservative than the positions taken by Democrats in the districts where the Democrats held on to office. 9 If true, this would suggest that the districts lost by Democrats were disproportionately on the right tail of the Democratic distribution, and thus likely were ones where a moderate or conservative candidate of the other party might have had a better chance at victory. Similarly, it allows us to see whether or not the Republican-held districts that shift party control had incumbents who were more liberal than the positions taken by Republicans in districts where the Republicans held on to office. Or to put it another way, Table 1 allows us to focus on where losses for each party occur.
The DW-NOMINATE means, –.361 and –.376, for the DD and Dd categories (reported in the last row of Table 1), are essentially identical, so that the voting behavior of the previous incumbent does not differ between the districts that reelect the same Democrat and those that reelect a different Democrat. On the other hand, the value for the Dr case is –.249, so that we see that the districts where Democrats lose are those that are, on average, more conservative, i.e. districts where the Democratic incumbent had been more conservative than the Democratic mean. This difference is roughly .110. Moreover, as expected, a t-test comparing the DD category with the Dr category in Table 1 is significant at the .001 level. Thus, Democratic losses over this period push the Democrats to the left by eliminating more conservative Democrats. 10
Similarly, from Table 1 we find that RR and Rr are essentially identical in DW-NOMINATE scores, .409 and .407, while the Rd mean is .390, so that the districts where Republicans lose may have had, on average, slightly more liberal incumbents. However, this difference is roughly 0.019, and a t-test comparing the RR and Rd categories in Table 1 has a p-value of .13, so the difference is not statistically significant, but in the correct direction.
We now look at the aggregated data above in a slightly different way. In the next two figures we present the same data shown in Table 1 but in a graphical fashion that, we think, makes it even easier to see the basic underlying patterns, though it leaves out the Congress-by-Congress details.
Figures 1 and 2 show how House members who lose (or retire) in any given election compare ideologically to their co-partisans who were able to get reelected, and allow us to compare new members’ ideologies to the ideology of those who are already members. In Figure 1, for the period of the 98th (elected in 1982) Congress through the 110th Congress (elected in 2006), we have plotted the density estimates for the first dimension of DW-NOMINATE scores for House Democrats who lost their bid for reelection or did not run for reelection and were replaced by a Republican, on the one hand, and for the Democrats that held on to their seats throughout this period, on the other. 11 Figure 2 reports the same data for Republican House members.

Winning and losing (or retiring) Democratic House members’ DW-NOMINATE scores from the 98th through 110th Congress.
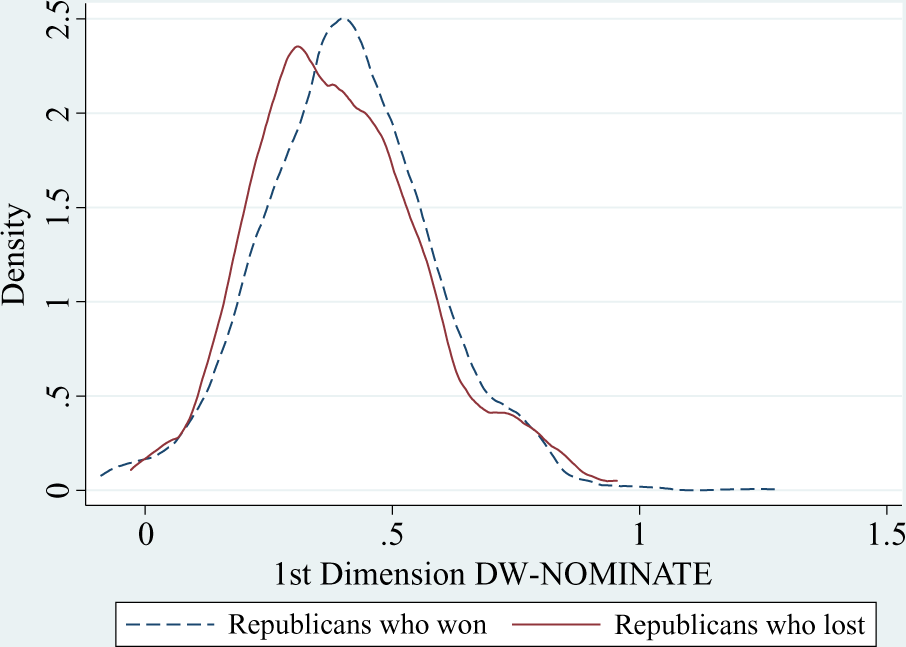
Winning and losing (or retiring) Republican House members’ DW- NOMINATE scores from the 98th through 110th Congress.
The average losing or retiring Democrat, during this era, is significantly more conservative (less liberal) than incumbent Democrats that did not lose (since scores closer to zero are more moderate). In contrast, as seen in Figure 2, Republicans who lose or retire in this period are only trivially more moderate (less conservative) than those who win. Nonetheless, in general, when parties lose seats in this era, the effect is to shift the Democrats leftward while leaving the Republicans firmly anchored rightward, and so inter-party polarization is increased due to this aspect of replacement.
How do new members of the House look ideologically, compared to their predecessors?
In this section we address the second of our two framing questions, namely, how do new representatives differ from old ones. We examine two important questions considered by Theriault (2006, 2008), namely: (a) How is polarization affected by within-party replacement in the same districts? and (b) How is polarization affected by an ideological drift of sitting incumbents?
By comparing the overall ideological change we observe over the course of the period 1980–2006 with the changes that can be attributed to between-party replacements whether we also need to take into account within-party replacements and conversion effects to account for the observed changes in polarization over this time period. What we find reinforces Theriault’s (2006, 2008) conclusion that within-party conversion effects also matter in explaining the growth in polarization, but primarily for the Republicans rather than the Democrats. 12
Turning to the data in Table 2, focusing on the means reported in the last row of the table we see that, in the aggregate, Democrats returning to Congress (the DD case) are not significantly different in their voting from newly elected Democrats who replace a previous Democratic incumbent, the Dd case (–.368 versus –.392). But, Democrats who are newly elected from previously Republican-held seats (the Rd case) are less liberal than their long-time Democratic colleagues (–.277 versus –.368). This difference of .092 is statistically significant at p < .0001. Thus, it would appear that Democrats who replace Republicans are, on average, more conservative than the previous mean Democrat. This replacement effect pushes Democrats to the right but, of course, as we can see from Table 2, there are not that many cases in this column, so the effect is muted.
Now we turn to the patterns for Republicans. As shown in Table 2, unlike what we found for Democrats, in the aggregate, Republicans returning to Congress, the RR case, are different in their voting from newly elected Republicans who replace a previous Republican incumbent, the Rr case (.418 versus .481). The t-test for this difference yields a p-value of less than .0001. Thus, there is evidence that within-party replacements are moving the Republican party in a conservative direction. On the other hand, Republicans who are newly elected from previously Democrat held seats (the Dr case) are nearly identical to their long-time Republican colleagues (.429 versus .418); this difference is not statistically significant. In short, Republican homogeneity is increasing, regardless of the category of district from which a Republican is elected – which translates as greater conservatism. Of course, once a Democratic seat becomes a Republican seat, in subsequent elections it is the direction of within-party movement that will matter. So, for the Republicans, we see a key cause of the growing conservatism as a general shift of all representatives rightward, while for Democrats growing liberalism is more a consequence of between-party replacements.
The between-party replacement effects for Democrats average around .012 each election. Thus, over a dozen elections, the change can be as large as .144. Such a change is consistent with the difference between the observed DD value at the start of the period, –.306, and that at the end of the period, –.431, i.e. a shift in a more liberal direction. However, for Republicans, even summed over a dozen elections, the between-party replacement effect is not that large, .072, and cannot account for the very large change between the observed RR value at the start of the period and that at the end of the period, which involves a shift of over .200 in a more conservative direction. Thus, for the Republicans, much of the change stems from within-party replacements (or the behavior of sitting incumbents, as their votes shift to reflect changes in the characteristics of the districts held by the party and the behavior of newly elected representatives). 13
Other evidence about which types of districts change hands in the House, 1980–2006
Another, more indirect piece of evidence bearing on the outlier-chasing story we offer, involves divergence between the seats won by the congressional candidate of the party and the seats won by the presidential candidate of the party. While the raw numbers of such discrepant seats will vary with presidential victory margins (Brunell and Grofman, 2009), we can, nonetheless, ask “which seats are the discrepant ones?” If we are right about capturing outliers, the discrepant House seats, i.e. those won by one party but lost by the presidential candidate of that party, should be ones where the congressional incumbent’s ideology is discrepant with that of his or her party, and where the incumbent is winning primarily because of personal characteristics such as perceived trustworthiness or ability to deliver pork to the district. In the longer run, we expect these seats to be the ones most likely to change partisan control. 14
To test this theory-derived intuition we first look at four types of seats in each of our election years: (1) those carried by the Democrats for both the House and the presidential election (Dd); (2) those carried by the Republicans for both the House and the presidential election (Rr); (3) those carried by the Republicans for the House but by the Democrats in the presidential election (Dr); and (4) those carried by the Democrats for the House but by the Republicans in the presidential election (Rd). We hypothesize that seat types (3) and (4) should be intermediate in ideology between type (1) and type (2), but with type (3) more liberal than type (4). The relevant data is provided in Table 3.
Ideological characteristics of House seats that are or are not consistent with presidential vote outcomes, 1980–2006.
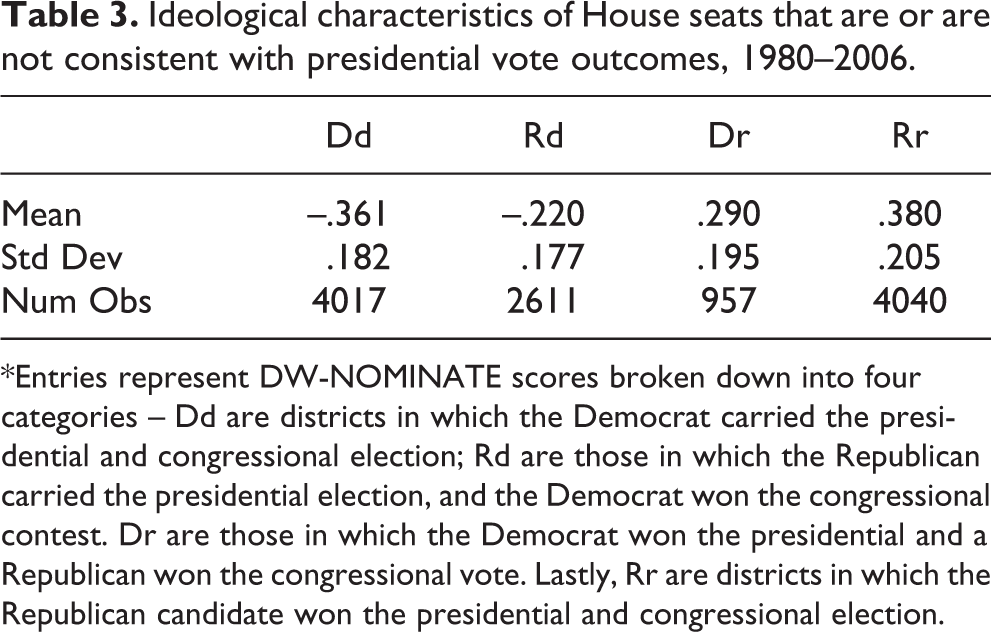
*Entries represent DW-NOMINATE scores broken down into four categories – Dd are districts in which the Democrat carried the presidential and congressional election; Rd are those in which the Republican carried the presidential election, and the Democrat won the congressional contest. Dr are those in which the Democrat won the presidential and a Republican won the congressional vote. Lastly, Rr are districts in which the Republican candidate won the presidential and congressional election.
Our expectations are met completely. The two intermediate categories, those in which the district is carried by the presidential candidate from the opposite party of that of the incumbent member of Congress, are represented by members who are clearly much more moderate than co-partisans from districts in which the presidential candidate from the “right” party carries the district. Having established that districts where we get discrepant outcomes at the presidential and the House level are the more “moderate” districts, now we need to establish that these “divided outcome” districts are ones where change in partisan control is most likely.
To test this expectation we look at midterm elections and at the districts in the previous presidential contest that are under divided party rule. We expect to find that a higher proportion of divided districts experience a change in party control than is the case for the districts where there is a consistency of partisanship in outcomes for both presidency and House in the previous election. Over our time period there is a higher proportion of mismatched districts that change party hands relative to unified districts (9.0% versus 6.7%, chi-squared significant at p < .05). Of course, some of the partisan turnover in districts in any given year is due to idiosyncratic features, and some incumbents in discrepant districts will be reelected because of factors peculiar to themselves.
If we are correct about the link between divided districts and ideological polarization then we should expect a correlation between the number of divided districts and the mean difference between party delegations in the House. This is precisely what we find; there is a –.90 correlation between the number of mismatches and the gap between the average Republican and average Democratic member of the House. So the more mismatches there are, the closer the two party averages are together.
Theoretical results about divergence dynamics given outlier-chasing parties
Having presented evidence about the actual patterns of replacement in the U.S. House, we now offer a stylized model of unidimensional two-party competition, with two parties who differ in their willingness to allow ideological drift from the national party position, that is intended to mimic these real-world patterns and from which we can deduce the nature of a long-run equilibrium. In this model, each party will seek to knock off the incumbents of the rival party in constituencies at the edge of each party’s ideology and will, over time, largely succeed in that goal. The importance of party activists as guardians of party purity, and the limited feasibility of making credible claims to positions close to the median voter in a constituency when the national position of your party is far away from that local median, leads us to expect a highly polarized equilibrium. But, given a tighter ideological tether by one party, we also expect that partisan replacement will change the mean location of that party much more than the other.
The dynamics of outlier-chasing parties lead to greater polarization in years when the more homogeneous and more tightly controlled party makes gains, and less polarization when opposite conditions hold
Consider a stylized setting in which there are two parties, a left-of-center party called D and a right-of-center party called R, and three categories of districts: liberal, moderate and conservative. Suppose further that party R wishes to maintain a homogeneous brand and runs only conservative candidates but party D is more tolerant of its candidates’ positions and runs moderate candidates in both moderate and conservative districts and liberal candidates in liberal districts.
When the electoral tides run in the conservative direction (which we label scenario 1), party R wins in both conservative and moderate districts (with conservative candidates in both types of districts), while party D wins (with liberal candidates) in liberal districts. With no moderates elected, the legislature is highly polarized. On the other hand, when the electoral tides are liberal (labeled scenario 2), party D wins the moderate districts with moderate candidates (while the results in the other districts are the same as in scenario 1). Thus, in scenario 2 the legislative delegation from party D is significantly moderated, whereas that from party R is just as conservative as in scenario 1. The effect is to reduce polarization, albeit in a one-sided manner. When the electoral tides are intermediate, moderate districts elect some moderates (from party D) and some conservatives (from party R), resulting in intermediate polarization.
More generally, consider district medians distributed on a continuum from left to right, with the mean of party R’s delegation at r and that of party D at d. Assume unequal party tethers of TD and TR for parties D and R, respectively, so that candidates of party D are constrained on the right by d + TD and candidates of party R are constrained on the left by r - TR. Assume further, a cutpoint c, such that party D wins seats whose district medians are to the left of c and party R wins seats with district medians to the right of c. During tides in the conservative direction, the cutpoint moves left whereas during liberal tides, the cutpoint moves right.
Now, suppose that the tethers are unequal, with that of party R much tighter (smaller) than that of party D. When the cutpoint is near d + TD (conservative tide), party D wins its base (to the left of d + TD) while party R wins both its base (to the right of r - TR), but also wins any districts between d + TD and r - TR, winning districts in the latter interval with candidates whose ideology lies to the right of r - TR. Thus, the partisan delegations are polarized.
If instead, the cutpoint is near r - TR, again each party wins its base but party D wins any districts with medians between the two bounds and does so with moderate candidates whose ideologies fall near d + TD. Thus, the delegation of party D spreads over a wide ideological range, because party D has a looser tether than party R, so that polarization in the legislature is reduced. If the tethers are loose enough that the ranges permitted the candidates of the two parties overlap, then the partisan delegations in the legislature will likely overlap and polarization is even further reduced.
We summarize these effects, as they apply to non-centrist parties. When a party that exercises strong constraints against moderation by its candidates enjoys an electoral tide in its favor, polarization increases. Conversely, when a party that tolerates moderation by its candidates is favored by the electorate, polarization decreases. On the other side of the coin, a party that keeps a tight leash on their candidates will, of course, experience little change in mean party position regardless of its share of the legislature.
For example, during the Democratic tide elections of 2006 and 2008, the Democratic Party won many moderate constituencies (and control of the House of Representatives) and, on average, became more moderate. Although Republicans lost their seats in these moderate districts, the mean complexion of the Republican delegation barely changed because the Republicans who had represented these moderate districts were almost as conservative as the remaining Republicans who represented more conservative districts.
In Merrill et al. (2014) we show, under certain conditions, that in the long term if the tethers by which both national parties constrain the positioning of district candidates are loose then at equilibrium the party delegations are broad and overlapping; whereas, if the tethers are sufficiently tight, the party delegations are narrow and well separated. 15 Periods of low polarization have occurred historically in the U.S. Congress during the mid-twentieth century, when conservative Southern Democrats and liberal Northern Republicans – both of whom deviated greatly from national party means – were acceptable to their respective parties and were electable. Toward the end of the twentieth century and the beginning of the twenty-first, increasing ideological party branding, partisan sorting of the electorate, and the role of party activists, substantially tightened the tether applied by the national party on district candidates, widening the partisan gap at equilibrium and maintaining high partisan polarization in Congress – but this effect was especially pronounced among Republicans.
Discussion
Unlike most previous work on the ideological effects of party replacement, the emphasis in this paper has been on developing a model of electoral vulnerability. After noting that few seats in the U.S. House of Representatives change partisan control, we show empirically that, ceteris paribus, over time, districts that were ideologically more proximate to the opposite party, i.e. districts at the tail of one’s own party’s ideological distribution, were the ones most likely to experience a shift in partisan control. 16 We then looked in more detail at patterns of party replacement over two decades.
Our findings on party replacement effects both supplement and complement work such as Theriault (2006, 2008) and Lee and Godbout (2010). For the Republicans, we see a key cause of the growing conservatism as within-party replacements and rightward drift of existing incumbents while, for Democrats, polarization results almost entirely from between-party replacements. We have also shown that party losses and party gains will affect both between-party polarization and within-party ideological cohesion in a predictable way.
For recent decades, on balance, Democratic losses lead to increased polarization, since we expect such losses to be disproportionately from conservative districts. When Democrats make gains, however, we can expect to see some movement of their median back toward the right. Combining the information from Tables 1 and 2 we see that losing members of the Democratic Party are more conservative than are continuing Democrats, but the replacement Democrats are also more moderate than continuing Democrats. In short, gains are shifting the Democrats rightward, but losses are shifting them leftward. The time period studied (Tables 1 and 2) is one of net Republican gains, so the latter effect predominates.
For Republicans, losing or retiring incumbents are slightly more moderate than continuing members, but new members are not all that different from continuing members – both are conservative. The combination of these two effects generates a clear net rightward shift among the Republicans. Thus, gains or losses on the Republican side will have few direct observed effects on mean party location; what is most important will be the general rightward drift. In other words, when Democrats regain “lost seats” more toward the tail of their own (and the Republicans’) distribution, this can lead to an increased heterogeneity in the Democratic delegation. While the same is true, in principle, for Republicans, as we have seen, the steady rightward shift of Republicans as the center of gravity of the party shifts rightward has meant that replacement effects have few consequences for the mean ideological location of the Republican members of the House. 17 This result, to some degree at least, supports the argument of Mann and Ornstein (2012) that polarization is asymmetrical and it is largely the Republicans that have moved the needle with respect to polarizing political ideology in Congress.
We find that the evidence that moderate Democrats are more likely to be replaced by Republicans is much stronger than the evidence in the reverse direction. This is consistent with the observations of Mann and Ornstein (2012) that the Republicans are responsible for the lion's share of increasing polarization. One simple factor is that the narrowing of the intraparty ideological distribution due to a combination of within-party replacement effects and conversion effects (which are much stronger for Republicans than for Democrats), as well as between-party replacement effects, means that, statistically, it is much harder at present to distinguish moderate Republicans from other Republicans.
On the Democratic side, however, politicians are well aware of the consequence of the “chasing-the-other-party’s-outliers” phenomenon for the ideological coherence of their party, even if this term is not a standard one, either to journalists or in the political science literature. For example, as quoted by the political blog “The Hill,” (Berman and Hooper, 2010), House Energy and Commerce Committee Chair Rep. Henry Waxman, Democrat from California (D-CA) stated in advance of the election his belief that the November 2010 election, with its likely Democratic losses in the House, might weed out some of the “most difficult Democrats” that the Democratic leadership has to deal with. Here, clearly those Waxman is labeling “most difficult” are Democrats (recently) elected from previously Republican districts with a conservative voter base. These conservative districts were the most vulnerable to being (re)taken by the Republicans in 2010. And that is exactly what happened; Democratic losses in 2010 were concentrated in those districts. According to Berman and Hooper: “Waxman is simply voicing publicly what many in his party have said privately…if Democrats retain a majority it will be smaller and more cohesive.” 18 As it was, Democrats did not retain a majority in 2010, but the Democrats who were left were, in fact, both fewer and more cohesive, i.e. the Democrats who were left were also more likely to be on the left. The mean NOMINATE score for the 256 Democrats in the 111th Congress is –.345 with a standard deviation of .152. This compared to the 196 Democrats in the 112th Congress in which the mean is –.394 and the standard deviation is .131. A t-test for difference of means indicates this is statistically significant at the p < .001 level. The Democrats are fewer in number in the 112th Congress, but they are more liberal and less ideologically diverse.
Another contribution of this essay is in terms of the implications of the outlier-chasing model for unidimensional competition in which there is not only party convergence to the local median but also a strong influence of the national party position on what positions could, in the long run, be credibly espoused by a candidate of that party. We offer a simple analytic framework, but one allowing for differences in how each party reins in ideological diversity within the party, and that gives rise to an expected theoretical long term equilibrium in which, contra Downs (1957), we will not see centrist politics as the natural equilibrium of two-party competition along a single ideological dimension. Indeed, rather than puzzling about why so much polarization, our work suggests that the real puzzle is why it has taken so long to get to the level of polarization we presently enjoy.
Addressing this puzzle is, however, beyond the scope of the present essay, but we can suggest that the polarized equilibrium that is the “natural” result of outlier-capture politics does appear to depend heavily upon the assumption of unidimensionality. When politics is multidimensional, representatives may survive by taking a position on one dimension that partly compensates for their outlier status on the other dimension, so that the decline of a second dimension to political competition will make it easier for ideological sorting between the parties, and thus facilitate polarization. The combination of incumbency advantage and the multidimensionality of political competition might be the answer to this puzzle, with the post-Civil War role of race as an independent dimension slowly wearing off. 19
Footnotes
Acknowledgements
We are indebted to Keith Poole for making available to us the Poole–Rosenthal DW-NOMINATE data for the House for the period of interest. We are indebted to Clover Behrend-Gethard and Sue Ludeman for bibliographic assistance.
Declaration of Conflicting Interests
The author(s) declared no potential conflicts of interest with respect to the research, authorship, and/or publication of this article.
Funding
The author(s) disclosed receipt of the following financial support for the research, authorship, and/or publication of this article: The second-named author’s contribution to this research was supported by the Jack W. Peltason Endowed Chair at UCI, and under Social Sciences and Humanities Research Council of Canada (SSHRCC) Grant #410-2007-2153 to study “Political Competition” (co-Principal Investigator (co-PIs): Stanley Winer, and J. Stephen Ferris).