



Abstract
This article presents a unified framework that allows us to disentangle to what extent agents in proportional representation (PR) systems engage in the different strategies that the available voting models have separately suggested: ‘party’, ‘coalitional’, ‘bandwagon’ and ‘other’ voting (i.e. neither of the previous three). Results using data from multiple countries reveal that at least 75% of agents cast a sincere party vote. Around 10% of voters try to affect policymaking by casting a coalitional vote. Since most coalitional agents use their vote to ‘push’ coalitions away from the centre, extreme parties are the most benefited. Hence, strategic coalitional voting may increase rather than preclude fragmentation of a party system in PR contexts. Another 5% of voters support the expected winner regardless of their own party and coalition preferences. Finally, 5–10% of voters fall into the category of other types. The characteristics and motivations of each type are uncovered. Political sophistication increases the likelihood of sincere and coalitional voting. On the other hand, dissatisfaction with parties voted for in the past increases other voting. In particular, recent growth of European right-wing nationalist parties is shown to rely more on other voting and less on sincere and coalitional support.
Keywords
Introduction
Proportional representation (PR) systems offer incentives to agents to manipulate the outcomes of elections, that is, rational agents may prefer not to vote for their favourite party in the ballot booth (Baron and Diermeier, 2001; Cho, 2014; Cox, 1997). Such non-sincere voting may arise when agents cast their votes with policy outcomes rather than party platforms in mind.
Previous work has found that citizens do respond to such incentives. Kedar (2009) and Duch et al. (2010) have measured the proportion of party versus policy voting and found large proportions of each across countries. 1 A policy versus party model, however, neglects that there is substantial evidence of other types of motivations: bandwagon behaviour (voting for the expected winner) has been observed both in experimental settings (Hix et al., 2017; Morton and Ou, 2015) and in actual elections (Meffert et al., 2011). ‘Protest’ (Damore et al., 2012) or ‘punishing’ (Hix and Marsh, 2007) is other example of strategies that voters have been found to use. This article presents a unified framework of analysis that takes into account multiple potential strategies.
Standard binary models (party vs. policy, protest vs. sincere, etc.) have limited power to reveal the true underlying motivations of voters. Consider an individual who does not vote for her most preferred party: depending on the model one chooses to use, the same voter may be characterized as either a policy voter, a protest voter or a bandwagon voter. The unified framework presented here helps to disentangle all these types of behaviour and therefore identify the true rationale behind voter choices.
Such a framework is also relevant to the literature on electoral engineering, as it provides a more refined means of recovering the underlying true preference distribution from the distribution of seats in parliament. For instance, the fundamental ‘representation versus stability’ trade-off (Carey and Hix, 2011) may be endogenously alleviated if voters are found to engage in bandwagon behaviour (which ultimately results in stronger formateurs 2 ).
Following the literature, I denote as party types those voters who cast their vote solely based on their support for the different parties. Coalitional types are the voters who bear in mind the policy impact of their votes, that is, the potential effect on government formation and policy outcomes. Consistent with the previous work, I define front runner types as those who vote for the party they most expect to find in government after the elections. Finally, for lack of a better term, I denote as ‘other’ or ‘unaccountable’ any vote that can be qualified neither as a party, nor as a coalition, nor as a bandwagon vote. 3
This article proceeds in three steps. First, it measures the proportion of each type of voter in different countries that have a PR system. Second, it analyses the consequences of the distribution of types in terms of political representation and government policies. Finally, it seeks to identify the sociodemographic characteristics associated with each type. Special attention is drawn to uncover the characteristics that trigger other voting. To the best of my knowledge, this is the first article to use data from multiple countries to systematically analyse the correlation between socioeconomic characteristics and voting strategies in the context of PR systems. In particular, it is the first one to do so to uncover the individual socioeconomic and attitudinal characteristics related to other types.
To accomplish this, I employ pre-electoral survey data from the following legislative elections: Austria (2006), Germany (2009 and 2013), Israel (2006) and the Netherlands (2006 and 2010). These surveys are unique in that they asked respondents about the likelihood and desirability of several different coalitions. This critical aspect is what allows me to create a novel measure of the evaluation of the expected policy impact of voting for each party for every single individual.
Results show that coalitional voting fluctuates between 5% and 30% of the population. Furthermore, 5% of voters support the front runner, irrespective of their preferences, and around 5–10% of voters cast an other-type vote.
The proportions of front runner and other types are directly comparable to the full PR treatment in Hix et al. (2017) for a lab setting. The proportion of coalition types is non-negligible but overall smaller than what Duch et al. (2010) find. This is not only due to the inclusion of more types, but also to the measurement of preferences: whereas this article uses direct preferences for parties and coalitions, Duch et al. (2010) infer them from left–right distances.
Counterfactual exercises show what would happen if the fraction of coalition voters were to increase. More extreme parties would radically benefit from this. These patterns reveal some sort of directional preferences among the whole set of voters à la Rabinowitz and Macdonald (1989) 4 : the vote shares of the ‘leftist’ block versus the vote shares of the ‘rightist’ block remain nearly unaltered. In terms of political impact, minor changes in the proportion of coalitional voting could have had critical consequences for coalition formation in Austria and Germany, whereas it seems less likely that it could have had any impact in the Netherlands or Israel.
Furthermore, this article generalizes what Meffert and Gschwend (2010) find for Austria 2006: contrary to what intuition may suggest, ‘sincere’ voting may actually reduce the degree of parliamentary fragmentation in PR contexts. When supporters of big parties choose to cast a strategic vote for smaller parties in order to help them clear the electoral threshold or pull eventual government policies in a particular direction, they are indirectly increasing the effective number of parties.
Finally, this article sheds light on the correlation between socioeconomic characteristics and types of voters. I find that less politically sophisticated individuals are more likely to cast a bandwagon or other vote. This is consistent with the findings of Meffert et al. (2011), but contradicts the lack of correlation between degree of political sophistication and coalition voting found in Blais et al. (2006a).
The last section is devoted to understanding what lies behind other voting. Previous work has shown that voter discontent may result in voting against incumbents in European Parliament elections (Hix and Marsh, 2007) and in a variety of forms of abstention/vote spoiling (Damore et al., 2012; Kang, 2004; Stockemer et al., 2011) that proposes a model for plurality systems in which voter dissatisfaction with preferred parties results in either abstaining or casting a vote for a non-preferred party. I check whether these predictions also apply in a PR setting. Results show that increased dissatisfaction with government performance among individuals who voted for such government parties in the previous elections increases the likelihood of other voting, but not that of abstention. Moreover, abstentionists display much larger levels of political disengagement and political cynicism than other voters. Last, this article shows that the recent growth of right-wing nationalist parties in Europe can largely be attributed to votes that appear to be protest votes, rather than sincere, coalitional or front runner votes.
The data
I use pre-electoral survey data from four countries with PR parliamentary systems: Austria (2006), Germany (2009 and 2013), Israel (2006) and The Netherlands (2006 and 2010). In each of these countries, citizens elect all members of parliament, and parliament, in turn, appoints the Prime Minister and the national government. Thus, with a single vote, citizens shape the composition of the legislative body (directly) and the policies of the executive body (indirectly). Online Appendix 1 gives details on the electoral system for each country. These six surveys included in my data set are the only ones available that specifically include questions on coalition expectations and preferences, which are key to this study.
Description of the data
The pre-electoral surveys I use are all publicly available. Online Appendix 2 provides the sources and technical details. In general, the wording of the key coalition questions is as follows: (i) ‘How much would you support a coalition between X, Y and Z, from 0 (no support at all) to 10 (complete support)?’ and (ii) ‘How likely do you believe a coalition between X, Y and Z is, from 0 (not likely at all) to 10 (surely to be formed)?’ for various combinations of parties. All surveys include the usual battery of questions regarding intended vote, political preferences and socioeconomic background.
The samples used include only individuals who voted for a party that had some chance (however small) of entering government after the elections. Hence, results presented in this article represent the upper-bound measure for coalitional voting. Although the specific models are different, this strategy is in line with that of Duch et al. (2010) and Meffert et al. (2011).
Since results rely on subjective electoral expectations, it is important to show that voters are indeed accurate at making predictions. In all six cases, on average, respondents’ predictions were remarkably accurate. Online Appendix 3 discusses this in detail.
Theoretical framework
The previous literature has generally assumed two types of voters, according to how they respond to the strategic incentives posed by the system. Party types (also known as sincere voters) vote according to how much they like the different parties, disregarding any strategic incentives. Following the literature on PR systems (Duch et al., 2010; Indridason, 2011; Kedar, 2009), I denote as coalitional voters those agents who take into account the potential effects their votes may have on coalition formation and, therefore, actual policies. Note that a coalitional voter may vote for her preferred party once she has made her calculations.
There are various reasons why a voter may cast a coalitional vote. 5 Since, in PR systems, governments tend more often than not to be coalitions, an agent may cast her vote in order to tilt government policy towards her favourite policy. For instance, to signal coalition preferences if the government coalition is uncertain. Even if an agent is sure that a particular coalition will be formed, she may have an incentive to act strategically. This is the case when she uses her vote to increase the bargaining power of a party within that coalition. Indridason (2011) shows that all these motives can be endogenously derived from a common theoretical framework.
In this article, I include a third type: the front runner type. There is ample evidence of bandwagon behaviour both in experimental settings and in actual elections. There may be various reasons for voters to jump on the bandwagon: psychological (feeling that one rightly voted for the winning side, Callander (2007)), informational (inference of the quality of the front runner candidate from the perceived electoral behaviour of others, Blais et al. (2006b)), altruistic (voting for a morally appealing alternative, which Morton and Ou (2015) call other-regarding behaviour) or even instrumental (preference for creating a more stable government).
The definition of bandwagon behaviour in a PR system is not, however, immediately apparent: What does voting for the front runner really mean in such contests? Here, I follow Blais et al. (2002) and Meffert et al. (2011) and define the bandwagon effect as voting for a party that is predicted to be almost surely in government. 6 In practical terms, I define front runner as the party with the highest chance of being in government after the elections, as perceived by the voter.
I would like to note that, contrary to a large body of literature on empirical voting behaviour, I do not consider strategic voting (in this case, coalitional voting) and sincere voting to be mutually exclusive. This is not novel: Duch et al. (2010) and Cho (2014) build on models that allow strategic and sincere voting to be equivalent. 7 The advantages of following this approach are twofold. First, from a game-theoretical point of view, it allows us to recover the model primitives. The literature that defines sincere and strategic voting as mutually exclusive bases the analysis on equilibrium results. In other words, if all voters aim to act strategically but half of them, after all calculations, end up voting for their most preferred party, then, by construction, we can only estimate the proportion of strategic voters to be 50%. Using a tool that allows us to estimate the probability of the underlying motivation when this is not observed (the expectation–maximization (EM) algorithm, described below), we can recover the proportion of the population who aim to be strategic, regardless of who they end up voting for. Second, the framework presented here allows us to test whether the assumption that ‘votes for the voter’s most preferred party are immediately sincere votes’ holds true. 8
Statistical model
I assume a random utility model as in Duch et al. (2010). Let
Finally, let xi be a vector of sociodemographic characteristics and ∊ij the unobservables that influence i’s vote. Then, i’s utility of voting for j is

where
Previous work (Bargsted and Kedar, 2009; Duch et al., 2010) has based the measures of PT and CL on distances within the left–right political spectrum. The advantage of having direct information on coalition expectations and preferences is that PT and CL do not have to be proxied by any function of the distance between voters and expected party and coalition policies. Since the seminal work of Uhlaner and Grofman (1986), it has been well established that expectations are not independent of preferences. Given that I infer party probabilities from coalition expectations instead of using direct assessments of party probabilities, the measure I use is less likely to be contaminated. The Section 3.1 in Online Appendix 3 shows that the effect is minimal in the samples used in this article.
Let yi = (y 1, y 2,…, yJ ) denote the vote cast by an agent i, that is, yij = 1 if i votes for j and 0 for otherwise. Each agent decides her vote in order to maximize her utility, so that

(in case of a tie, the agent decides randomly).
Estimation strategy: EM algorithm
Given the assumption of three types, this is a finite mixture model in which the number of mixture components is three. I denote with π the vector of mixing weights, or vector of unconditional probabilities that an agent is of each type τ. 9 This is the main parameter of interest. Given that the individual type is unobserved, I use the EM algorithm as first described by Dempster et al. (1977). 10 For details, see Online Appendix 5.
Results
Multiple-type model: Proportion of each type
Table 1 presents the results. The proportion of coalition voters is around 5–20%. This is in line with the empirical literature, which establishes that coalitional voting is indeed existent in PR systems (Bargsted and Kedar, 2009; Blais et al., 2006; Duch et al., 2010; Kedar, 2009; Meffert et al., 2011). In particular, the fraction of coalition voters is, on average, smaller than the fractions estimated by Duch et al. (2010). The main reason for the discrepancy is the construction of party (PT ij ) and party-coalition (CL ij ) evaluations, which Duch et al. (2010) infer from left–right distances. Note that my model is imposing three types: If a voter did not follow any of these strategies, she is still assigned a probability of belonging to each type. I relax this below and discuss the proportion of other types in the population (i.e. individuals who did not cast a party, coalitional or front runner vote). 11
Multiple-type model: party, coalition and front runner voters.
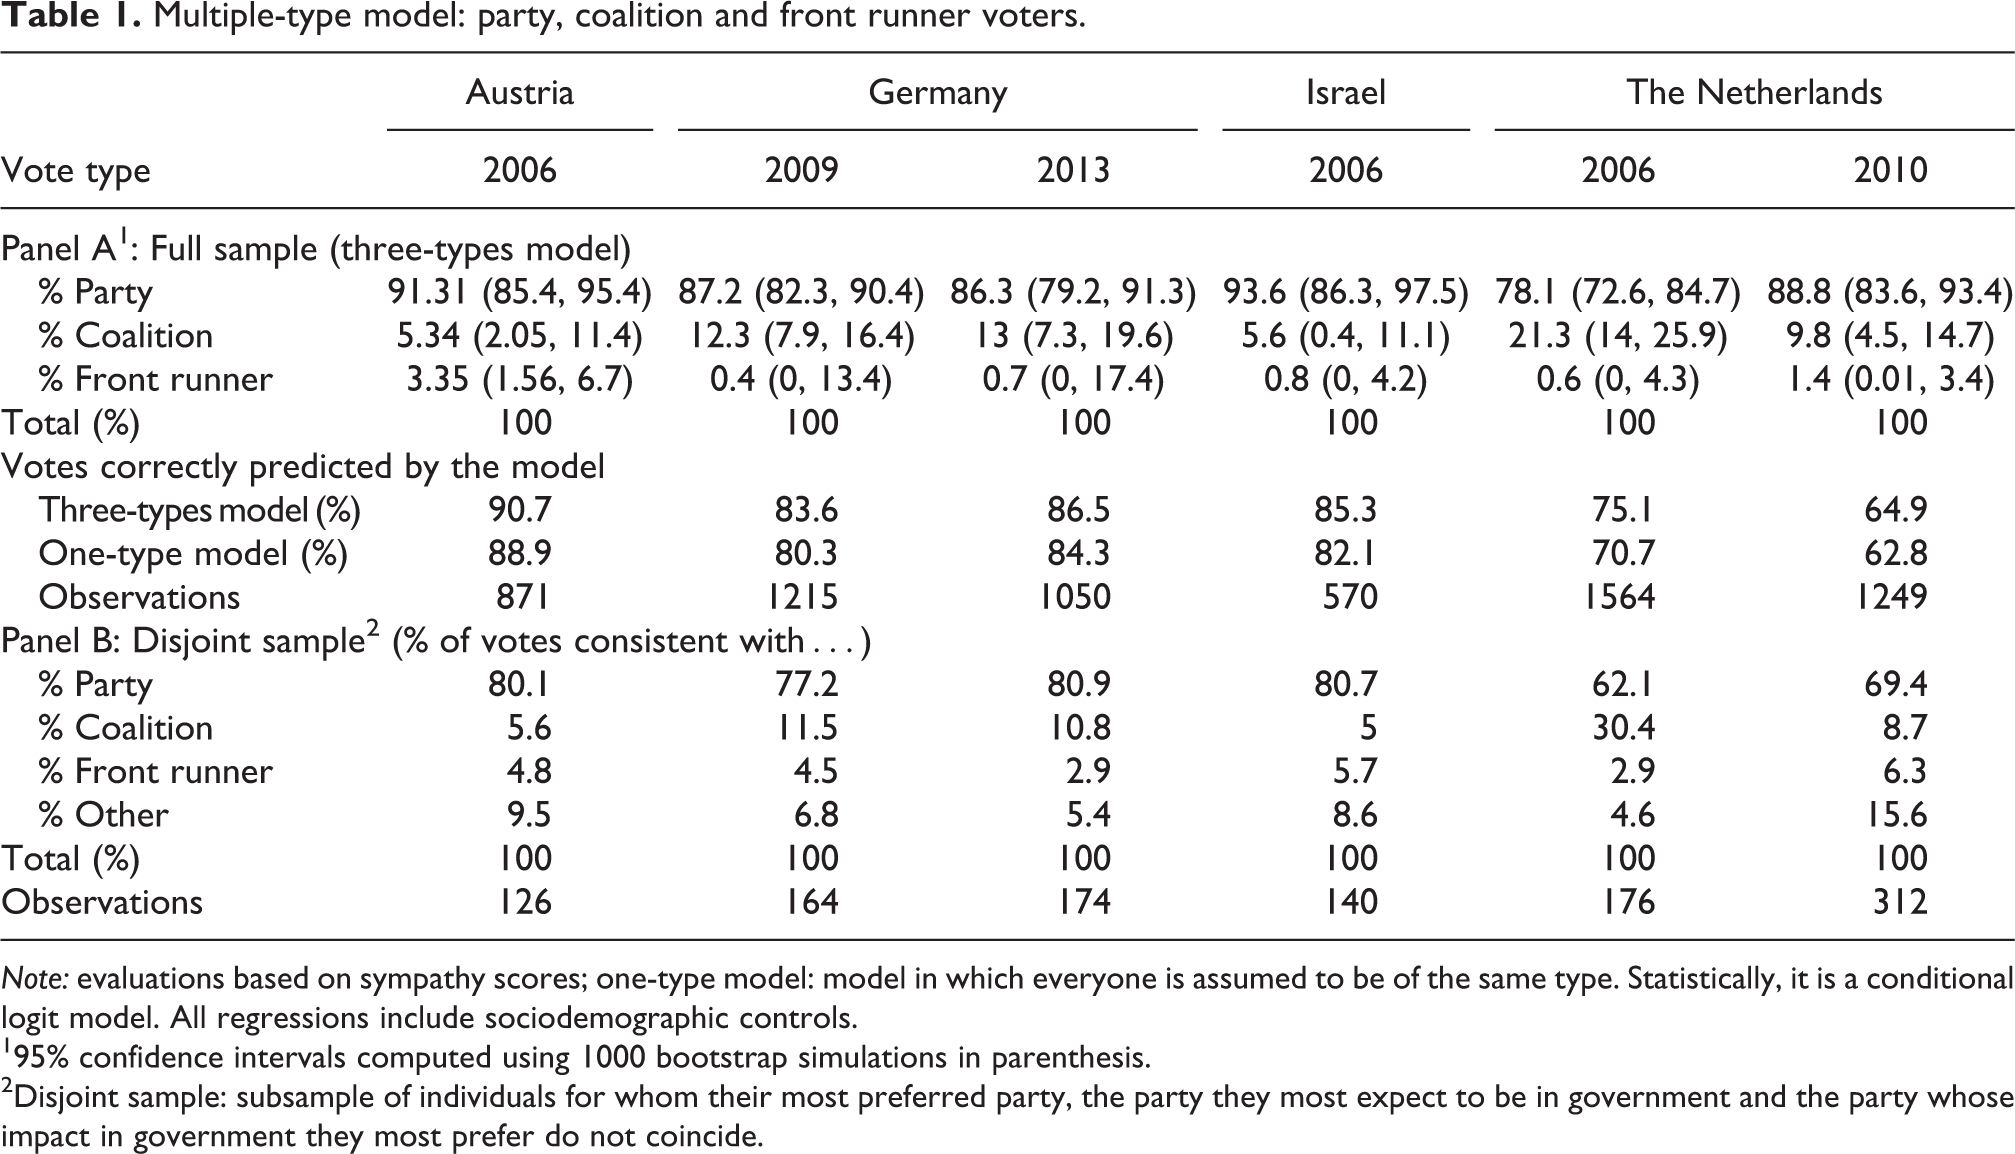
Note: evaluations based on sympathy scores; one-type model: model in which everyone is assumed to be of the same type. Statistically, it is a conditional logit model. All regressions include sociodemographic controls.
195% confidence intervals computed using 1000 bootstrap simulations in parenthesis.
2Disjoint sample: subsample of individuals for whom their most preferred party, the party they most expect to be in government and the party whose impact in government they most prefer do not coincide.
Individuals whose vote could be consistent with being of any type (party, coalitional and front runner) could affect the precision of the estimation of the main parameter of interest π. In order to check the robustness of these results, I re-estimate the proportion of each type using only the subsample of voters for whom their most preferred party, the party they most expect to be in government, and the party whose impact in government they most prefer do not coincide. Since, for these agents, the set of ‘best’ alternatives is disjoint, I denote this subsample as ‘disjoint sample’ in the remaining. Panel B in Table 1 reports the results. Furthermore, Table 3 in Online Appendix 4 shows the results using a ‘partially disjoint’ sample (i.e. only discarding votes that may be classified both as party and coalitional).
Results using both the disjoint and the partially disjoint sample are consistent with those using the whole sample. Two patterns are worth highlighting: (i) the set of voters who show bandwagon behaviour is small but non-negligible and (ii) most importantly, the disjoint subsample shows that there is a critical number of citizens whose voting strategies are completely unaccounted for (5–15% of individuals). 12 This reveals that our models still do not fully capture the richness in strategies used by the entire population.
Finally, I include the percentage of correct predictions. This is done as a means of comparison of a multi-type model versus a homogeneous type model in which all agents are assumed to have the same preferences for party, coalition and front runner considerations (statistically, a conditional logit model). In line with the results of Duch et al. (2010), a type model is shown to have better predictive power than a homogeneous-type one.
Counterfactual: All voters cast a coalition vote
What are the consequences of such a distribution of types? One way to look at it is to check what would happen if the proportion of coalitional voters increased exogenously. I do this exercise twice, assuming (i) a radical shift: all voters cast a coalitional vote and (ii) a much softer change: one in four party voters cast a vote as if they were coalitional voters.
The approach when doing this exercise is decision theoretic. Assuming the observed outcomes are equilibrium outcomes, one could imagine that if 10% of voters suddenly switched their strategy, expectations of all voters would change, thereby resulting in an updated strategy profile for most voters. In this sense, counterfactual results are not equilibrium results, but they give us a sense of the change in election results derived from a change in the proportion of types.
For the ‘soft’ counterfactual (ii), I carry out 10,000 simulations. In every simulation, the vote of each individual classified as a ‘party type’ has a 25% probability of being switched to what she would have voted as a coalitional type. Table 2 presents the average of these 10,000 simulations.
Counterfactual: comparison of actual vote shares (from surveys) with vote shares (i) with a small but significant increase in the proportion of coalitional types and (ii) if all voters were to cast a coalition vote.

Note: CDU: Christian Democratic Union; CDA: Christen-Democratisch Appèl [the Netherlands, Christian Democratic Appeal]; ILM: Ichud-Leumi Mafdal [Israel, National Union]; SP: Socialist Party; CSU: Christlich-Soziale Union; SPD: Sozialdemokratische Partei Deutschlands; VVD: Volkspartij voor Vrijheid en Democratie; PVV: Partij voor de Vrijheid Appèl [the Netherlands, Party for Freedom]; FDP: Free Democratic Party; Small increase of coalition voters: calculated over 10,000 simulations. In each simulation, every individual classified as a party voter has a 25% probability that her vote will be switched to what it would have been had she been a coalitional voter. Results presented are the average of the resulting vote shares after 10,000 such replications. Parties ordered from (left) most leftist to (right) most rightist, according to the mean placement of all survey respondents.
The most obvious lesson from both counterfactuals is that non-centrist parties would more often than not be formateurs were everyone to cast a coalitional vote. Small parties gain from coalitional voting because, in most cases, they can reasonably be expected to be only in one coalition. Imagine a leftist voter (call her il ) who casts a sincere vote for a moderate left party, which she much prefers to all other ones. However, suppose that il believes that this moderate left party may be in two coalitions with equal chances: one with the far left party and another one with a centre-right party. She much prefers the leftist coalition than the centrist one. If we assume that the far left party can only enter that particular coalition, then, if il is to cast a coalitional vote, she will certainly choose the far left party. This is because her coalition evaluation of the moderate left party drops due to her fear that it can strike a deal with the centre right. This is consistent with the compensatory logic in Kedar (2005): given that voters mostly expected coalition governments to be at the centre of the spectrum overall, they perceived that the most likely way to affect coalition policies was to vote for a party further to the extreme (be it to the left or the right). 13 Hence, small radical parties are the winners with coalition voting. This is also in line with the findings in Kedar (2009).
On the other hand, if only a fraction of party voters switched to coalition voting, the ordinal ranking of parties would not change. The formateur would generally remain the same. However, small vote swings could result in significant changes in parliamentary representation. As an example, leftist Meretz in Israel in 2006, the Socialist Party in the Netherlands in 2010 or liberal Free Democratic Party (FDP) in Germany in 2013 would have roughly doubled their vote share.
Discussion
The relatively small proportion of coalitional voters had sizeable implications in several instances. One case in point is Germany. Liberal FDP won 14.6% of the votes in 2009 and entered a coalition government with the Christian Democratic Union (CDU, popularly known as the black–yellow coalition). However, throughout the electoral campaign of 2013, pre-electoral polls made it evident that the FDP was not guaranteed to make the 5% electoral threshold. In an attempt to secure its presence in parliament, the FDP appealed to CDU supporters who wanted to repeat the black–yellow coalition to vote for them (this is what Meffert and Gschwend (2010) call a ‘rental vote’). 14 The FDP leadership indeed succeeded in this: the likelihood of being a coalitional type for the typical FDP voter in 2013 was 57%, three times more than for any other party (and nearly four times more than in 2009). What nonetheless critically damaged the FDP’s chances was the dramatic decrease in sincere support: whereas 16% of the population placed the FDP as their favourite party in 2009, only 4.6% did so in 2013. Eventually, the FDP came up short, winning 4.8% of the votes.
Results in Table 2 further confirm this: A marginal increase in the fraction of coalitional voters would have sufficed for the FDP to comfortably surpass the 5% threshold. In short, if the coalitional appeal of the vote for FDP had been marginally more successful, or, in other words, if the vast majority of the German voting population had not relied on sincere voting, the colour of the government formed in Germany in 2013 could have been radically different.
Coalitional voting also had considerable implications in Austria 2006 in a similar fashion. Rightist Bündnis Zukunft Österreich (BZÖ) won 4.11% of the popular vote, just enough to clear the 4% electoral threshold. Table 2 suggests that the minimal vote transfer from coalitional voters who supported Christian-democratic: Österreichische Volksparte (ÖVP) to BZÖ may have been crucial for the latter to overcome the threshold. The policy impact could have been of great consequences had a BZÖ + ÖVP coalition been formed. However, eventually the ÖVP and social democratic Sozialdemokratische Partei Österreichs (SPÖ) formed a grand coalition. 15 On the other hand, it is harder to state that small increases in the relative size of coalitional voters would have changed government coalitions in the Netherlands. The year 2010 is the paradigmatic case: It was not clear whether the government resulting from the elections would be a leftist one led by PvdA (the labour party), or a liberal/rightist one led by liberal Volkspartij voor Vrijheid en Democratie (VVD). Post-election talks ended in a coalition government of VVD with Christian-democratic CDA (with external support from right-wing populist PVV). Table 2 suggests that, had the size of the coalitional vote been larger, vote transfers would have occurred within blocks (leftist and rightist), so plausibly the same coalitions would have been negotiated, with perhaps only small differences in portfolio allocation of the resulting government.
Israel, too, would have been unlikely to be affected by small changes at the margin. For instance, unambiguously leftist Meretz would have easily doubled its share of seats in the Knesset. However, this might not have significantly increased its chances of being part of a coalition: All governments formed during the decade leading up to 2006 easily included a wide variety of parties, big and small, from both the left and the right, averaging more than five and sometimes including up to nine parties. Participation in government seems less correlated with seat shares in Israel than in the other countries in this study.
More generally, the counterfactual exercise reveals that a small increase in the number of coalition types would mostly result in a vote-swap within blocks: Parties to the right would be stealing votes from parties to the moderate right, and likewise on the left. Parliaments would look (even) more fragmented overall. These patterns reveal some sort of directional preferences among the whole set of voters as in Rabinowitz and Macdonald (1989). Hence, counterintuitive as it may seem, sincere voting may actually reduce the number of effective parties in parliament in PR systems.
Can we predict the type?
I next examine what political or sociodemographic characteristics are associated with each type of voter. I use the disjoint sample for each of the six elections since, for identification, a vote must be unambiguously classified as a party vote, a front runner vote, a coalitional vote or none of these (other or ‘unaccounted’ vote). I use the following multinomial logit:

where Xi is the set of socioeconomic characteristics and political attitudes of the voter. It should be noted that in focusing solely on the disjoint sample, one could be introducing sample bias. This set of voters might be unusual in some way – we could, for example, be looking at the set of voters who do not like the front runner(s). Table 7A in Appendix 7 shows that results are consistent when using the full sample. 16
Panel A in Table 3 shows the results. Political knowledge and level of education have the effects one would expect. With different degrees of significance, they are positively correlated with coalitional voting and negatively correlated with ‘front runner’ and other voting (Germany 2013 is the exception). Reading newspapers frequently seems to have an ambiguous effect on coalitional voting. However, it does seem to reduce the likelihood of casting an other-type vote.
Socioeconomic characteristics and political attitudes of coalitional voters, front runner voters and voters whose strategy is unaccounted for.

Note: CL: coalition type vote. FR: front runner type vote. UN: voting strategy unaccounted for. Base Category: party vote; ⊖: negative and significant effect at a 5% or 1% level (−: at a 10% level); ⊕: positive and significant effect at a 5% or 1% level (+: at a 10% level); ·: not significant; empty cell: no data or not used due to excess loss of observations; Other controls included: regional dummies, country of birth, household size and religious observance. Sample: subsample of voters for whom the top party in terms of direct preferences, the top party in terms of coalition preferences and the front runner do not coincide. Extremist: (LRself−5)2, where LRself = self-placement in the left–right political spectrum, from 0 (left) to 10 (right). Freq. papers: frequency of reading newspapers (for Austria: frequency encountering polls). Party ID: from 0 (none) to 3 (strong). Certainty vote and turnout are continuous variables that capture the probability of voting for the party they state and of turnout, respectively. Timing decision: the larger the value, the closer to election date. Att. polls: captures frequency of encountering and perceived accuracy of polls. # orgs.: number of professional or social organizations to which the respondent belongs.
Panel B in Table 3 shows that, not surprisingly, strength of party identification increases the likelihood of party voting with respect to all other types, and so do certainty of turnout and certainty of the direction of the vote. Interestingly, the later the decision is made, and the later in the day one shows up in the polling station, the more likely the vote is not captured by one of the three main strategies discussed in the literature. Results in Bagues and Esteve-Volart (2016) suggest that front runner voting could be more prominent among those happy with the economic situation or the democracy. I find no consistent evidence in this respect, though.
Discussion
Using data for Austria 2006 and Germany 2005, Meffert et al. (2011: 801) find that ‘[o]nly voters with a sufficient level of political knowledge should have the ability to engage in such strategic (coalition) voting’. The findings in this article support this. More broadly, however, what Table 3 reveals is that politically sophisticated voters are unambiguously more prone to both party and coalition voting, and much less likely to vote for the front runner or cast an other-type vote. Prevalence of party voting among sophisticated voters is in line with the literature on motivated cognition and projection bias: highly sophisticated partisan individuals are more likely to capture positive partisan signals (see, e.g. Andreoni and Mylovanov, 2012; Kahan, 2013; Lord et al., 1979 and the literature cited therein), and therefore more likely to cast a party vote.
I discussed the motivations behind party, coalitional and bandwagon voting in Section 3. However, little is known about the motivations of those who cast a vote that most standard theories cannot yet rationalize. The next section attempts to explain these votes.
What triggers an other-type vote?
As discussed in the introduction, research has shown that voter discontent may result in voting against incumbents or in a variety of forms of abstention/vote-spoiling. Kang (2004) adapts the Hirschman (1970) model of ‘exit and voice’ to the political arena, proposing a similar model for plurality systems in which voter dissatisfaction results in either abstaining or casting a vote for a non-preferred party. The framework presented here is ideal for checking if dissatisfied voters resort to other votes or abstention. I use the following multinomial logit:

where
Results are presented in Figures 1 and 2 (note that only the interactions are reported). These show that Kang (2004) is partially right: Dissatisfaction with the incumbent seems to increase the likelihood of other voting, conditional on having voted for it in the previous election. However, dissatisfaction does not seem to increase abstention.

Probability of abstaining or casting an other-type vote, by sociodemographic characteristics and by level of dissatisfaction with the incumbent. See expression (4) for the exact regression specification. ‘Dissatisfaction’ measure – Austria 2006 (e) and (f): 10 = Party preference is ‘absolutely not’ and 0 = Party preference is ‘absolute’; Germany 2009 (a) and (b): 10 = Totally dissatisfied with work in government and 0 = Totally satisfied. Political cynicism – Germany 2013 (c) and (d): ‘parties only want to win elections’ (1 = Definitely disagree and 5 = Definitely agree). Don’t Know (DK) parents ideology – Answers don’t know when asked for mother or father party support (0 = Knows both, 1 = Knows one and 2 = Knows none). Other controls included – regional dummies, household size and size of town of residence. When variables are not shown in panel B, it is because they are not available in the survey.
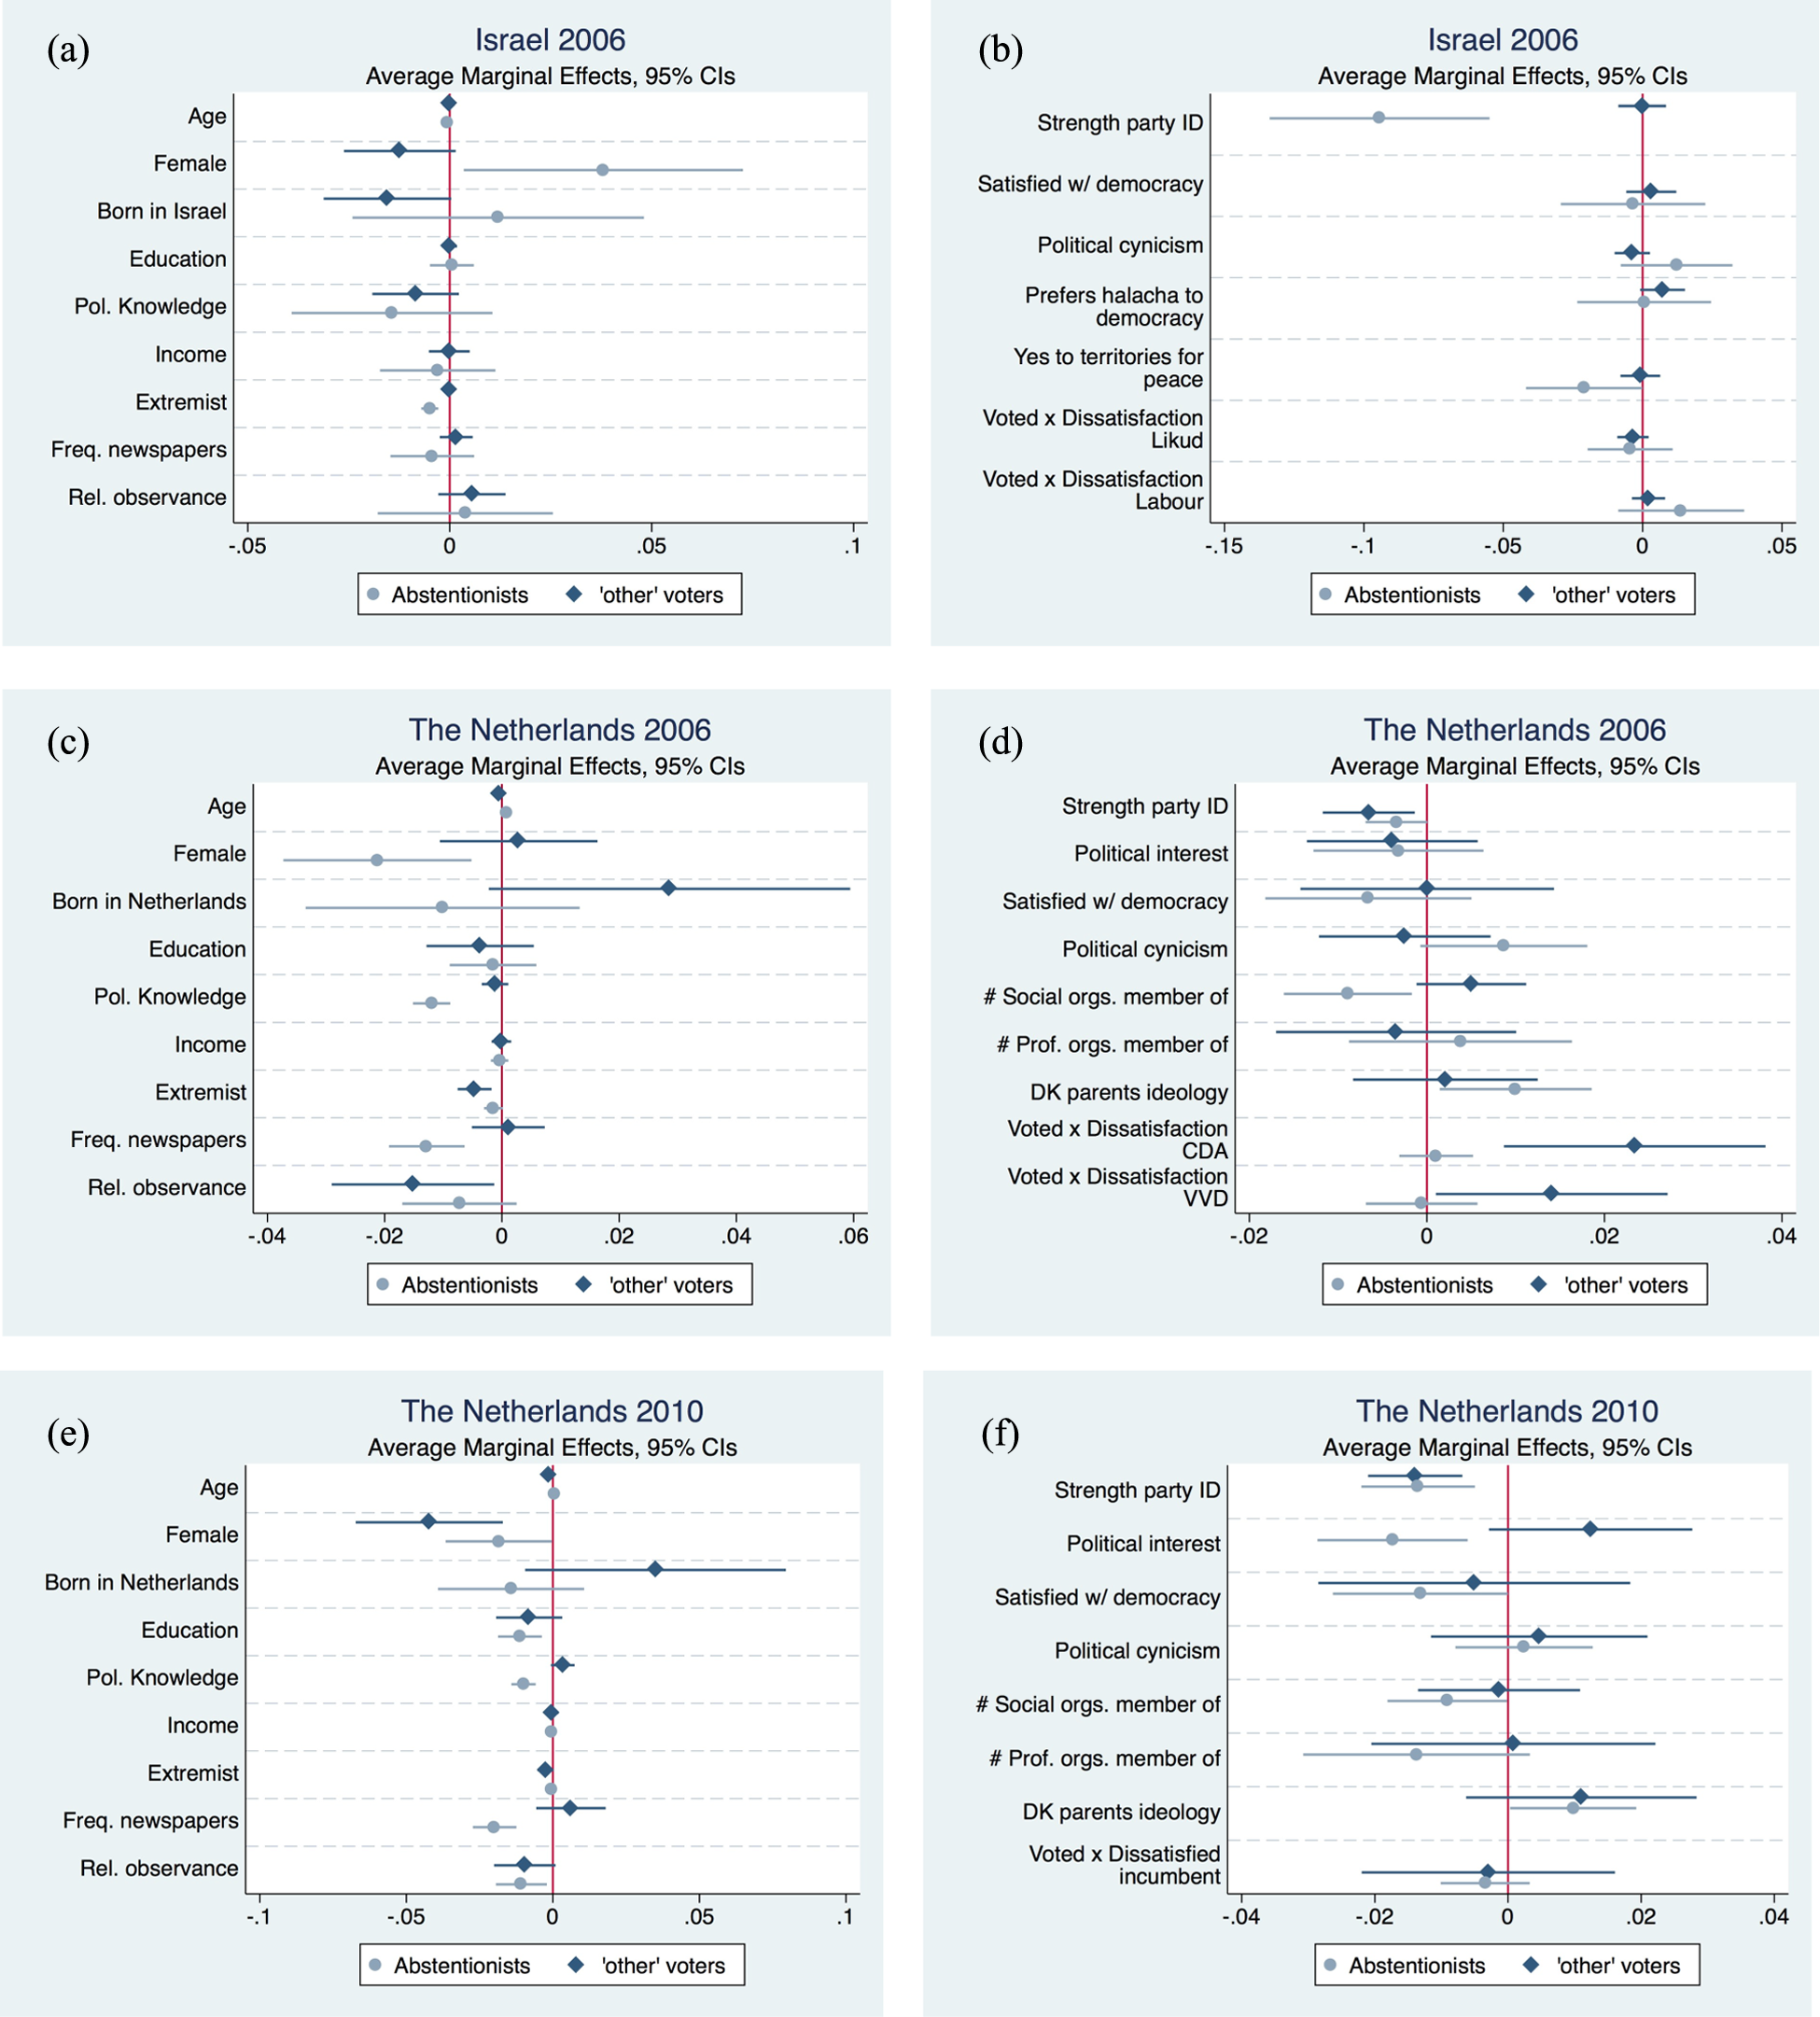
Probability of abstaining or casting an other-type vote, by sociodemographic characteristics and by level of dissatisfaction with the incumbent. See expression (4) for the exact regression specification. ‘Dissatisfaction’ measure – Israel 2006 (a) and (b): 10 = Hate/rejection of the party and 0 = Love/support; the Netherlands 2006 (c) and (d): 10 = Very unsympathetic and 0 = Very sympathetic. Political cynicism – the Netherlands 2010 (e) and (f): 1 = Low and 4 = High. Israel: ‘politicians ignore citizens’ (1 = Definitely disagree and 4 = Definitely agree), given the small number of abstentionists and other voters among former voters of incumbents CDA, PvdA and ChristenUnie (CU, the Netherlands, Christian Union), former voters of these parties have been grouped together. DK parents ideology – Answers don’t know when asked for mother or father ideology during childhood (0 = Knows both, 1 = Knows one and 2 = Knows none). Other controls included – regional dummies, household size and size of town of residence. When variables are not shown in panel B, it is because they are not available in the survey.
More generally, Figures 1 and 2 reveal that individuals whose vote we cannot easily rationalize are quite different from individuals who do not turn out to vote. Overall, abstentionists have lower educational levels, lower political knowledge, read newspapers less frequently, are less satisfied with how democracy works, are less involved in social and cultural non-governmental organizations (NGOs) and declare both lower levels of interest in politics and higher levels of cynicism versus politics. The only features in which these agents bear some resemblance are in having a weak sense of party identification, and being less extreme ideologically. Even though other voters use strategies we cannot fully account for, they are far from having the levels of political disengagement typical of non-voters.
If we follow Myatt (2015) and Kselman and Niou (2011) in thinking of a protest vote as ‘a targeted signal of dissatisfaction to one’s most-preferred political party’, what this suggests is that some discontented voters derive higher utility from casting a seemingly protest vote rather than from abstaining.
An interesting question that arises is whether the recent rise in right-wing/nationalist parties in Europe somehow benefits from a particular type of strategy among voters. In two of the elections in this study, such parties were perceived as potential coalition members and hence were introduced as such in the surveys. 17 These were Freiheitliche Partei Österreichs (FPÖ) and BZÖ (Austria 2006) and PVV (the Netherlands 2010). Figure 3(a) and (b) shows the increased likelihood to vote for these parties conditional on the vote being coalitional or other (regressions include all relevant controls).
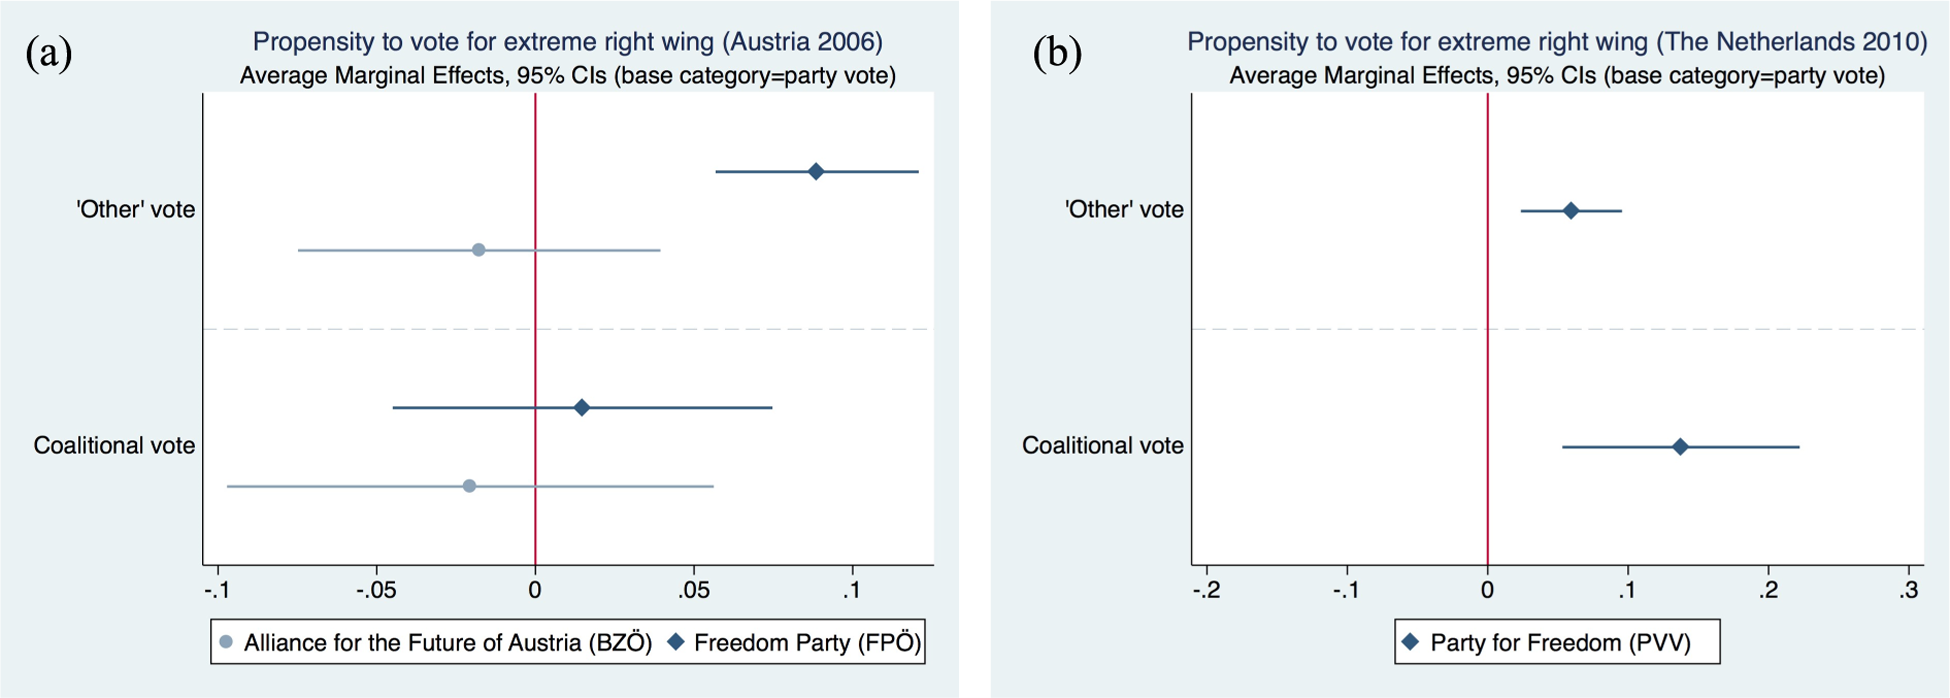
Increased probability that a vote is for an extreme rightist party when it is a coalitional or an ‘other’ vote (base category: party vote). (a) Austria 2006. (b) The Netherlands.
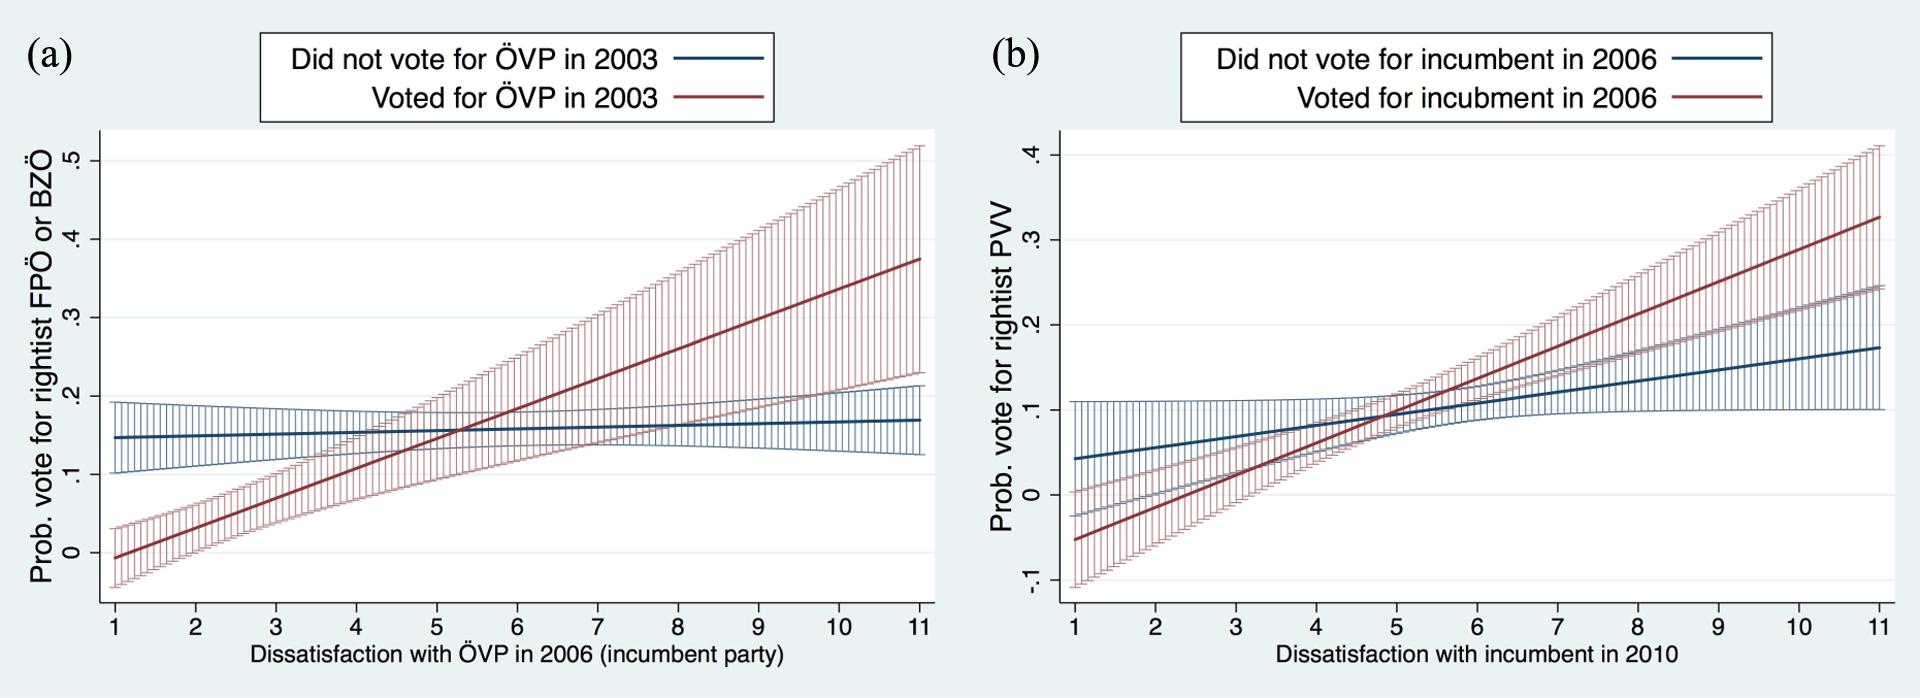
Probability of voting for an extreme rightist party as a function of dissatisfaction with the current incumbent. (a) Austria 2006. (b) The Netherlands, incumbent parties at the time of the 2010 elections: CDA, PvdA and CU.
Whereas evidence is ambivalent regarding the coalitional motive behind voting for such parties, what seems unambiguous is the fact that, generally, these parties receive relatively less amount of sincere and front runner support. 18
Concluding remarks
This article presents a unified framework that allows us to disentangle to what extent agents in PR systems use the different strategies that the available voting models have separately suggested. Results using this model reveal that around 1 in 10 individuals who turn out to vote use strategies that are not immediately rationalizable. For a third of these (the front runner voters), we can identify their strategy but not the true underlying motives behind their choice. For the other two-thirds, even less is known. Evidence presented above suggests that disappointed and upset voters are more likely to resort to voting for parties that do not seem to yield them the highest utility by any means. Dissatisfied voters, however, are not more likely to abstain. In terms of socioeconomic background and political engagement, I find that individuals whose votes we cannot categorize are quite different from individuals who do not turn out to vote. Experimental lab design and brain Functional magnetic resonance imaging or functional MRI (fMRI) brain imaging could shed some light on these issues in the near future.
Second, this article shows that when using observable (stated) measures of party and coalition preferences, the proportion of coalitional voters is smaller than what has previously been found. This suggests that the policy component behind people’s votes may have been overrated. Third, though it is not conclusive, the evidence presented above hints at the fact that different groups may be strategizing about the electoral system in different ways. Since small twists in PR systems may result in dramatic government changes, such systems may be implicitly giving an advantage to better-organized and more sophisticated agents. In particular, one interesting avenue of research will be to find out to what extent country-specific customary practices on coalition formation may ultimately deter coalitional voting, as suggested by the case of Israel.
Furthermore, results in this article shed some light on the increasing support for right wing nationalist parties: even where these parties have become key actors in the political arena, their sincere and coalitional support is relatively small as compared to that of other parties. These extremist parties seem to attract votes that appear to be protest votes much more easily than any other party. Further research should uncover more about the underlying rationale behind these votes.
Finally, this article generalizes what Meffert and Gschwend (2010) find for Austria 2006: Contrary to what intuition may suggest, strategic voting can contribute to a higher degree of parliamentary fragmentation when electoral thresholds exist. This suggests that electoral engineering that aims to facilitate stable party systems and stable coalition governments may not necessarily benefit from larger electoral thresholds. Unpacking the relationship between electoral thresholds, voting strategies and effective number of parties may prove a critical step towards a better understanding of the implications of PR systems.
Supplemental material
Supplemental Material, PPQ668669_Appendix - Do citizens vote for parties, policies or the expected winner in proportional representation systems? Evidence from four different countries using a multiple-type model
Supplemental Material, PPQ668669_Appendix for Do citizens vote for parties, policies or the expected winner in proportional representation systems? Evidence from four different countries using a multiple-type model by Guillem Riambau in Party Politics
Footnotes
Declaration of Conflicting Interests
The author(s) declared no potential conflicts of interest with respect to the research, authorship and/or publication of this article.
Funding
The author(s) received no financial support for the research, authorship and/or publication of this article.
Supplemental material
Supplemental material for this article is available online.
Notes
References
Supplementary Material
Please find the following supplemental material available below.
For Open Access articles published under a Creative Commons License, all supplemental material carries the same license as the article it is associated with.
For non-Open Access articles published, all supplemental material carries a non-exclusive license, and permission requests for re-use of supplemental material or any part of supplemental material shall be sent directly to the copyright owner as specified in the copyright notice associated with the article.
