



Abstract
Does politics impact happiness? This paper evaluates how being a political “winner” or “loser” – whether one’s preferred party controls government or not – is linked to multiple measures of life satisfaction. Using Gallup survey data on self-reported well-being for Democrats and for Republicans within the U.S. states for 2008–2016 (a time period when party control of government changed in several states) and a difference-in-difference model with two-way fixed effects, I find consistent evidence that citizens report lower levels of well-being when the opposing party controls state government. The substantive effect is particularly large for Democrats living in Republican controlled states. Conversely, there is little evidence that citizens’ well-being is boosted when their own party controls state government. These findings have important implications for our understanding about how partisan competition and election outcomes can impact subjective well-being and further highlight the significance of negative partisanship for American public opinion.
Democracies adjudicate political conflict primarily through contested elections that determine which candidates/parties ultimately control the policymaking process. While the outcomes of elections have important implications for the ideological content of policy decisions, do they also have a broader impact on citizens’ self-evaluations of quality of life? That is, does politics affect happiness? This paper advances our understanding about the political determinants of well-being by evaluating how being a political “winner” or “loser” – whether one’s preferred party controls government or not – is linked to various measures of life satisfaction.
While the limited studies to date on this question focus on national candidates/parties (DiTella and MacCulloch 2005; Curini et al., 2014; Pierce et al. 2016; Lench et al., 2019; Gray et al., 2021; Pinto et al., 2021; Toshkov and Mazepus 2022), this paper makes an original contribution by leveraging the spatial and temporal variation across the U.S. states during a time period (2008–2016) when there was a significant uptick in changes in state party control. Using Gallup survey data on self-reported well-being for Democrats and for Republicans within each state and a difference-in-difference model with two-way fixed effects, I find consistent evidence that citizens report lower levels of well-being when the opposing party controls state government and that this effect is particularly large for Democrats living in Republican controlled states. Conversely, I find little evidence that citizens’ well-being is boosted when their own party controls state government. These results have important implications for our understanding about how partisan competition and election results can impact fundamental outcomes such as whether a person lives a life that they deem satisfying.
Background
Most studies that evaluate the relationship between election outcomes/party control of government and citizens’ attitudes focus on satisfaction with democracy (Anderson et al., 2005; Blais and Gélineau 2007; Curini et al. 2012; Singh et al. 2012; Martini and Quaranta 2019; Halliez and Thornton 2023). In general, these studies tend to reveal a “winner-loser gap” such that supporters of the winning candidate/party report being more satisfied with democracy and its functioning than supporters of the loser. 1 For example, Anderson and Guillory (1997) find that winners (those who voted for a party that subsequently controls government) are more satisfied with democracy than losers particularly in countries with majoritarian political systems. Notably, Loveless (2021) finds that this gap persists and winners remain more satisfied with democracy than losers up to five years after the election (also see Hansen et al. 2019). In short, citizens’ attitudes about how well or poorly democracy is performing are closely tied to political competition and election outcomes.
Far fewer studies have assessed the relationship between political winning/losing and more general evaluations of happiness or life satisfaction. On one hand, this lack of attention might be sensible given that individual well-being is driven by a complex array of psychological and sociological factors that are likely more pertinent to day-to-day life than politics. On the other, there is increasing empirical evidence that emotions and feelings of happiness can be directly linked to, and influenced by, political considerations and events (Redlawsk 2006; NeumanRussell et al., 2007; Pace and Ali, 2018). In the specific context of political winning and losing, a series of studies documents a link between supporting the winning (losing) candidate/party and higher (lower) levels of self-reported happiness. For example, Pierce et al. (2016) find that Republicans reported being less happy after their party’s candidate lost the 2012 presidential election and that, strikingly, the effect size was larger than for reactions to the Newtown school shooting or Boston Marathon bombing. Lench et al. (2019) find similar effects for the 2016 presidential election with Republicans reporting an increase in happiness, and Democrats reporting a marked decrease, after the election (also see Pinto et al., 2021). Similar studies of European elections also document a boost in happiness among those voting for the winning party/candidate (Gray et al., 2021; Toshkov and Mazepus 2022).
There is also evidence that people are happier even long after the actual election when the party they support or identify with controls government (Di Tella and MacCulloch 2005; Curini et al., 2014). In research that is most related to this current study, Jackson (2019) evaluates General Social Survey data for 1972-2010 and finds a positive relationship between respondents’ self-reported happiness and them sharing the same party as the U.S. president. However, he finds no relationship between happiness and party control of state government, explaining: “There are no specifications that yield a result statistically significant from zero for ‘allsame’ [state government controlled by same party as the respondent]. These demonstrate that party control of state offices have little to no effect on respondent happiness” (p. 199). To the best of my knowledge, this is the only study to date that assesses a possible link between state government party control and citizens’ happiness.
It appears, then, that party control for national politics impacts happiness while state government party control does not. Perhaps this finding is not surprising given that, compared to national politics, most state residents pay little attention to the details of state politics and policy (Songer 1984; Carpini et al., 1994; Hogan 2008). This current study reevaluates whether citizens’ happiness is linked to state government control and is motivated by three propositions. First, despite citizens not paying close attention to state politics, there is evidence that citizens possess enough basic knowledge about state politics and government to secure policy responsiveness and hold elected officials accountable (Jaeger et al., 2017; Lyons et al., 2013; Wolak, 2020). So, it is possible that knowledge of state party control factors into one’s evaluations of happiness. Second, state politics and policy decisions arguably have a larger and more immediate impact on citizens’ well-being than policy decisions made at the national level such that, from a theoretical standpoint, we should expect effects at the state level if they are present at the national level. Third, from a methodological standpoint, previous studies that assess the possible link between state party control and happiness use data that only go up to 2010 and include few instances of state government control actually flipping from one party to the other. By contrast, in the 2010 elections alone, Republicans took control of 20 state legislative chambers as they flipped both the house and senate majority in six states and gained control of both chambers in an additional five states. Including additional years of data with that temporal variation in state party control provides further analytical leverage to estimate possible effects on well-being. In short, our understanding of the relationship between state government party control and happiness among political winners/losers to date is limited and ripe for further exploration.
Data and empirical strategy
One reason that previous studies have tended to overlook the possible link between state party control and happiness among political winners/losers is that few surveys have a large enough number of respondents to make credible state-level estimates. For example, the Jackson (2019) study discussed above uses individual GSS respondents as the unit of analysis and links each to the party in control of their state government the year of the survey. However, state party control is the same value for all respondents living within a given state-year, so using a state-year average among partisan subgroups is arguably a better estimation strategy for assessing whether the average well-being of Democrats and (separately) Republicans within states oscillates over time as party control changes. 2 Fortunately, the Gallup U.S. Poll (which began as the Gallup Daily Tracking Survey) allows for this state-level empirical strategy because it randomly surveyed roughly 1000 American adults every day for 2008–2012 and roughly 500 every day for 2013–2016. Using these data, the goal of this paper is to assess levels of happiness among Democrats and among Republicans as a function of state government control. The Gallup Analytics platform reports subgroup averages within a state-year if the number of respondents exceeds 300, this provides self-reported life evaluation data for 312 state-years for Democrats and for 304 state-years for Republicans (out of a total possible of 450 state-years, 50 states for nine years 2008–2016). 3
To measure life evaluations, I use several different survey items. First, I follow previous studies that use a single-item life satisfaction ladder measure (Helliwell et al. 2021). Gallup asks respondents: “Please imagine a ladder with steps numbered from 0 at the bottom to 10 at the top. Suppose we say that the top of the ladder represents the best possible life for you, and the bottom of the ladder represents the worst possible life for you. On which step of the ladder would you say you personally feel you stand at this time, assuming that the higher the step the better you feel about your life, and the lower the step the worse you feel about it? Which step comes closest to the way you feel?” Second, I use a related survey item that probes expectations about future happiness by presenting the same first two sentences as the life today question but then instead asks: “Just your best guess, on which step do you think you will stand on in the future, say about five years from now?” Third, I use Gallup’s Life Evaluation Index that divides respondents into one of three groups depending on their responses to the “life today” and “life in five years” questions. Gallup classifies those who rate their current life a seven or higher and their anticipated life in five years an eight or higher as “thriving.” Those who rate their current life and anticipated life in five years a four or lower are classified as “suffering.” Those who are neither suffering nor thriving are considered “struggling.” I model the percentage of Democrats and Republicans who fall into each category as separate dependent variables below. 4 Fourth, as a measure of retrospective life evaluation, I use a survey item that asks respondents: “Did you experience the following feelings during a lot of the day yesterday… How about enjoyment?” Taken together, these four different measures provide a robust appraisal of Democratic/Republican self-reported well-being in the states for 2008-2016. 5
To statistically evaluate the relationship between state government party control and citizens’ happiness in the states over time, I use the following regression equation:

The model specification resembles a difference-in-difference model with time-varying treatments across units and more than two time points (Angrist and Pischke 2008; Kogan 2017) and leverages the fact that states changed state government party control at different points during the 2008–2016 period. The finding that, on average, Republicans tend to report higher levels of happiness than Democrats (Napier and Jost 2008; Bixter 2015) is not problematic here because Republicans/Democrats within a state are being compared with themselves over time as state party control varies. In short, the analytical framework provides a stringent test for any possible statistical relationship between state party control and citizens’ life evaluations.
Analysis
Life today evaluation (0–10).
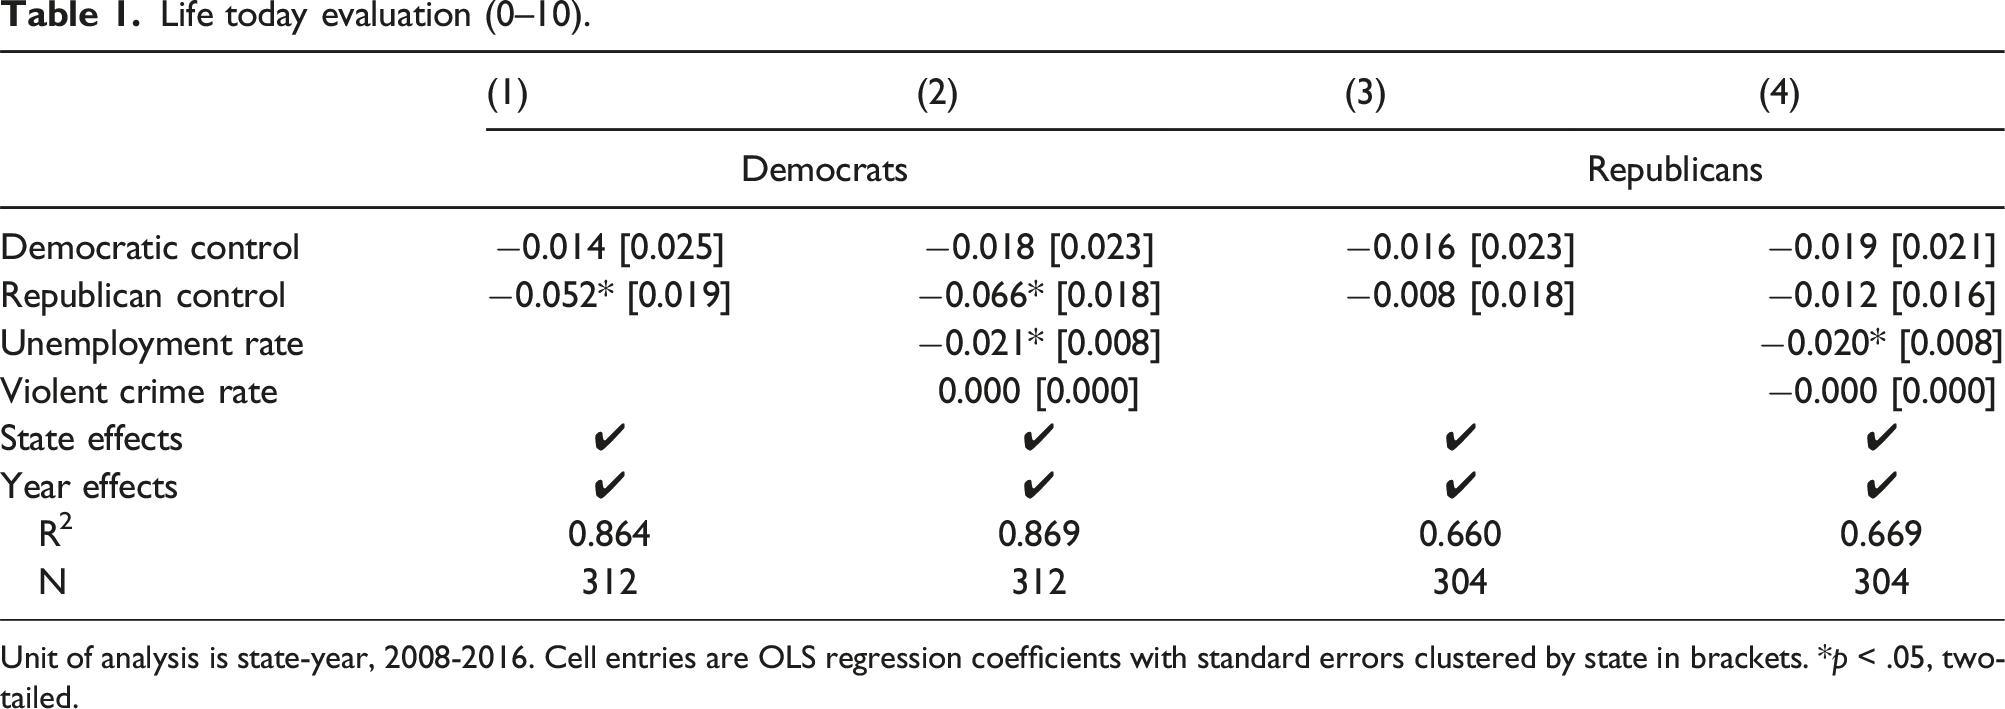
Unit of analysis is state-year, 2008-2016. Cell entries are OLS regression coefficients with standard errors clustered by state in brackets. *p < .05, two-tailed.
Life in five years evaluation (0–10).

Unit of analysis is state-year, 2008–2016. Cell entries are OLS regression coefficients with standard errors clustered by state in brackets. *p < .05, two-tailed.
Percentage who are thriving, struggling, and suffering.

Unit of analysis is state-year, 2009-2016. Cell entries are OLS regression coefficients with standard errors clustered by state in brackets. *p < .05, two-tailed.
Percentage who experienced enjoyment yesterday.
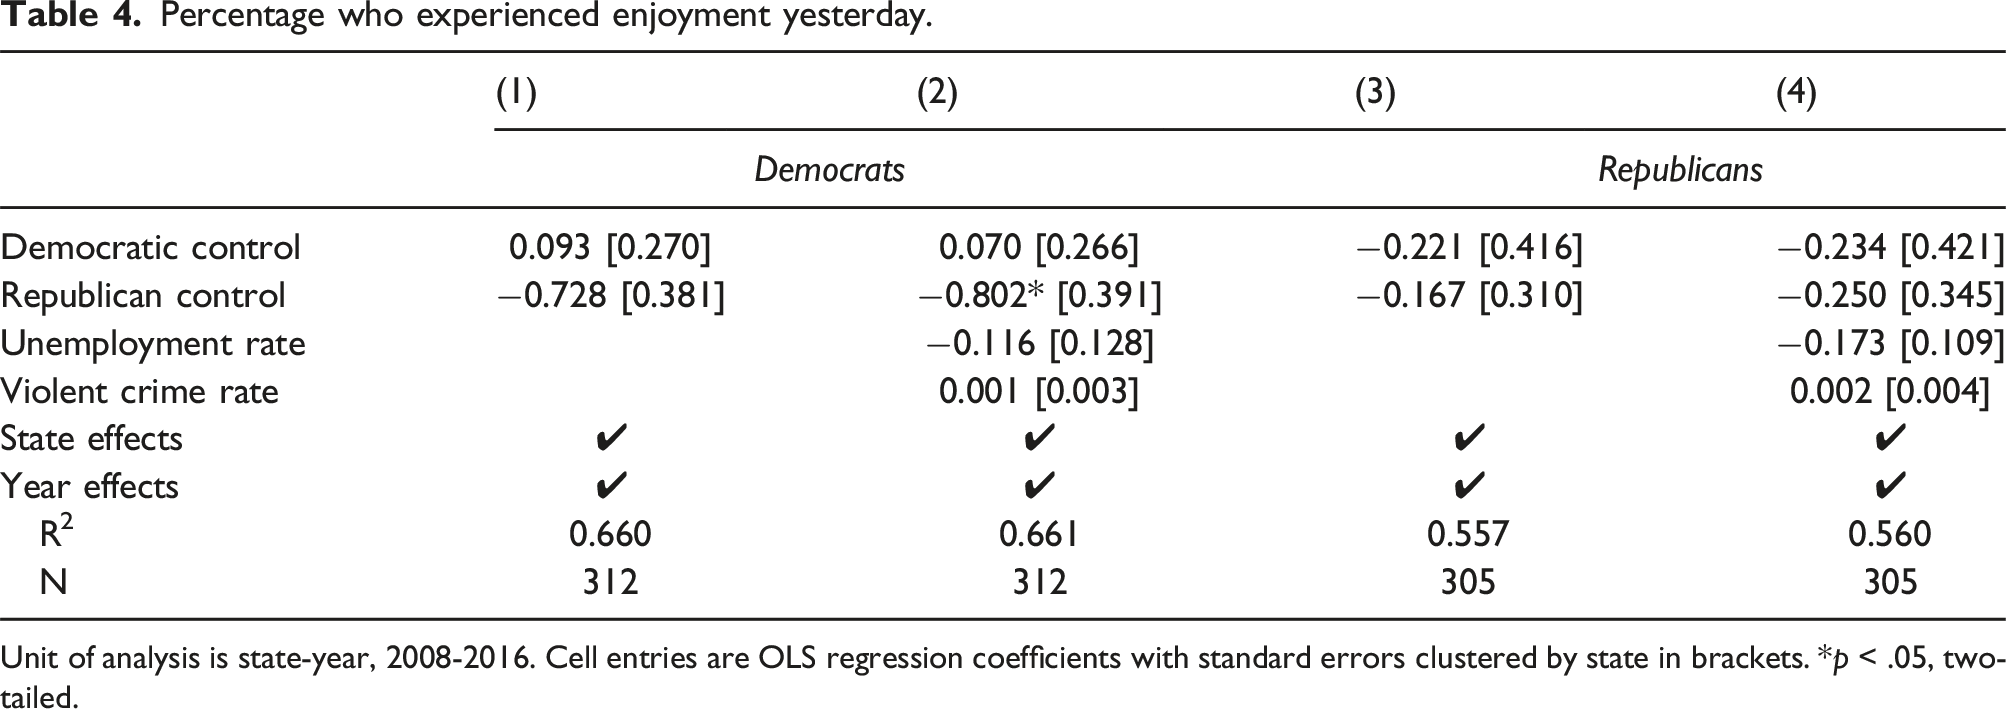
Unit of analysis is state-year, 2008-2016. Cell entries are OLS regression coefficients with standard errors clustered by state in brackets. *p < .05, two-tailed.
Taken together, these analyses point to fairly robust conclusion: citizens report lower levels of well-being (i.e. less happiness) when the opposing party controls government in their state. Moreover, this effect is particularly clear among Democrats, perhaps owing to the fact that Republicans successfully won control of several state governments in 2010 and onward. In contrast to previous studies that posit state politics and policy has little impact on citizens’ attitudes and well-being primarily because they are not paying enough attention, these findings suggest that state partisan politics and government control have important effects on citizens’ self-reported well-being.
Implications and future research
Do electoral outcomes impact how we assess our well-being? Previous studies have documented that political winners tend to be more satisfied with democracy and happier than political losers, but these investigations focus almost exclusively on national parties and candidates. That focus is unfortunate because the rich spatial and temporal variation in election outcomes and party control for the U.S. states provides a useful opportunity to more closely examine the relationship between government control and well-being. As such, the current study contributes to our understanding about the political drivers of happiness/life satisfaction.
Across several different measures of well-being, I find that state party control has a particular effect: it tends to lower the well-being of political losers. Specifically, partisans report lower levels of well-being when the opposing party controls state government but, interestingly, receive little corresponding boost when their party controls government. That finding builds on and advances previous studies in the comparative politics literature that report only a small increase in happiness among supporters of the winning candidate but a large drop among supporters of the loser (Pierce et al. 2016; Lench et al., 2019). The pattern may be explained, in part, by the growing literature on affective political polarization and negative partisanship (Abramowitz and Webster 2016; Iyengar et al., 2019). While having one’s own party control the state policymaking process is certainly desirable, what really seems to motivate citizens’ emotions and spur their political interest/participation is a concern (or even a fear) of the opposing party being in charge. 8
Future research should further investigate how politics, particularly being a political winner or loser, can impact emotions, attitudes, and behavior. The analysis here focuses on a timeframe (2008–2016) when many Democrats found themselves as political losers at the state level for the first time. Do lower levels of well-being persist or do losers acclimate over time to their new political environment? Does the decrease in happiness spur political action or, conversely, does it lead to political resignation and apathy? In addition, the analysis here focuses on state party control but important variation exists within states as well. For example, do Democrats who live in a Republican controlled state report differing levels of well-being depending on whether they live in a Democratic vs. a Republican controlled city? Given the importance of better understanding what factors lead to people living lives they deem satisfying, this is a fruitful area for further inquiry.
Supplemental Material
Supplemental Material - State government control and partisan happiness
Supplemental Material for State government control and partisan happiness by Patrick Flavin in Party Politics
Footnotes
Declaration of conflicting interests
The author(s) declared no potential conflicts of interest with respect to the research, authorship, and/or publication of this article.
Funding
The author(s) received no financial support for the research, authorship, and/or publication of this article.

Supplemental Material
Supplemental material for this article is available online.
Notes
Author biography
References
Supplementary Material
Please find the following supplemental material available below.
For Open Access articles published under a Creative Commons License, all supplemental material carries the same license as the article it is associated with.
For non-Open Access articles published, all supplemental material carries a non-exclusive license, and permission requests for re-use of supplemental material or any part of supplemental material shall be sent directly to the copyright owner as specified in the copyright notice associated with the article.
