




Abstract
In this research note, we reconsider the tourism–growth nexus by accounting for spillover effects between regional tourism development and regional economic growth. For this purpose, we utilize spatial panel econometric techniques to measure the above effects in 49 Greek prefectures during the period 2010–2014. Our findings indicate strong short-run and long-run spillover effects, suggesting that policymakers should consider regional tourism development as a key factor for boosting national economic growth.
Introduction
The purpose of this research note is to reexamine the tourism–growth nexus within the context of a spatial panel econometric framework. In doing so, we study the spillover effect of tourism development for a specific regional unit on the economic growth of nearby regions. While the importance of spatial interactions in the study of tourism development is highlighted in the literature (see, e.g. Papatheodorou, 2004), most of the studies on the tourism-led growth hypothesis (see Castro-Nuno et al., 2013, for a thorough review) ignore the role of spatial effects. Even in the cases where a spatial specification is used, either the determinants of tourism growth are examined (e.g. Capone and Boix, 2008; Lazzeretti and Capone, 2009; Yang and Wong, 2012; Yang and Fik, 2014) or the analysis is conducted in a Nomenclature of Territorial Units for Statistics (NUTS) 2 level 1 (e.g. Liu et al., 2017) and, therefore, may suffer from aggregation bias. This note is an attempt to fill this gap and therefore to provide some important policy implications for regional tourism policy.
The rest of the article is organized as follows. In the next section, we discuss the data and describe the structure of the empirical specification. The third section presents and interprets the empirical results, while the fourth section concludes the article.
Data and empirical specification
Our empirical analysis is conducted for 49 NUTS 3 regions of Greece for the period 2010–2014 (245 observations). Greece is a popular tourist destination which is quite resilient to external negative shocks to the countries of tourists’ origin and therefore downside risk to future arrivals, at least in the short term, is quite limited (Gounopoulos et al., 2012). The selection of the time period was mainly based on data availability. 2
We build on the specification employed by De Vita and Kyaw (2016, 2017) appropriately extending it to incorporate spatial effects. However, unlike De Vita and Kyaw who perform their analysis at a country level, we limit the set of the explanatory variables to tourism arrivals, time lagged gross domestic product (GDP) per capita growth rate, and its spatially lagged counterpart (the latter is part of our spatial specification and captures the spatial dependence of regional economic growth). This is due to two reasons. First, most of the data are not available at such level of disaggregation (NUTS 3 regions, i.e. Greek prefectures). 3 The only control variable for which we have complete data is the level of population. However, its impact was statistically insignificant, and therefore, it was dropped from the final empirical specification. Second, some of the variables, such as trade openness, political stability, and financial development, do not apply for prefectures. All in all, the variables included in our estimation are the real GDP per capita in 2010 prices (retrieved from the Organisation for Economic Cooperation and Development database) and the tourism arrivals (arrivals in hotels retrieved from the Hellenic Statistical Authority).
We utilize the following spatial autoregressive (SAR) model

where i refers to a given NUTS 3 region, t denotes a specific time period, μi is a region-specific effect,

where
While a spatial version of the system Generalized Method of Moments (GMM) methodology proposed by Arellano and Bover (1995) seems to be more appropriate for the estimation of equation (1), we use a maximum likelihood estimation (MLE) instead. The rationale of this choice is as follows. Within the context of a dynamic spatial panel model, if the SAR variable and the time-lagged dependent variable are the only endogenous variables, then MLE is a proper estimation method (Elhorst, 2005; Lee and Yu, 2010). However, the fact that we omitted several variables (see the discussion above) and the existence of potential bidirectional causality between GDP growth and tourism development may give rise to further endogeneity issues (in such case the tourism development variable will be considered endogenous), which could invalidate our empirical results. Regarding the latter issue, it should be noted that the empirical literature about the direction of causality between tourism development and economic growth is rather inconclusive (see Brida et al., 2014, for a thorough literature review on this topic). 5 On the other hand, we have attempted to control for omitted variable bias in two ways. First, we model time-invariant omitted variables using a fixed-effects specification (see Baltagi, 2005). Second, we control for time-varying omitted variables by including the first lag of the dependent variable as an explanatory variable (autoregressive approach; see Wooldridge, 2002).
To ensure that our model is free from the aforementioned endogeneity problems, we perform a series of diagnostic tests presented in Table 2. Specifically, we conduct an endogeneity test to check the endogeneity of the tourism development variable and a DeBenedictis–Giles RESET test to check the specification of our model. Moreover, the need for a spatial specification is tested through Pesaran’s (2004) cross-sectional dependence test. All the above diagnostic tests indicate the validity of our specification.
The descriptive statistics of our sample are presented in Table 1.
Descriptive statistics.

GDP: gross domestic product.
Diagnostics.
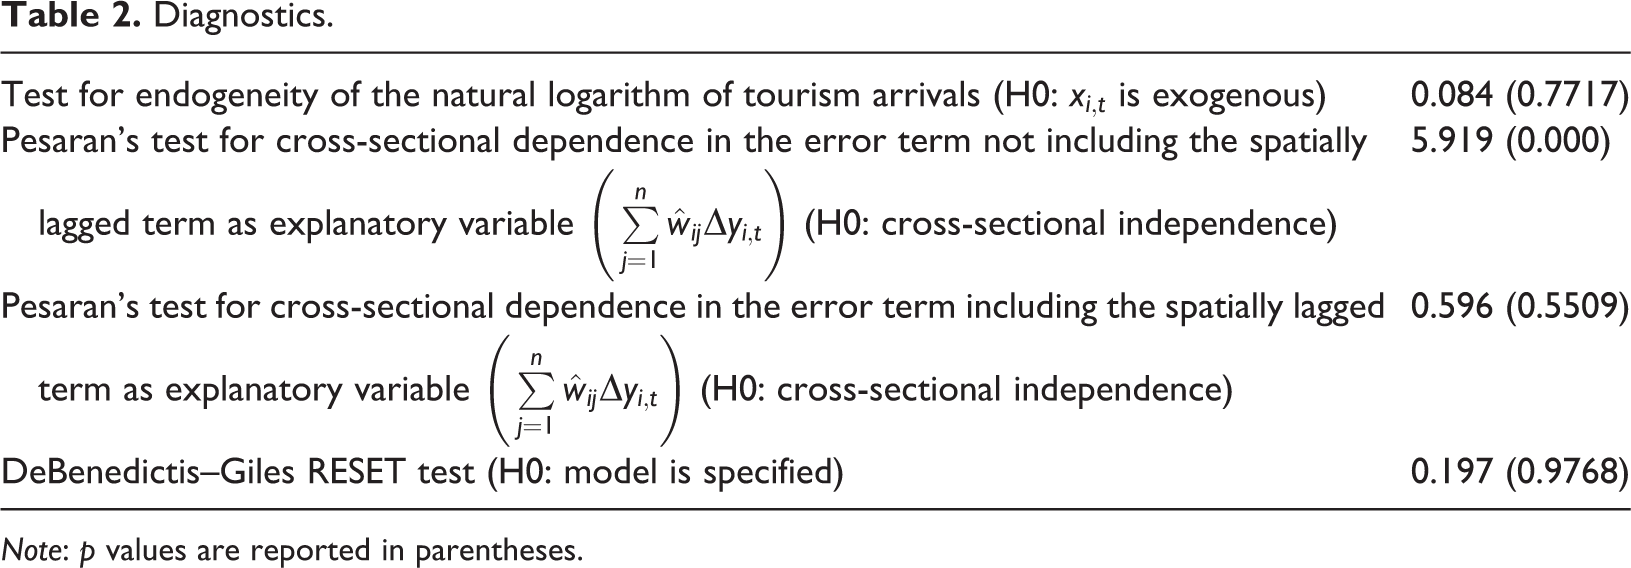
Note: p values are reported in parentheses.
Results and discussion
Our estimation results (Table 3) indicate the usual positive relationship between tourism development and economic growth. GDP growth in a given region is also positively affected by both its lagged value and the growth level of the neighboring regions. What is more important though (and consists the novelty of the present note) is the estimation of the short-run and long-run direct, indirect, and total effects of tourism development on regional GDP growth. In particular, in the short run, the direct impact of 0.0999 implies that an increase of 10% in tourism arrivals in a given region leads to an increase of GDP growth in that particular region by about 1%. Regarding the total effect, our results indicate that a 10% increase in tourism development in a given region tends to increase GDP growth in the whole sample by about 1.4%, implying an indirect spillover effect of about 0.4%. The latter quantifies the impact of tourism development in a given region on the GDP growth of the nearby regions (as defined by the cutoff value). As far as the long run is concerned, the effects retain their sign, but they are higher in magnitude. All the aforementioned effects (short run and long run) are strongly statistically significant. These spillover effects could be attributed to tourists’ inter-destination movements and to the supplies to tourism delivered to the tourism destinations.
Empirical estimates.

Note: SDM: spatial Durbin model; SAR: spatial autoregressive. Robust standard errors are reported in parentheses. Regression results were generated in STATA using the -xsmle- command. The SAR model was selected over the SDM for its lower value on the Akaike and Bayes–Schwarz information criteria.
*** Significance at 1% level; **significance at 5% level; and *significance at 10% level.
Conclusion
In conclusion, our findings call for further research in this area (e.g. cross-country comparative analysis) and suggest that policymakers should consider regional tourism development as a key factor for boosting national economic growth.
Footnotes
Acknowledgements
We are grateful to an anonymous referee for helpful comments and suggestions, which substantially improved the article. All remaining errors are ours.
Declaration of conflicting interests
The author(s) declared no potential conflicts of interest with respect to the research, authorship, and/or publication of this article.
Funding
The author(s) received no financial support for the research, authorship, and/or publication of this article.
