




Abstract
This study empirically examines the spatial interdependency of attractions, using a unique database of 75 important attractions in Guangdong (GD) province, China and spatial econometric models. According to the estimation results, compatible effects apply to the samples in GD overall and in eastern GD, while competitive effects apply to the samples in northern GD. To analyze further, this study finds attraction theme matters to the nature of spatial interdependency. There are competitive effects among natural attraction (NA) and man-made attraction (MA) and insignificant compatible effects among cultural attractions. The competitive effects among NAs have a root in the competition for tourists’ time budget, and competitive effects among MAs are related to product homogeneity, resulting from the ubiquitous product imitation in MAs in China. This study concludes that to distinctly diversify attraction theme is a critical way to generate a positive spatial interdependency among attractions within a certain geographic area.
Keywords
Introduction
Attractions are the core of the tourism industry since they motivate travelers and shape the appeal of a destination (Leask, 2010). Due to the key function of attractions in destination development and regional tourism growth, researchers have extensively investigated their impacts (Klenosky, 2002; Yang et al., 2010; Yoon and Uysal, 2005). Attractions do not exist in isolation, and tourism activities in one attraction are closely associated with those in nearby attractions. Examining spatial interdependency among attractions within a certain geographical area is valuable in helping attraction managers and destination management organizations develop better strategies for increasing regional tourism.
Regarding attraction’s spatial interdependency, frequently mentioned is the notion of compatible effect which denotes that for a given attraction, the proximate attractions have a positive impact (Weidenfeld et al., 2010). Thanks to the compatible effect, the appeal of attractions may be cumulative and, hence, increases the overall appeal of a region. In contrast, a competitive effect suggests that due to the limitation of tourism budget, tourist arrivals to a given attraction will decrease if arrivals to its proximate attractions increase (Kim and Fesenmaier, 1990). The compatible and competitive effects demand entirely different strategies for attraction managers, which highlights the value of the empirical research on them.
The existing research on attractions’ spatial interdependency relies mainly on case studies or surveys, and their results are difficult to generalize. A few studies base their research on secondhand data, but they only provide the simply descriptive analysis. Differently, employing a unique monthly database of 75 attractions in Guangdong (GD) province, China, this study executes a systematic analysis through spatial econometric modeling and contributes to the literature as follows.
This study presents a complicated scenario for attraction spatial interdependency and extends our knowledge on the spatial connection among attractions. Seemingly, the nature of spatial interdependency varies according to the geographic space of a region. Essentially, the nature of attraction spatial interdependency depends on the type of attraction theme. Natural attraction (NA) and man-made attraction (MA) tend to compete against each other, while cultural attractions (CAs) exert an insignificant compatible effect on each other. The negative spatial interdependency among NAs has a root in the competition for the time budget of tourists, while the negative effect among MAs is related to the product homogeneity. Grouping different types of attractions together in a given geographic area may result in a significant compatible effect.
Literature review
As tourists move within a certain space, tourist arrivals at a given attraction may be affected by those in the neighboring attractions, establishing the spatial interdependency of attractions. Correspondingly, two effects, compatible effect and competitive effect, are referred to in the previous literature.
Compatible effect
The compatible effect refers to that due to the sharing of the same source of tourists, the increase of tourist arrivals at the surrounding attractions will lead to the increase of those at a given attraction. Crompton and Gitelson (1979) define five levels of compatible effects according to the percentage of customers shared among the spatially linked businesses. Hunt and Crompton (2008) introduce the concept of compatible effect into the tourism industry initially.
The compatible effect of attractions may be supported by the spatial behavior of tourists. Many researchers argue that the diversification of the tourism experience is the primary reason for multiple destination travel (McKercher, 2001). Similarly, people tend to include multiple attractions in one trip for a diversity of experience. This tendency becomes stronger when a group of travelers rather than a single traveler is involved (Lue et al., 1993). Including several attractions along a route may prevent members from complaining about the attraction choice decision. Further, if a tourist seeks a set of benefits in one trip, the possibility of an individual attraction satisfying the full range of purposes is unlikely and the probability of disappointment increases. Therefore, visiting multiple attractions in one trip becomes a more rational choice (Tideswell and Faulkner, 1999; 2003).
Travelers choose to visit geographically linked attractions in order to save time and cost, specially the cost of transportation. In line with Santos et al. (2012), we let
Competitive effect
However, there are other logics as follows to support that adjacent attractions may replace each other and hence competitive effect may occur.
First, attractions have to compete against each other to draw the limited time and money tourists allocate for a particular trip (Buhalis, 2006; Papatheodorou, 2006; Weidenfeld et al., 2014). The competition becomes more serious when adding an attraction demands significant time or money. As a result, tourists tend to concentrate their budgets on one favorite attraction. The competitive effect tends to be inevitable, given that tourism products provided by attractions are perishable, which means that for a particular attraction, the unused reception capability in one time period cannot be saved for use in next time period (Weidenfeld et al., 2014; Zhou et al., 2016b). The perishability of tourism products may trigger intense competition on price, market promotion, or service among spatially connected attractions. Consequently, the spatial relationship becomes negative.
Second, geographically proximate attractions usually rely on similar resources and materials to produce tourism products (Majewska, 2015). When attractions offer similar travel experiences, tourists generally choose the most accessible one or the most representative one (Zhou et al., 2016b). Thus geographically proximate attractions tend to elbow each other.
In sum, a compatible effect reflects an external economy and the synergy of appeal among attractions, while a competitive effect reflects an external diseconomy or mutual exclusion between attractions. For attraction managers, the compatible effect encourages collaboration, while the competitive effect suggests an entirely opposite strategy (Kim and Fesenmaier, 1990; Weidenfeld et al., 2014). In such a case, the empirical studies on them become valuable.
Empirical studies
Some literatures empirically investigate the spatial interdependency of attractions. Hunt and Crompton (2008) consider the Caldwell Zoo in Tyler, Texas as a primary attraction and seven other attractions near it as ancillary attractions. They find a significant compatible relationship between primary and ancillary attractions. Taking two attraction clusters in Cornwall, UK as a context, Weidenfeld et al. (2010) analyze the spatial interdependency in a detailed way. They conclude that a significant compatible effect exists between attractions located in different cluster areas or within a cluster area. The compatible effect between intra-cluster attractions is stronger than that between extra-cluster attractions. For intra-cluster attractions, the compatible effect becomes more significant when the cluster density is higher. Weidenfeld et al. (2011) examine nine cases in Cornwall, UK and find most interviewees (attraction managers) want a successful or an attractive attraction as their neighbor since they believe that a positive spatial effect may occur. They propose that the most conspicuous compatible effect applies to attractions with dissimilar themes. Using the monthly data of tourist arrivals at Xidi, Hongcun, and Huangshan (three well-known attractions proximately located in Anhui province, China), Yu et al. (2014) conclude that tourist arrivals at each attraction correlate positively, hinting at a compatible effect.
Few researchers propose the competitive effect except Kim and Fesenmaier (1990), Bao (1994), and Weidenfeld et al. (2014). Kim and Fesenmaier (1990) investigate the spatial structure in recreational travel and conclude that in the short-haul tourism market, the number of visits to a specific park is negatively related to those at nearby parks, which suggests a competitive effect. Comparing tourist arrivals at two neighboring stone-forest attractions near Kunming city in Yunan province of China, Bao (1994) also finds a competitive effect. Weidenfeld et al. (2014) also reveal a competitive effect among neighboring attractions.
Technically, most empirical studies rely on case studies or tourist surveys, such as those of Weidenfeld et al. (2010, 2011), perhaps because there is no alternative way for researchers to collect data. Obviously, the analyses based on surveys or cases may be difficult to generalize. A few studies as those of Bao (1994) and Yu et al. (2014) use secondhand data, but they only provide a simple descriptive analysis. The weakness in research methods undermines the credibility of the results. To fill the research gap, this study employs panel data from 75 attractions in GD province, China and spatial econometric models to further the investigation.
Research methodology
Study area and samples
This study considers GD province as a study area. Increased tourism demand has fueled the development of attractions in GD. By the end of 2009, the number of 5A and 4A attractions (the highest-grade attractions in China) in GD ranked fourth among 31 provinces and municipalities in mainland China.
Besides the rich array of attractions, the efficient transportation infrastructure in GD helps the growth of the tourism industry. As one of the most developed provinces in China, GD has built a dense road system, consisting mainly of highways. According to the Guangdong Yearbook of 2010, by the end of 2009, the total length of roads in GD was 185,000 km, on average over 1 km of road per square kilometer. The well-developed road transportation infrastructure improves the accessibility of attractions in GD province and, hence, helps the establishment of attraction spatial interdependency.
To investigate the spatial interdependency, monthly data are superior to yearly data because the latter is an aggregate which hides the seasonal variation in tourist arrivals. However, according to the statistical policy in China, reporting monthly tourist arrivals is not an obligation for an attraction. Consequently, researchers cannot obtain monthly tourist arrival data for major attractions in a particular province. In some special cases, researchers such as Yu et al. (2014) can luckily get monthly data for a few attractions located in a small geographical space within a province.
In an unusual move, the tourism administration of GD province launched an investigative project in January, 2007, called GD Statistics, to monitor tourist arrival variation for major attractions in GD. According to this project, 75 sample attractions, consisting of seven 5A attractions, sixty 4A attractions, and eight 3A attractions, had to report their monthly tourist arrivals. The GD Statistics project ended in June 2010, and thus a unique database of monthly tourist arrivals at 75 sample attractions was established for the years 2007 through 2009. For researchers, acquiring the database was delayed until 2015. The delay is considered as a measure to protect the commercially confidential information of sample attractions, which explains why the data used in this study seem to be old.
Figure 1 shows the geographical distribution of 75 sample attractions in the study area. The detailed information of the sample attractions is provided in Table 1.
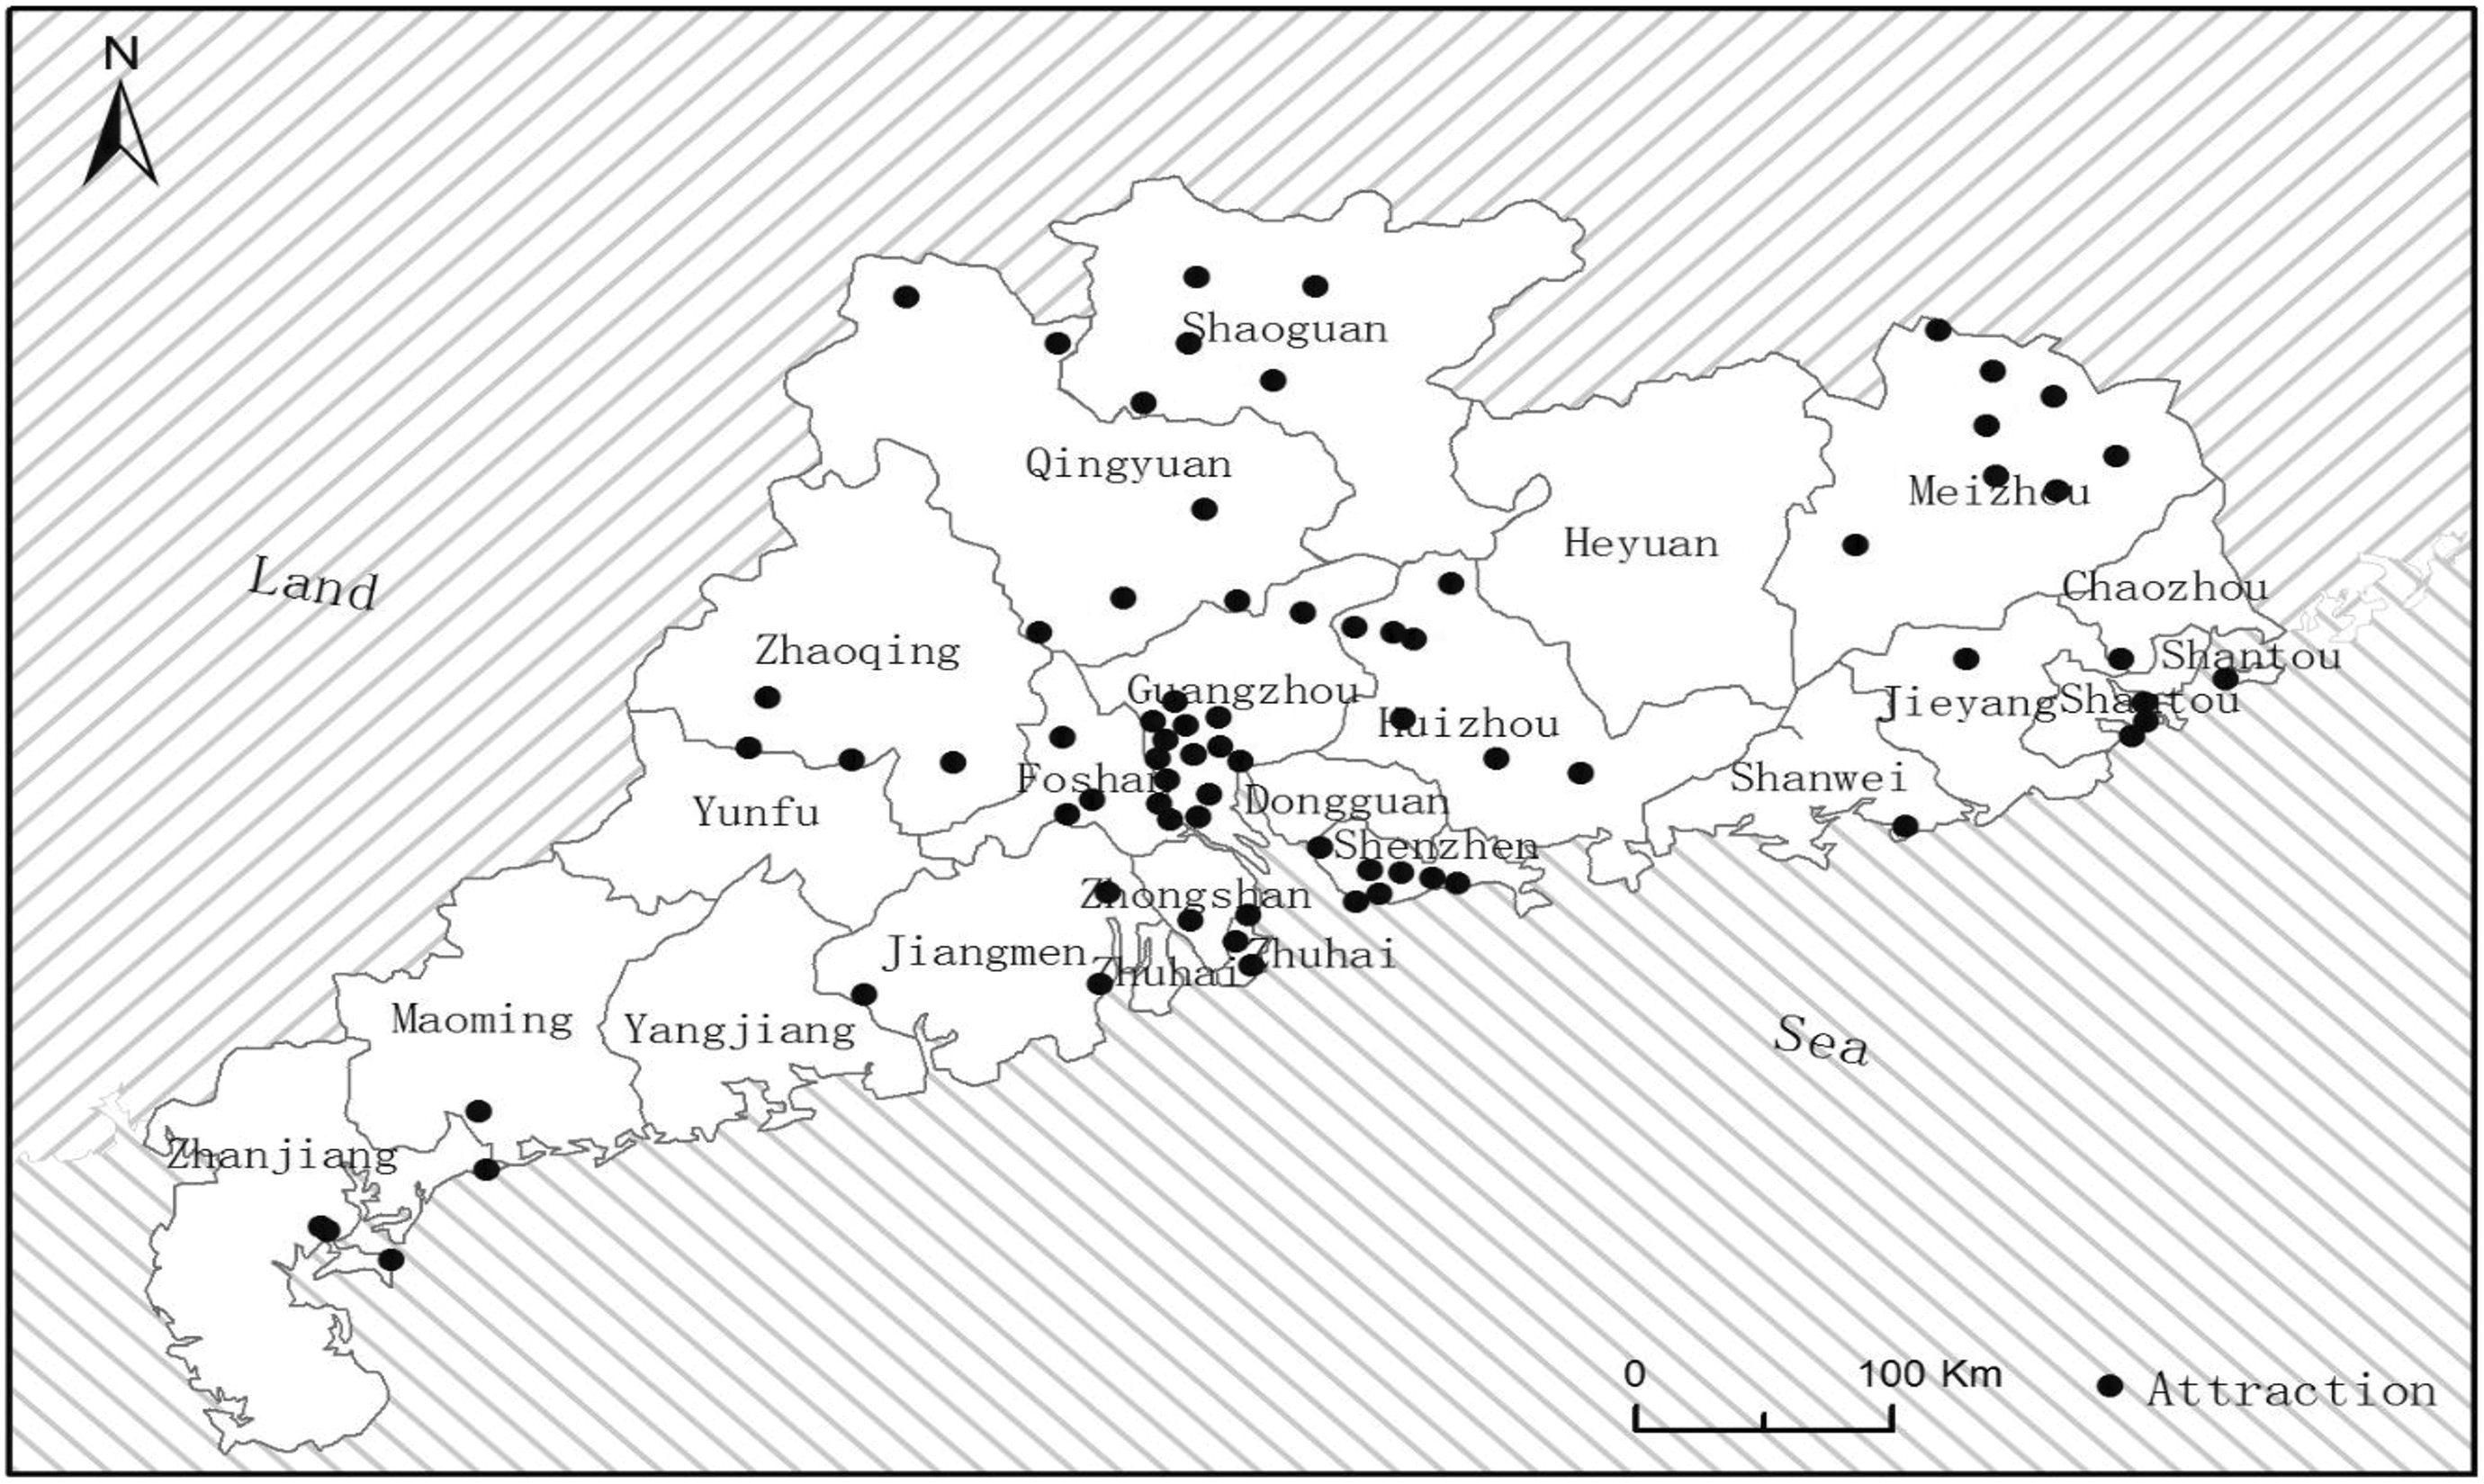
The distribution of sample attractions in the study area.
The list of sample attractions.

Basic model
In terms of the technique, estimating attraction spatial interdependency is similar to measuring spatial interdependency of regional tourist flows, termed as tourism spillover. It is worth mentioning that although this study employs a technique similar to what researchers use to measure tourism spillover, we do not think the meaning of the compatible or competitive effect is the same as that of tourism spillover. Tourism spillover reflects the unintentional or indirect impact tourism activities in neighboring regions exert on a particular region (Majewska, 2015; Yang and Wong, 2012). Differently, the compatible or competitive effect reflects the expectable or direct impact that the surrounding attractions have on a certain attraction. The direct impact becomes greatly clear in that when tourists plan to visit GD, all attractions in GD may complement or compete against each other and, hence, have an equal probability of being included (or being excluded from each other) in the travel package.
The study’s basic spatial model is established as follows:

In equation (1), the explained variable
The estimation results of equation (1) depend on how the spatial weight matrix is constructed, which is a critical issue for this study. There are four spatial weight matrices commonly used: (1) the contiguity matrix where
This study adopts approach (4) because the other three only consider the spatial impacts from the pairs of the “qualified” spatial units. Approach (4) considers the spatial impacts among every pair of spatial units. Given the well-developed transportation infrastructure in GD, it seems logical to suppose that the spatial interdependency may apply to any pair of the sample attractions in GD.
There are different ways to set the value of

In equation (2),
In order to determine which method is more appropriate, this study draws the curve of distance decay in different ways, as Figure 2 shows. In the curve of
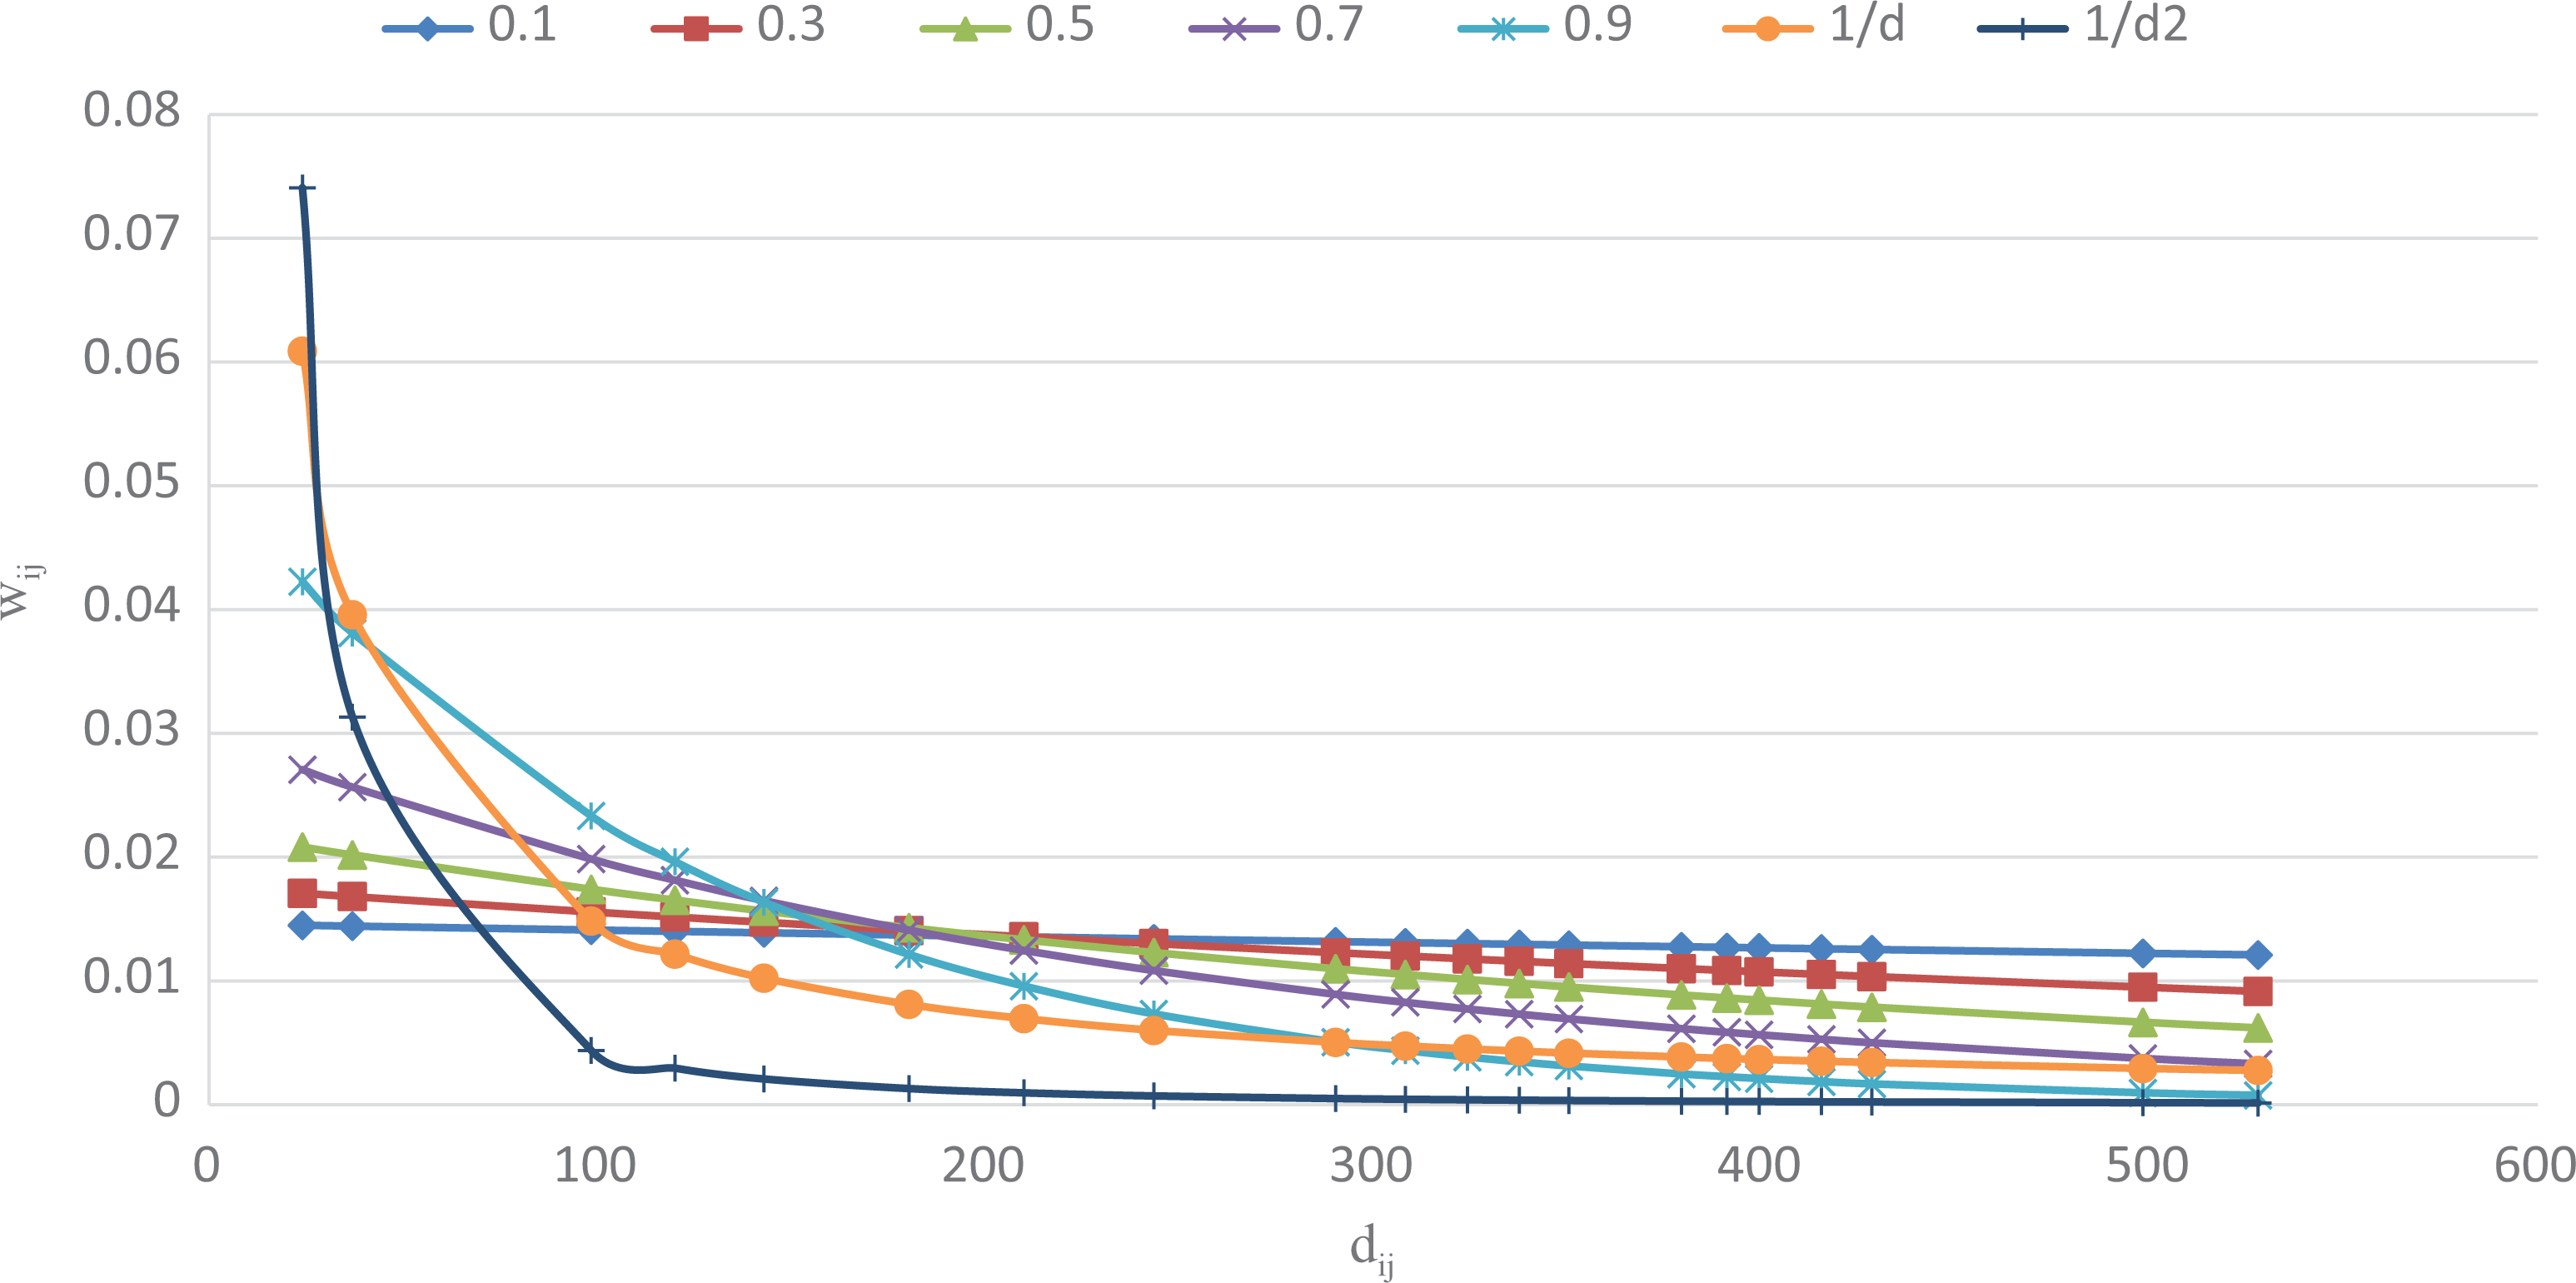
This study sets k = 0.1, 0.3, 0.5, 0.7, and 0.9, respectively, to construct the spatial weight matrix and estimates the spatial econometric model separately. We decide the most appropriate value of k based on the value of Akaike Information Code (AIC) of each model. Finally, this study sets k = 0.1. It should be noted that when we let k = 0.3 or 0.5, the main results of this study are consistent. Due to the space limitation, the results based on k = 0.3 or 0.5 are not reported.
Specific model
The specific model is set as follows:

Model 3 is the specific form of model 1. In order to estimate β precisely, we include a set of variables (CV) to control for other determinants of tourist arrivals of one attraction. We control for the admission price an attraction charges (
Except the dummy variables, all variables are in logarithmic form for easy understanding of the coefficients.
Table 2 shows detailed definitions of the variables.
The definition of variables.
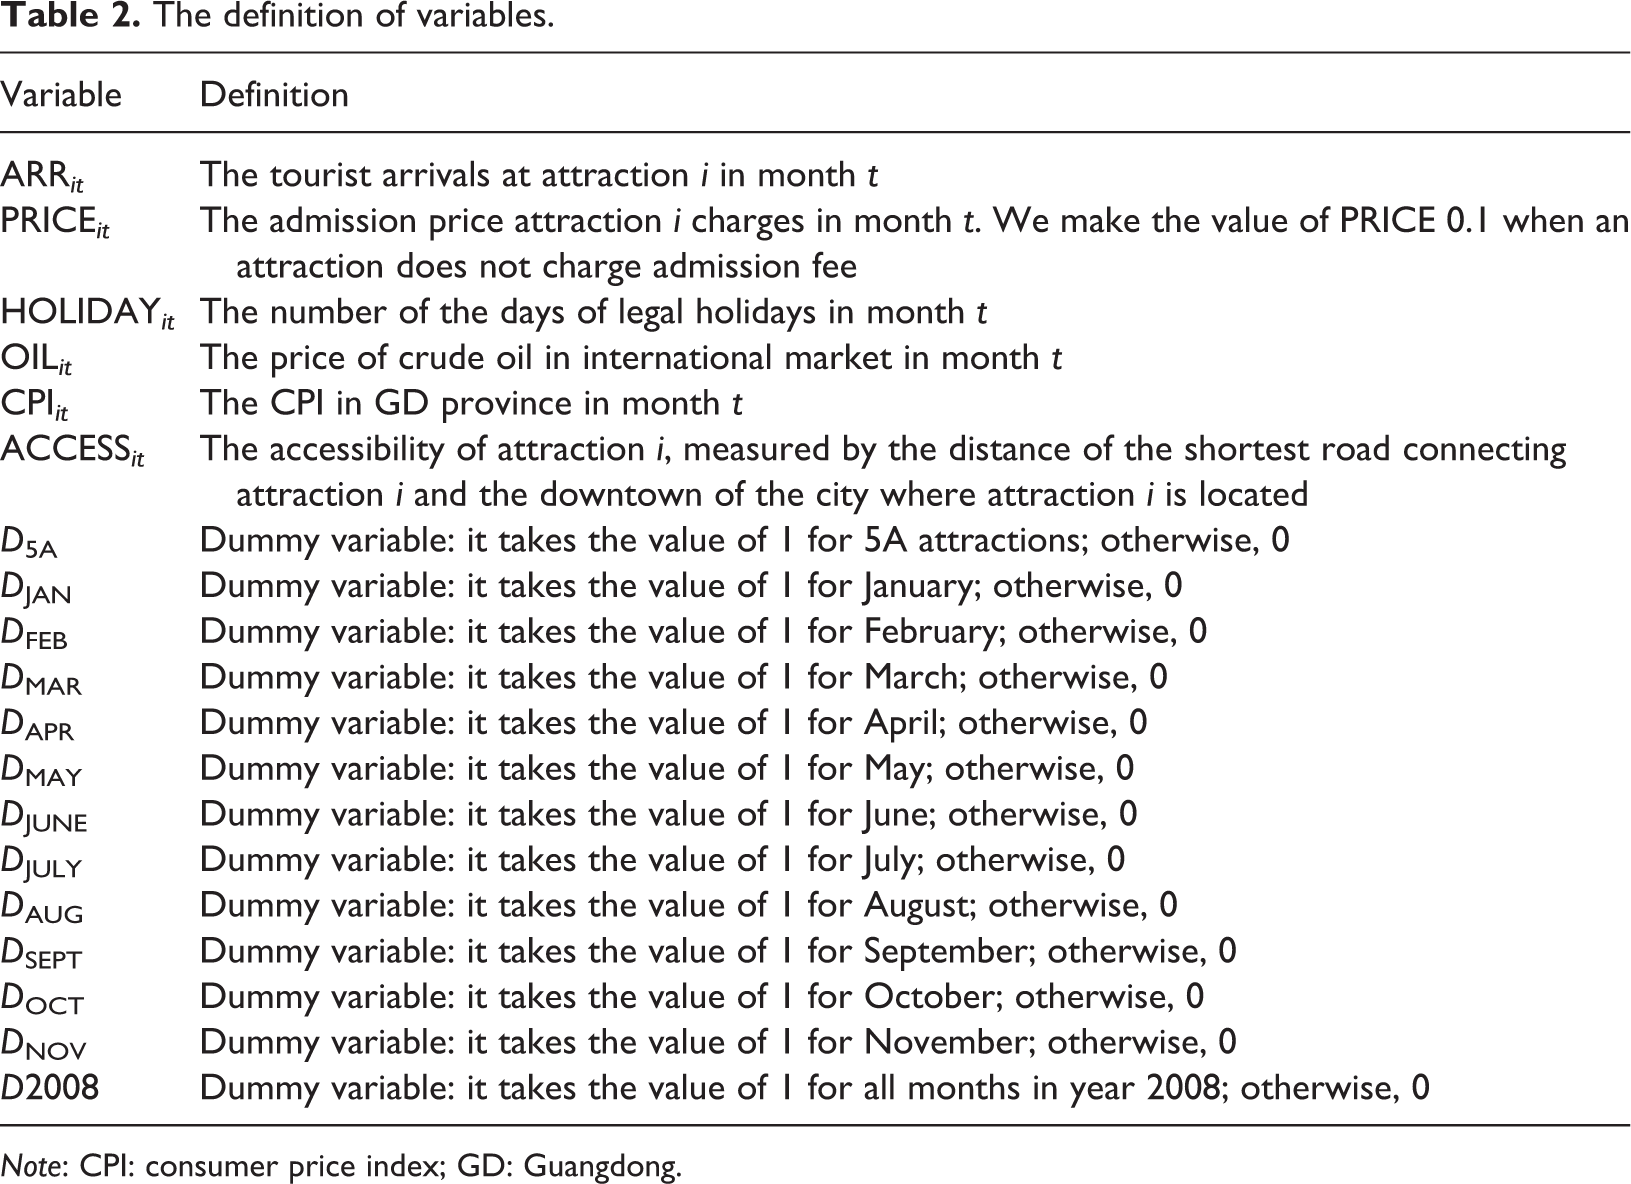
Note: CPI: consumer price index; GD: Guangdong.
Estimation method
Since the inclusion of the spatially lagged dependent variable, that is,
Data source and descriptive statistics
The data for ARR and PRICE are collected from the GD Statistics database provided by the tourism administration of GD province. The data on HOLIDAY are from the website of the State Council of the People’s Republic of China (www.gov.cn). The data on OIL are from the website of the United States Energy Information Agency (www.eia.gov). The data on CPI are from the China Statistical Yearbooks Database. The length of the shortest road connecting two attractions, the proxy of the distance between a pair of attractions which we use for calculating spatial weights, is obtained through Baidu Maps (www.baidu.com). Similarly, the data on ACCESS are from Baidu Maps. The research time period is from January 2007 through December 2009, limited by the availability of the data for ARR.
Table 3 shows the results of descriptive statistics and the variance inflation factor (VIF) of the variables. The maximum VIF is 1.57. According to Belsley et al. (1980), no serious multicollinearity problem exists if the value of VIF is smaller than 10.
The results of descriptive statistics and VIF analysis.
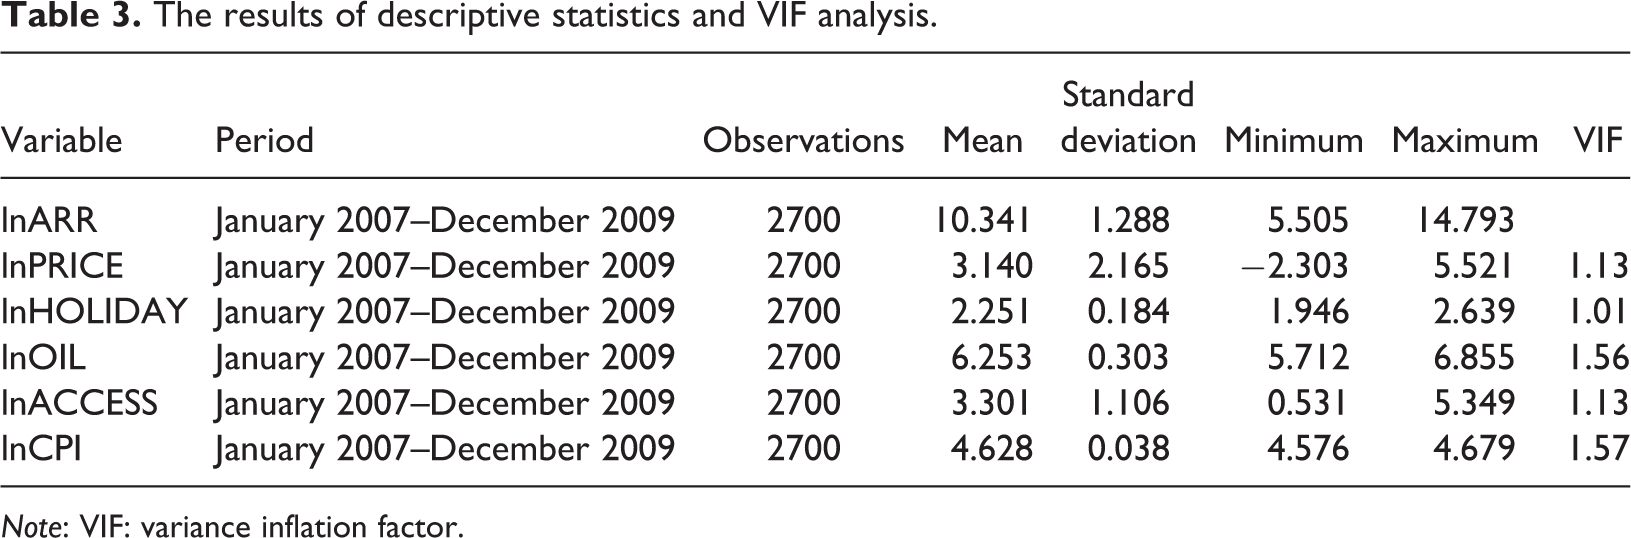
Note: VIF: variance inflation factor.
Results and discussion
Main results
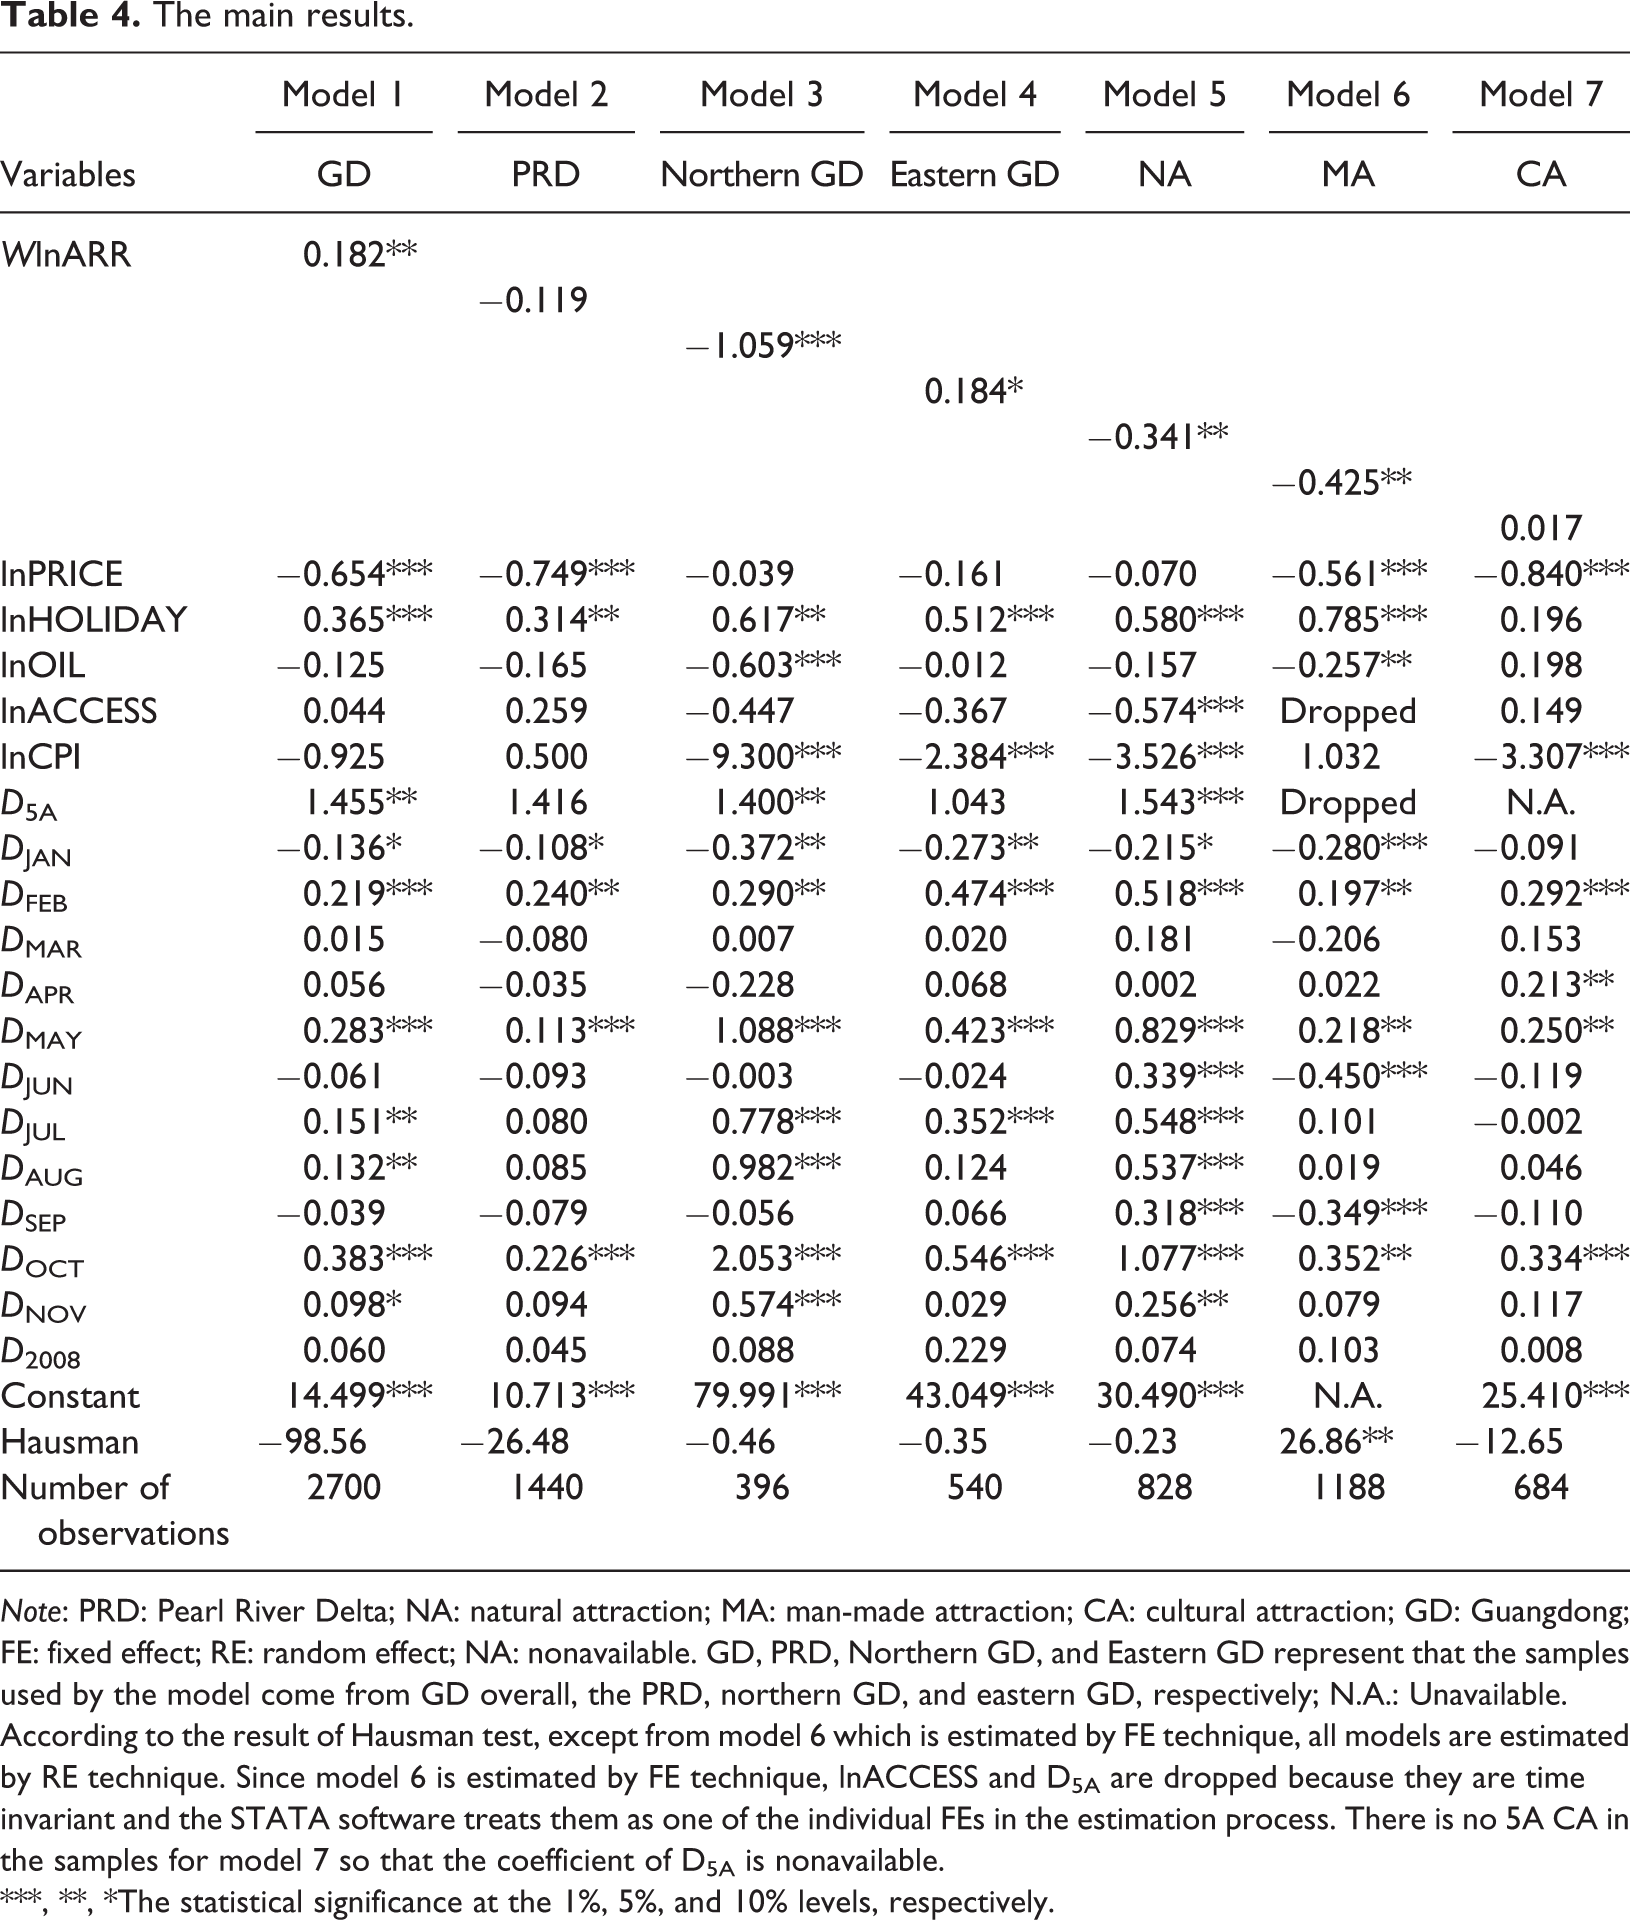
Table 4 shows the main results of this study, where the distance-decay parameter is
The main results.
Note: PRD: Pearl River Delta; NA: natural attraction; MA: man-made attraction; CA: cultural attraction; GD: Guangdong; FE: fixed effect; RE: random effect; NA: nonavailable. GD, PRD, Northern GD, and Eastern GD represent that the samples used by the model come from GD overall, the PRD, northern GD, and eastern GD, respectively; N.A.: Unavailable. According to the result of Hausman test, except from model 6 which is estimated by FE technique, all models are estimated by RE technique. Since model 6 is estimated by FE technique, lnACCESS and D5A are dropped because they are time invariant and the STATA software treats them as one of the individual FEs in the estimation process. There is no 5A CA in the samples for model 7 so that the coefficient of D5A is nonavailable.
***, **, *The statistical significance at the 1%, 5%, and 10% levels, respectively.
The impacts of the major-controlled variables are in line with our expectations. We confirm the negative effect of the admission price and that the price elasticity of tourism demand is −0.654. The number of legal holidays has a positive impact. CPI and the price of crude oil insignificantly inhibit tourist arrivals. The coefficient of lnACCESS is statistically insignificant, which demonstrates that the attraction accessibility is not a relevant issue in this study. It is understandable for that thanks to the well-developed transportation network, the overall accessibility for the sample attractions in GD province is very high, and the distance from an attraction to a city downtown does not make a significant difference in attracting tourists. The coefficient of D 5A is statistically significant which demonstrates that the resource advantages of 5A attractions can effectively lead to the increase of tourist arrivals. Finally, seasonality matters: February, May, July, August, and October are the busy months, with October being the busiest. Contrary to our initial expectation, the impact of international finance crisis has no significant impact on the monthly tourist arrivals to the sample attractions. The reason may lie in that international finance crisis happening in 2008 mainly hit international tourism, and usually for a sample attraction in GD province, the proportion of international tourists in tourist arrivals is tiny.
In order to examine whether the spatial interdependency of attractions will change if the geographical space of the study area changes, we divide GD into three subregions where the majority of the sample attractions are located: the Pearl River Delta (PRD), northern GD, and eastern GD, as shown in Figure 3. The area sizes of the three parts are very close: The PRD has about 31.6 thousand square kilometers; northern and eastern GD have 37.6 and 40.4 thousand square kilometers, respectively. Please note the whole area of GD is 179.7 thousand square kilometers. Among the three parts, the PRD is the best in terms of transportation infrastructure. Therefore, we predict that the strongest spatial effect (either compatible or competitive effect) will apply to the samples in the PRD.
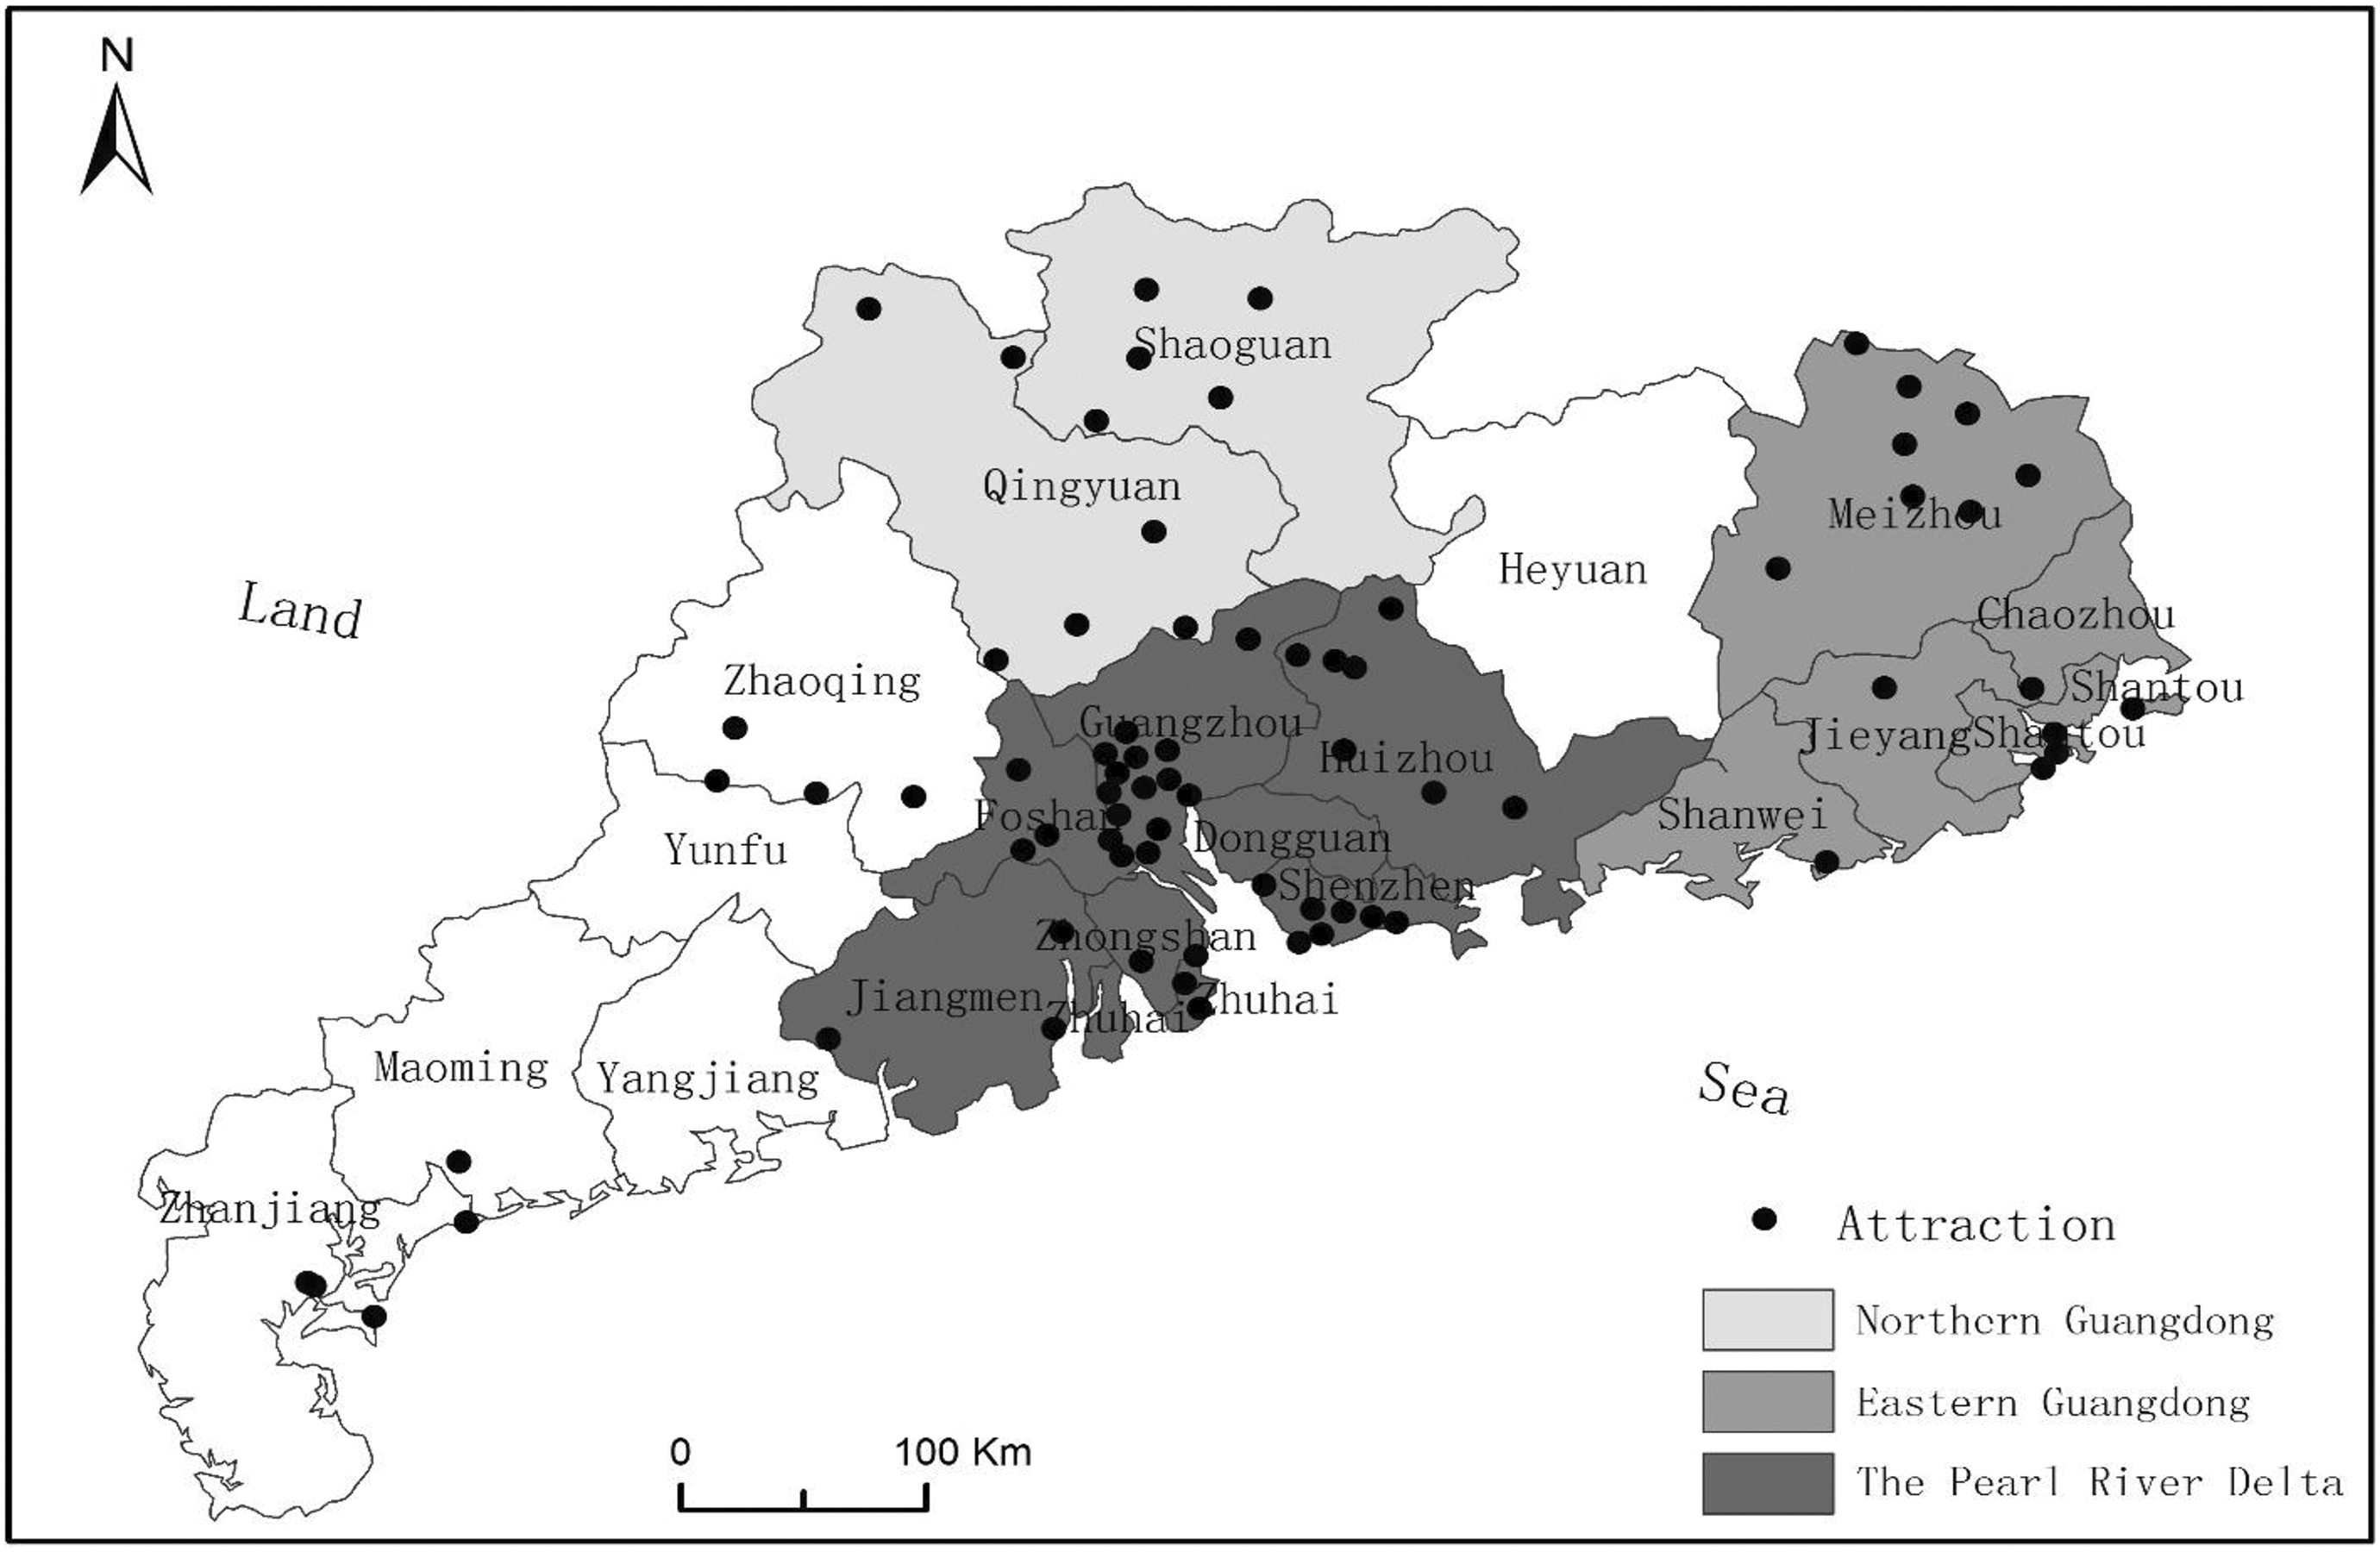
The distribution of sample attractions in three subregions.
Models 2–4 report the results. Unexpectedly, model 2 demonstrates an insignificant competitive effect for samples in the PRD. The competitive effect becomes significant among samples in northern GD, as model 3 shows. The significant compatible effect only applies to attractions in eastern GD, as model 4 shows.
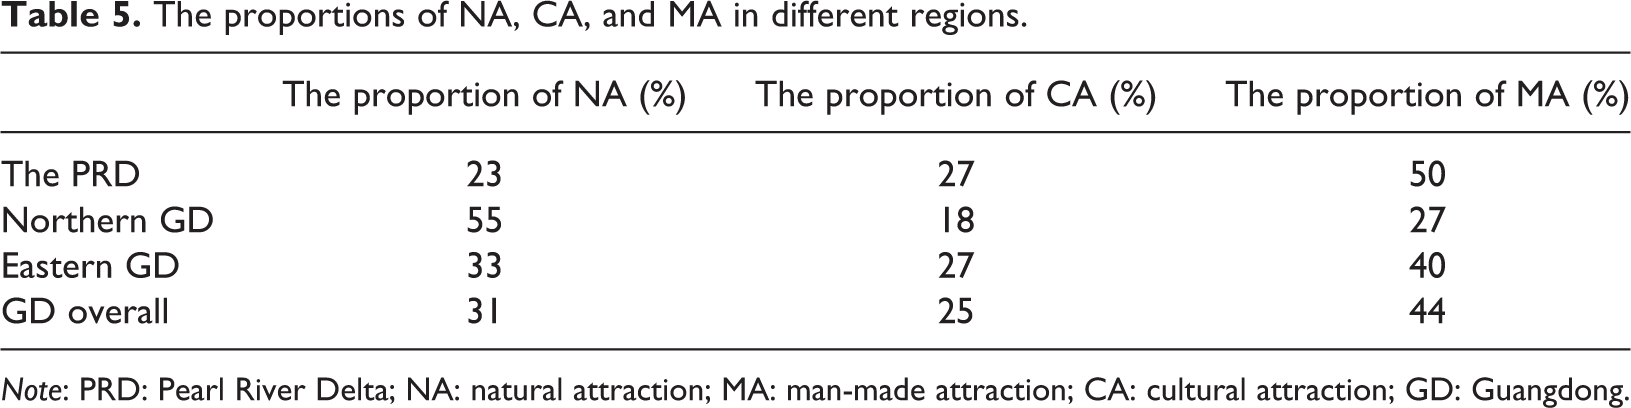
Regarding the nature of the spatial interdependency among attractions, Weidenfeld et al. (2011) propose that the theme of attractions matters. This study divides attractions into three types: NAs, CAs, and MAs, similar to how Yang et al. (2010) and Zhou et al. (2016a) divide attractions. NAs include landscapes, mountains, forests, weather, and other natural resources as their main products. CAs include lifestyles, history, art, architecture, museums, and other cultural heritages that shape or reflect the local ways of life and appeal to tourists. MAs rely on man-made environments, shows, and theme parks to amuse tourists. Table 5 shows that in three subregions, the proportion of NA, CA, and MA is greatly different: MAs constitute the largest proportion (50%) in the PRD; NAs have the largest share in northern GD (55%); and the proportions of NA, MA, and CA are approximately balanced in eastern GD.
The proportions of NA, CA, and MA in different regions.
Note: PRD: Pearl River Delta; NA: natural attraction; MA: man-made attraction; CA: cultural attraction; GD: Guangdong.
We assume that why the spatial interdependency of attractions in three subregions is different has a root in the different structure of attractions theme and that the nature of spatial interdependency of attractions varies according to attraction theme. To test our assumption, we divide the sample attractions into three groups: The NA group includes 23 samples, the CA group includes 19 samples, and the MA group has 33 samples.
The results of models 5–7 in Table 4 validate our assumption. According to model 5, a significant competitive effect occurs among NAs, indicated by a coefficient of −0.341. The negative spatial interdependency also applies to MAs, indicated by the coefficient −0.425 in model 6. The compatible effect only occurs in the CA group but it is statistically insignificant, as model 7 shows.
In models 2–7, all statistically significant coefficients for controlled variables accord with our expectation, except the negative sign of the coefficient of lnACCESS in model 5. Usually, it seems impossible that an increased accessibility may lead to a decrease of tourist arrivals for an attraction. However, it can be explained by the fact that the appeal of an NA greatly relies on the quality of its natural resources. In most cases, the long distance from a sample NA to a city downtown generally means an NA is far away from air, noise, and water pollution, or that the sources or environment of an NA can be preserved well, so that in the case of GD province the long geographic distance becomes a positive factor for an NA to draw tourists.
Discussion
The explanations for the negative spatial effects reported in Table 4 are as follows.
The competitive effect among NAs seems to be counterintuitive because almost every NA has rich scenic spots with characteristics that cannot be replicated easily by other attractions. However, it becomes understandable when we consider the travel time required for visiting an NA. Compared with visiting a CA or MA, visiting an NA generally demands one or more days since the scenic spots of an NA are often dispersed over a large geographic area. Moreover, visiting an NA may demand more physical stamina from tourists; accordingly, tourists may need extra time to recover their strength before they start next journey. Therefore, it becomes unavoidable for NAs to compete with each other to draw the time budgets from tourists. Consequently, the competitive effect occurs.
The competition for time budgets does not apply to MAs because visiting MAs usually demand less time and less stamina from tourists. However, the core products or the thematic entertainment of an MA are realized mainly through artificial facilities, machines, and man-made environments, which may be imitated easily. Products imitation is very common in China because this country lacks effective protection for the intellectual property rights of businesses, including attractions (Zhao, 2006). Zhou et al. (2016a) argue that due to the ubiquitous product homogeneity resulting from product imitation, the agglomeration of MAs fails to enhance the overall appeal of a destination. As a result, tourists may not favor a chain of MAs when visiting GD, and hence the negative spatial connections prevail among MAs.
MAs predominate in the PRD, and hence it is understandable that a competitive effect occurs in the PRD. Similarly, a competitive effect applies to northern GD where the dominant type of attractions is NAs.
The positive spatial effects this study finds can be interpreted as follows.
The competition for time budgets, which applies mostly to NAs, does not apply to CAs because CAs generally demand less time and less physical stamina. Different from natural or MAs, CAs always target the same category of tourists who generally are curious about (or have an intellectual need to know about) the customs, culture, or history in a particular region (Santos et al., 2012). Moreover, the characteristics of CAs are frequently different from each other, reflected as distinct stories, impressions, styles, or cultural backgrounds. Consequently, tourists like to visit several CAs during a single trip, to dig out in detail about the cultural characteristics attached to a region, and hence the compatible effect occurs. From the perspective of technique, we suggest that the reason why the compatible effect among CAs is not statistically significant is that the sample size of CAs is comparatively small—only 19 CAs in GD are included as samples in this study.
The positive spatial interdependency we find in eastern GD or GD as a whole can be explained by the balance of different attraction themes. As Table 5 reports, the proportion of NA, MA, and CA in eastern GD and GD overall is approximately equal, which means the attraction themes in these two regions are diversified well. As Swarbrooke (2001) and Lue et al. (1993) propose, a compatible effect can result from product dissimilarity of attractions. When tourists combine attractions of one type with those of different types nearby, they can consume the contrasting products in one trip, and their tourism experience is effectively enriched (Sternberg, 1997).
To sum up, the negative spatial relationship among NAs is related to time budget competition, and the negative relationship among MAs has its roots in product homogeneity. The spatial relationship becomes positive for CAs because they are free from the problems NAs and MAs have. The spatial relationship also becomes positive when the attraction themes in a certain geographical area are diversified.
Conclusions
Although researchers have paid a lot of attention to spatial interdependency of attractions, the empirical studies with solid research methods are still scarce. Using the monthly data from 75 attractions in GD province, resulting from an unusual statistical project of GD province, China, and spatial econometric modeling technique, this study reveals spatial interdependency of attractions in a detailed way and concludes: Compatible effects apply to the samples in GD overall and those in eastern GD. The compatible effects have their roots in the diversification of attraction themes within a given geographical area. Competitive effects apply to the samples in northern GD, and insignificant competitive effects apply to those in the PRD. After dividing the samples by attraction theme, this study demonstrates the competitive effects for NAs and MAs, and the insignificant compatible effects for CAs.
Results (2) and (3) are compatible with each other since NAs predominate in northern GD, and MAs predominate in the PRD. Because NAs demand more time from visitors, we suggest that the competition among NAs for tourism time results in the competitive effects. We also propose that product homogeneity, resulting from the common product imitation in China, explains the negative spatial interdependency among MAs.
We have the following suggestions for attraction managers and related agencies in the tourism industry: As for attraction collaboration within a destination (such as GD province in this study), attraction managers and destination management organizations should adopt a strategy of selective cooperation. Only collaborations among attractions which produce compatible effects can lead to a high synergy effect and real benefits. Specifically, the study encourages collaborations among attractions with different theme types and does not support collaborations between NAs or between MAs. For enhancing the aggregate appeal of a destination, it is critical for destination management organizations to take strategies to foster the positive spatial interdependency, as well as to depress the negative one. Accordingly, geographically proximate attractions should provide differentiated product themes to demonstrate their uniqueness. The thematic complementariness may be achieved through adjusting product characteristics to present different travel experience (Weidenfeld et al., 2010, 2011). Once the product themes of attractions are differentiated effectively, compatibility can take place and the aggregate appeal of a destination can increase. Decision makers should take into account spatial interdependency when choosing location for a new attraction. This study does not support the spatial agglomeration of NAs or the agglomeration of MAs in a particular space due to the negative spatial effects, but encourages the spatial agglomeration of attractions with distinctly diversified themes. The spatial effect should not be ignored when travel agencies design an itinerary for tourists. The attractiveness of a particular itinerary relies on the effective bundling of attractions to allow tourists to get the maximum travel experience within a limited travel time and budget. Partner attractions should produce compatible effects for each other, resulting in a satisfying tourism experience.
The limitations of this study should be noted. First, the results of this study are based within the context of GD province, China and may differ in different contexts. Second, due to data limitations, this study uses only the aggregate data of tourist arrivals for analysis. If the data can be divided by the tourist type, researchers can investigate how the spatial interdependency of attractions changes as the type of tourists varies. Also, due to the restriction from the data source for monthly tourist arrivals of attractions, we cannot extend the analysis to the recent time period.
Footnotes
Declaration of conflicting interests
The author(s) declared no potential conflicts of interest with respect to the research, authorship, and/or publication of this article.
Funding
The author(s) disclosed receipt of the following financial support for the research, authorship, and/or publication of this article: This work was supported by the Natural Science Foundation of China under grant 71773101 and the Humanities and Social Science Foundation of Ministry of Education of P.R.C under the grant 16YJA790032.