
Abstract
This study aims to explore the regional wages inequalities and its relationship with the development of tourism and amenities endowment. We estimate a spatial error model for 29 metropolitan agglomerations in Argentina during the period 2004–2015. Four indices of touristic amenities that interact with tourism employment—as a proxy for tourism development—in labor income inequality estimations are used. Results show that the labor income distribution depends on the natural resources endowment, as well as the development of tourism in the agglomerates. A more equal distribution of labor income is observed in the agglomerates that have a greater presence of water-based resources, while the relationship is inverse in agglomerates with a greater presence of land-based resources. Also, the tourism employment has an unequal effect on labor income. In conclusion, the study shows the relevance of including aspects of regional development and resource endowment in the analysis of income inequality.
Keywords
Introduction
Over the last several decades, tourism has played a key role both as an income generator and as a source of employment, contributing to the economic growth and development of many countries around the world. Tourism has also been an important source of international receipts and, in the case of international tourism, is considered a nontraditional export. According to the World Travel and Tourism Council (2018a), it is estimated that travel and tourism sector generated US$8.3 trillion (representing 10.4% of the world’s gross domestic product (GDP)) and 313 million jobs (9.9% of total employment) for the world economy in 2017. In the period 2008–2017, it is observed an average annual growth in the economic contribution of the sector (4% in world’s GDP and 2.5% in employment). Specifically, in Argentina, the sector represented 10.3% of GDP and generated 9.8% of national employment in 2017 (World Travel and Tourism Council, 2018b).
Although tourism has long been recognized as a tool for regional and local economic development, it has only been recently that the World Bank and International Monetary Fund proposed it to be used in the fight against poverty in their Poverty Reduction Strategy Papers (Blake et al., 2008; Bolwell and Weinz, 2009). While there is a vast literature that has shown the contribution of tourism to income and employment, there is another line of research, from a microeconomic perspective, which has pointed out that employment in tourism has less favorable working conditions than other economic sectors and that it can have negative effects on income distribution. These opposing ideas have opened a debate on the effective contribution of tourism to the economy (Ashworth, 1992; Blake et al., 2008; Espinola, 2016; Gunderson and Ng, 2005; Hall, 2008; Leatherman and Marcouiller, 1996; Lee and Kang, 1998; Marcouiller et al., 2004).
More specifically, tourism has a direct effect on job creation and income generation, at national, regional, and local levels, but it also has strong indirect and induced impacts. A job in the tourism industry creates approximately 1.5 additional (indirect) jobs in an economy related to tourism. For example, in the accommodation industry, there is one employee per room and three workers (tourist guides, suppliers of beverages and food, gardens, employees of airports, and so on) that depend indirectly on each hotel employee (Bolwell and Weinz, 2009). Given this, the quantitative relevance for the level of employment is unquestionable. However, several studies argue that the tourism industry is characterized by jobs that require relatively low levels of schooling, little skills, are of short average tenure, have a high rate of informality, and with low relative wages as compared to the local economy’s average. These things negatively affect the average level of regional or local wages and income (Ashworth, 1992; Blake et al., 2008; Lee and Kang, 1998; Muñoz-Bullón, 2009; Santos and Varejão, 2007). Consequently, the level of development of tourism, a higher or a lesser dependence of a region on tourism activities, could generate income inequality (i.e. an increase in Gini coefficient) both between and within regions of a country.
The literature has likewise demonstrated that a region’s endowment of natural and built amenities is related to income distribution (Marcouiller et al., 2004; Roback, 1988; 1982). Amenities are a critical component of regional and local economies and constitute the basis for consuming and producing tourism: natural amenities mainly in rural contexts (Izón et al., 2016; Kim et al., 2005; Marcouiller et al., 2004; Margaryan and Fredman, 2017) and built and recreational amenities mainly in urban ones (Carlino and Saiz, 2008; Quackenbush et al., 2011). Furthermore, there are different theories about how amenities can affect income distribution (Goe and Green, 2005; Kuentzel and Ramaswamy, 2005; Marcouiller et al., 2004). On one side, amenities and resources play a crucial role as latent inputs in the tourism and recreation sector, and although they contribute to job creation, the related jobs, as previously mentioned, may be informal, temporary, and low-skilled, factors which would negatively affect income distribution. On the other side, natural amenities provide an attraction for amenity-based migrants, many of whom are highly educated, mobile, and dependent on technology. Moreover, natural amenities—when they are persistent—are believed to anchor cities (or neighborhoods) to high income over time and to exhibit a persistent spatial distribution of income (Lee and Lin, 2017).
This article explores two critical features of labor income distribution: the relationship between the regional development of tourism based on the endowment of amenities and the effect of this development on labor income inequality. This study develops an econometric model for Argentina that incorporates four alternative natural and built amenity types and examines their interaction with tourism employment and other growth variables, to explain the distribution of income as measured by the Gini coefficient of labor income. A panel of data is created for the 29 agglomerations of Argentina for the period 2004–2015, according to the availability of information. As amenity attributes are not randomly spatially located but are quite often found in clusters, they should not be treated as random variables in classical linear models. Then, we estimate a spatial error model (SEM) to incorporate the spatial autocorrelation of amenities through the error term and account for their regional distribution (Anselin and Bera, 1998; Izón et al., 2016).
As we already mentioned, literature has advanced a definition and characterization of tourism and recreation-based regions taking into account the endowment of amenities, sources, the local services, and other variables that can be used to analyze regional differences in employment, wages, and income, as well as the possible effects on income distribution. This article takes up this approach and offers a novel contribution to the field of tourism economics by constructing touristic amenities indices to analyze the relationship between the development of tourism, employment, and income at the local level (agglomerates) in Argentina. It represents the first attempt to apply this type of methodology to a country in Latin America.
Background and literature review
Tourism and income distribution
Previous studies on this topic have focused mainly on the role of tourism as a source of growth and development in specific regions of a country (Leatherman and Marcouiller, 1996; Porto, 1999). Different authors have investigated the relationship between the development of the tourism sector and its effects on employment and regional income distribution (Lee and Kang, 1998; O’Hare and Barrett, 1999), but limitations in defining the tourism sector and a lack of available data have inhibited a comprehensive analysis. Consequently, results have not been conclusive and this has been particularly true for developing countries.
Although the analysis of the distributive effects of tourism is a relatively new area of research, we can identify three major existing lines of inquiry. First, some studies have examined the impact of tourism on income distribution in tourism subsectors as compared to nontourism subsectors (manufacturing and agriculture) through computable general equilibrium models. This methodology requires significant data and relies on an essential number of assumptions. Blake et al. (2008) and Blake (2008) carried out studies for Brazil and Kenya, and Tanzania and Uganda, respectively. They reach an interesting conclusion that hotels and restaurants have a strong backward interdependence with the rest of the economy and make an income contribution to poor households that are below the average. Incera and Fernández (2015) demonstrate, for Galicia (Spain), that tourism consumption has significant positive effects on all income groups, though high-income households benefit more than low-income ones, contributing to a slight increase in income inequality.
A second line of inquiry has computed the Gini coefficient to analyze the distributive effects of tourism, using census and employment data, as well as income and wage surveys. Lee and Kang (1998) found that tourism generates a moderately equal distribution of earnings in South Korea. On one side, tourism—as compared to secondary and tertiary industries—is more likely to improve living standards for the lower income class. On the other side, the analysis of median earnings indicates that tourism is a low-wage industry and it is considered to be advantageous to female workers concerning earnings inequality and level of earnings. Marcouiller and Xia (2008) presented similar results for various counties in the United States, emphasizing that income inequality generated by tourism employment is related to specific spatial activities. Lacher and Oh (2012) compare income distribution from tourism-generated jobs to the overall income distribution, suggesting that tourism provides more jobs with low wages in comparison with the global economy of the regions examined.
Finally, a third group of studies (with methods closely related to those used in this article) examine not only the regional structure of employment, income, and wages but also the degree of dependence on tourism in the geographic units under analysis. These studies measure tourism dependence in different ways: by taking into account amenities and other variables (English et al., 2000; Reeder and Brown, 2005) or by using a dummy variable of touristic development based on economic characteristics of tourism industry (employment, wages, and hotels receipts) (Lee and O’Leary, 2008).
Tourism and amenities
Amenities are an attribute set that summarizes a historical, cultural, geographical, or natural touristic environment. As there are no standardized definitions, each study has attributed the degree of importance that its authors deemed appropriate according to different factors (Brueckner et al., 1999; Glaeser et al., 2001; Lee and Lin, 2017; Marcouiller et al., 2004; Nord and Cromartie, 1997). Brueckner et al. (1999) distinguished three groups: natural, historical and built, and modern amenities. Glaeser et al. (2001) described amenities as the available goods and services, the aesthetic and physical characteristics of geographic units, available public services, and the facility and mobility of access. Lee and Lin (2017) distinguished between natural amenities and endogenous features such us safety, school quality, or shopping. Most of these studies use classification systems that differentiate between natural attributes, urban aspects, and environmental quality and, as a result, do not take built amenities into account.
A few studies have applied amenities-based analysis to tourism, but most have examined counties in the United States. Marcouiller et al. (2004) analyzed the effects of natural amenities on income distribution (as measured by Gini coefficient) for tourism and nontourism activities for US lake states, showing that certain types of natural amenities (principally, water-based amenities) are related to income distribution and, in particular, associated with a more equal income distribution, contrasting the hypothesis of hollowing out of income distribution (English et al., 2000; Leatherman and Marcouiller, 1996; 1999). The polarization or hollowing out of income distribution is a phenomenon that refers to the decreasing tendency of middle-income or middle-class households, a fact that accentuates income inequality. Lee and O’Leary (2008) analyzed the determinants of income inequality in nonmetropolitan recreation, manufacture, and agriculture counties in the United States. The study found that income inequality increased during the period 1990–2000 and that it held a positive relationship with benefits in the recreation and tourism industry.
English et al. (2000) evaluated some sociodemographic characteristics (income, population, economic structure, and housing variables) in nonmetropolitan counties in the United States that, in general, are recreation-amenity-dependent. They showed that recreation- and tourism-dependent counties have higher average income, lower economic diversity, and higher household costs, as compared to other counties. Gunderson and Ng (2005) performed a similar analysis using quantile regression, and their results showed that the average per capita income in tourism-dependent counties is lower than in non-tourism-dependent counties, contrasting with the findings laid out in English et al. (2000).
Finally, Reeder and Brown (2005) developed a regression analysis to evaluate the effect of tourism development on socioeconomic conditions in rural recreation counties in the United States. They found that recreation and tourism development generate a majority of positive results (rural well-being, higher local employment, wage levels and income, better education and health, and lower poverty), but they also note, as a negative effect, the higher costs of housing.
Other types of recent studies emphasize the role of amenities, in particular natural amenities, their regional variation and distribution, and their relationship with nature-based tourism supply (Fredman et al., 2012; Margaryan and Fredman, 2017; Mollard and Vollet, 2015). Finally, some authors study the spatial pattern of the distribution of amenities related to the corresponding one to hotels or resorts (Cremer-Schulte and Dissart, 2015; Lee et al., 2018).
Methodology and data
Estimation model
The equation to estimate is as follows:

where matrix
So, if we consider the presence of spatial autocorrelation, the method of ordinary least squares tends to underestimate the error term and generates inefficient variance estimators that affect the levels of statistical significance of the variables. This could lead to misinterpretation of results and incorrect policy implications (Anselin and Bera, 1998; Arlinghaus, 1995; Rey and Montouri, 1999). According to the literature, the application of an SEM is one of the best ways to solve this problem (Kim et al., 2005; Marcouiller et al., 2004). This model considers the possible spatial autocorrelation of amenities in the error term, and it is assumed that the random error term has the following form:

where εit is the uncorrelated error vector with N (0, s 2), and the scalar λ is the spatial autoregressive coefficient to be estimated. An SEM includes a (n × n) positive and symmetric spatial weights matrix, W. The spatial weight matrix is often expressed as a first-order contiguity matrix for incorporating the values of variables in adjacent geographic areas. The elements wij of W are 1 when agglomerates i and j are defined as neighbors and 0 when they are not neighbors.
In addition, the selection of the spatial structure of the model was corroborated by the Lagrange multiplier (LM) tests: the presence of spatial autocorrelation in the error term (SEM) or a model with a substantive spatial structure (spatial autoregressive model (SAR)) is presented as alternative hypotheses against the null hypothesis of no spatial correlation (Anselin and Bera, 1998; Doreian, 1980; LeSage, 1997). The results of the LM tests show that the alternative hypothesis of an SEM is accepted and the alternative hypothesis of an SAR is rejected. So, we use an SEM to incorporate the spatial autocorrelation of natural amenities in the model.
In this study, we use a panel of data for 29 metropolitan agglomerates in Argentina for the period 2004–2015. The SEM can be estimated through fixed effects (FE) or random effects (RE). The RE specification assumes that the heterogeneities among the agglomerates are random variables and that they are not correlated with the regressors incorporated in the estimation, whereas the specification of FE assumes that the unobserved heterogeneities are invariant over time. The choice between RE and FE can be made through a Hausman (1978) contrast test. Moreover, the decision can be based on an empirical criterion, as explained below.
According to Larraz et al. (2015), if the number of groups is relatively small, it is convenient to use FE as this method requires less restrictive assumptions regarding the behavior of the β parameters. In the case of a panel structure with numerous groups, FE must estimate an enormous number of coefficients, causing a significant loss of degrees of freedom. In the latter case, RE are useful as they only require the estimation of a single parameter (the intergroup variance) to describe the heterogeneity of the data. Another aspect to consider is that, under the traditional assumptions of the general linear model, the RE are efficient. However, the violation of the assumption of exogeneity generates inconsistency within these effects, but not within the FE. Considering the nature of the model with a small number of groups (29 agglomerates), the specification with FE was chosen.
Data
This study uses data from Argentina’s Permanent Household Survey, the most important database in the country, which contains cross-sectional information on sociodemographic, geographic, and labor variables—including labor income—over an extensive period of time. This database is limited in that it only includes data from urban areas (metropolitan agglomerates). The selection criterion of the period is also due to a characteristic of the database, since from the year 2004 it begins to be a continuous data set. From that point, a decade of analysis was chosen. As natural amenities are usually located outside these metropolitan areas, the natural amenities indices elaborated in this article use provincial-level averages. It is a strong assumption, and it is a limitation of the study, but it is the best approximation that could be made to measure the natural amenities endowment given the actual scenario of information. According to the availability of information, we generate a balanced panel of data with 29 metropolitan agglomerates in the first-semester period, from 2004 to 2015.
The Gini index is used as a measure of labor income inequality. 1 This index varies between 0 and 1, with a higher value indicating greater inequality. It is important to note that the index is not affected by changes in scale which implies, for example, that a lower (higher) observed inequality in one agglomerate as compared to a second would not respond to a relative situation of lower (higher) average labor income in the first agglomerate, but to a condition of lower (higher) relative inequality per se.
According to literature review, we measure tourism development through the regional endowment of amenities. Amenities are a key input for tourism production, generation of employment, and income. We compute four indices of touristic amenities for each agglomerate: land-based natural amenities, water-based natural amenities, historical–cultural amenities, and recreational amenities. To homogenize and group the variables, we used an arithmetic average of a set of standardized variables for each typology. It is a simple methodological strategy, but due to the limitations of the available information, it is not possible to use a more complex methodological procedure such as weighted averages or a principal component. The selected variables are based on the specialized literature (Deller et al., 2001; English et al., 2000; Marcouiller et al., 2004). In the Online Appendix, we present the main methodological aspects of the empirical strategy and the variables used for the elaboration of amenities indices.
In Argentina, there is no database on the endowment of natural and built resources. So, an exhaustive search and systematization of data were carried out from different sources of information at national, provincial, and municipal levels, which provide information about the whole spectrum of variables identified to compute the indices. The sources of information used were National Institute of Statistics and Census, provincial tourism secretaries, local tourism subsecretaries, Argentine Cultural Information System, Federal System of Protected Areas, as well as different Internet information pages.
For the econometric estimation, the indices of touristic amenities are interacted with the share of tourism employment in the locality, as a more precise proxy for the measurement of tourism development. This interaction aims to capture the exploitation or potential use of natural and built resources for tourism production, reflected in demand for tourism workers (higher production and higher employment).
In this study, tourism sector employment is defined using a supply perspective that follows Marcouiller and Xia (2008) and Espinola (2016). We consider employment generated in establishments that are primarily dedicated to one of the following economic activities: (1) accommodation services; (2) restaurants; (3) passenger transport services; (4) travel agencies and complementary tourist support activities; and (5) entertainment, cultural, and sporting services. It should be noted that while this study works with a specific definition of tourism employment (detailed above), the article is aware about the problem of defining correctly the tourism sector and the lack of information needed to construct an integrated measure of the sector.
Table 1 presents a simplified characterization of the agglomerates, the geographical units of analysis of the study, for 2015. Agglomerates (column 1) are included in their respective region (column 2) and are defined by their main type of amenities (column 3). The agglomerates in the Northwest and Northeast regions have mainly natural (land-based) amenities; Greater Buenos Aires and Pampeana regions have predominantly cultural and recreational amenities; and Cuyo and Patagonia regions reveal a mixed composition of water-based and recreational-based amenities. All agglomerates show a decreasing tendency in labor income inequality (Gini index, columns 4 and 5) over the last years, but there is a large gap in some cases. For example, there is a 2:1 difference between the highest (Salta, 0.4048) and the lowest (Ushuaia–Rio Grande, 0.2615) Gini coefficients. The latter had the greatest decrease in the analyzed period and the highest level of average labor income. The tourism employment rate (column 6) varies between 2.97% (Santa Rosa) and 10.20% (Salta), being the total average of 6.73%. Salta is the agglomerate with more employment in tourism and greater income inequality. A high disparity in average labor income among agglomerates is also observed for 2015 (column 7). Agglomerates of Northwest and Northeast regions present labor income indices below the average, while Patagonia and Cuyo regions show values above the average.
Characterization of agglomerates (2015).

Note: GBA: Greater Buenos Aires.
Source: Own elaboration based on the Argentina’s Permanent Household Survey.
Table 2 presents a statistical description of the variables of the proposed model for 2015. Our variables of interest are the amenities indices and the tourism employment rate. The other variables are included as control variables, which are expressed as a percentage of workers per agglomerate and year.
Description of variables of the model (2015).
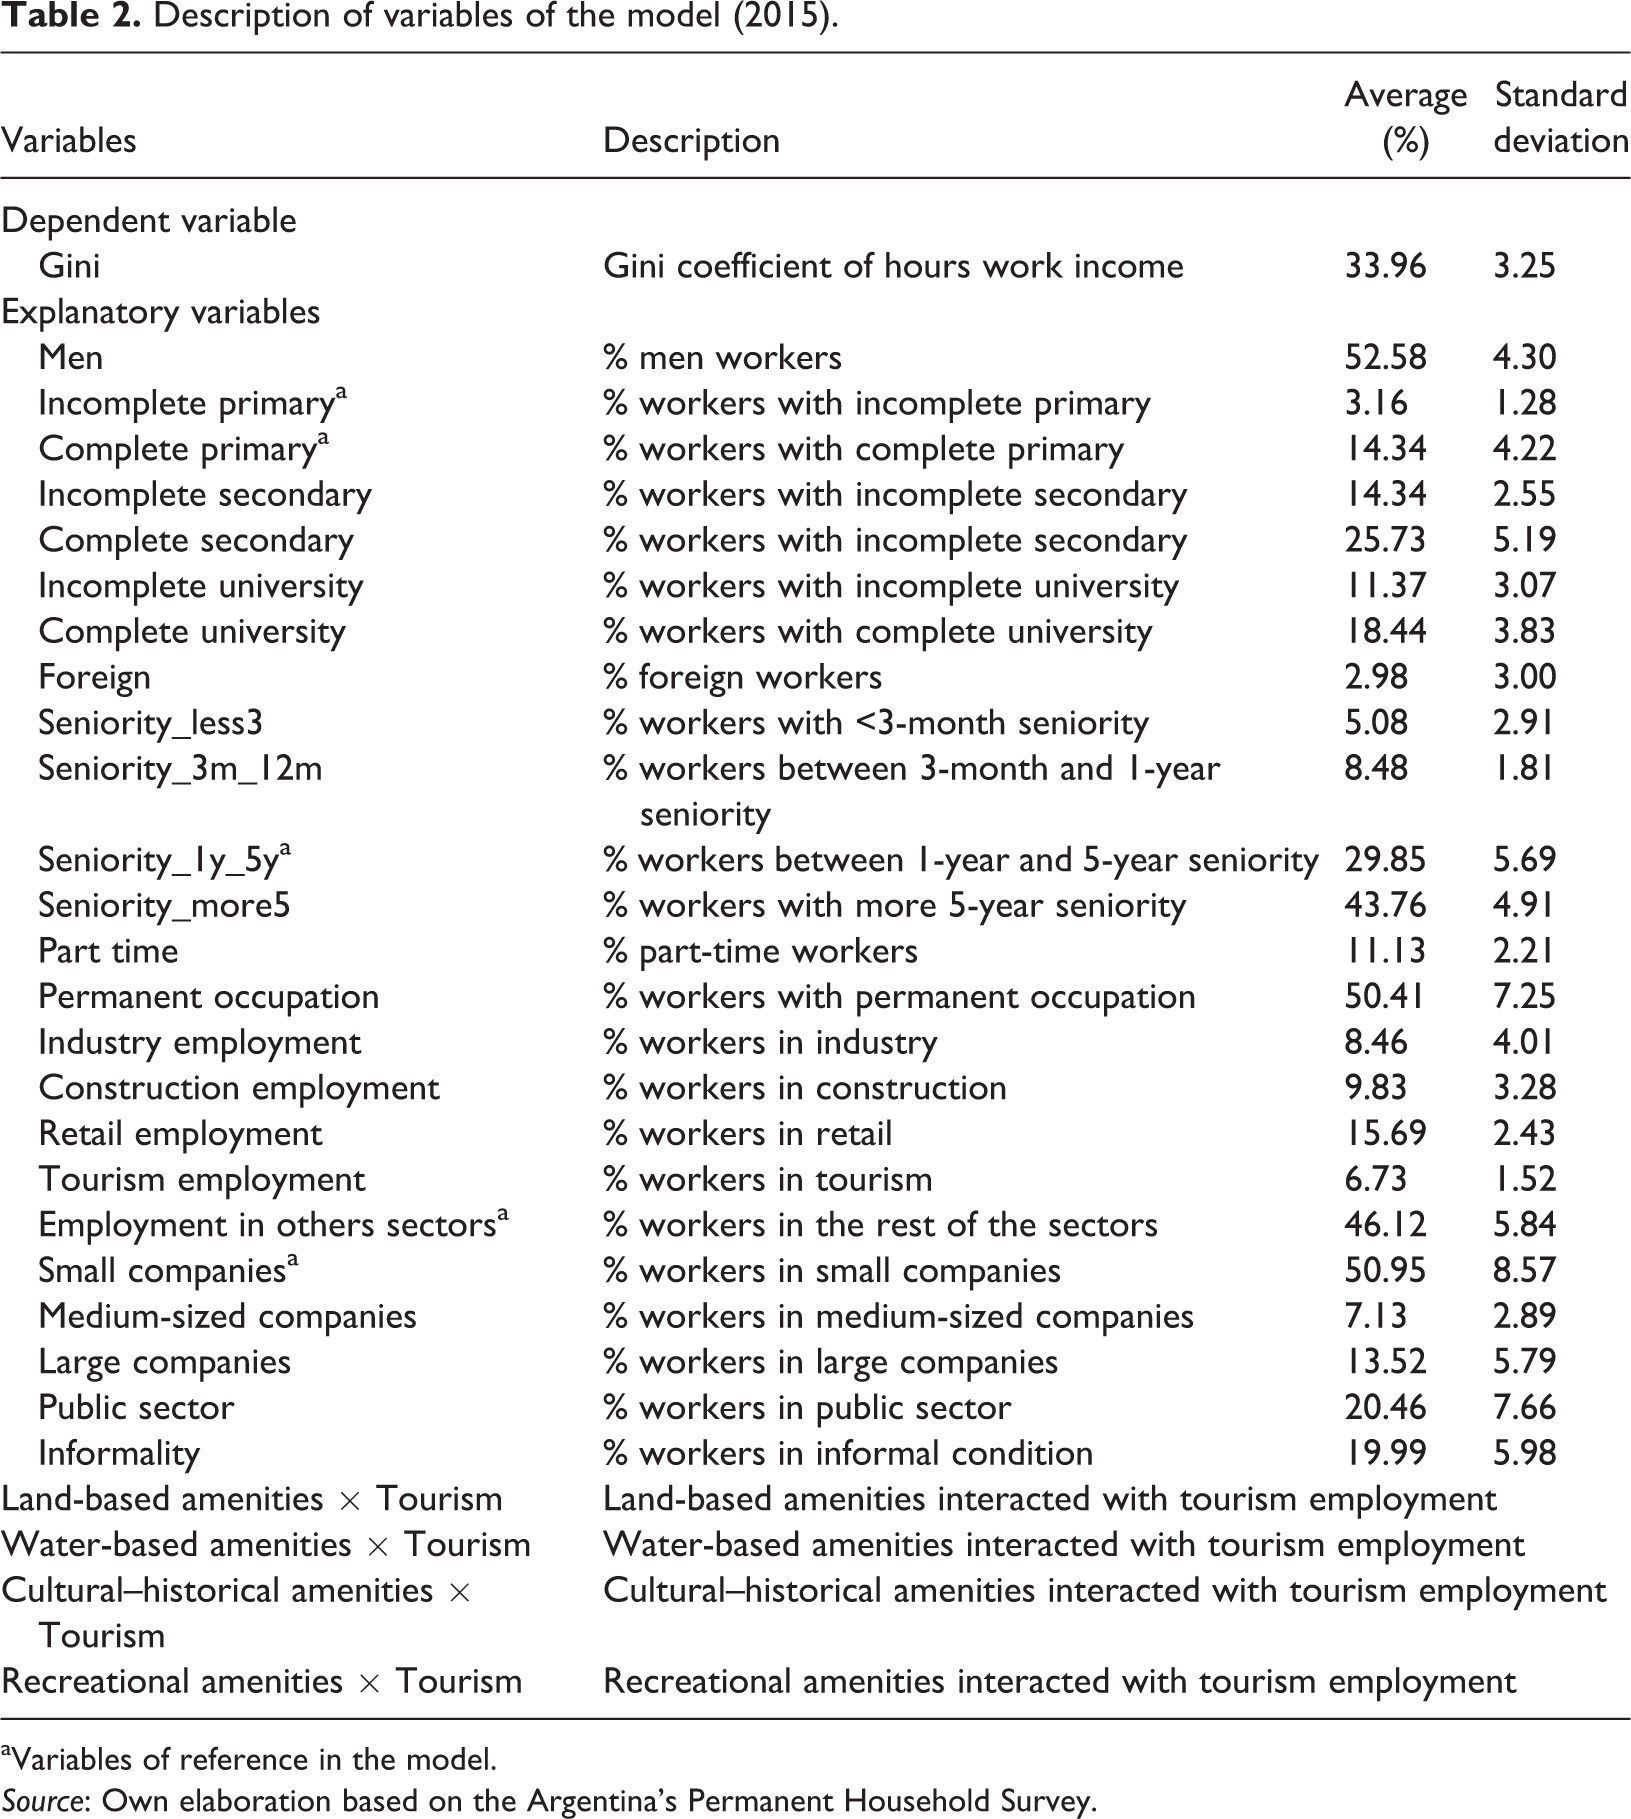
aVariables of reference in the model.
Source: Own elaboration based on the Argentina’s Permanent Household Survey.
Results
Spatial analysis of tourist amenities
Our initial data analysis (exploratory spatial data analysis (ESDA)) is performed by Moran’s Index, the most widely used statistic for analyzing and detecting spatial association patterns (Moran, 1950). This index measures spatial autocorrelation based on both feature locations and feature values, simultaneously. Given a set of features and an associated attribute, it evaluates whether the pattern expressed is clustered, dispersed, or random. Moran’s Index can be expressed as follows:
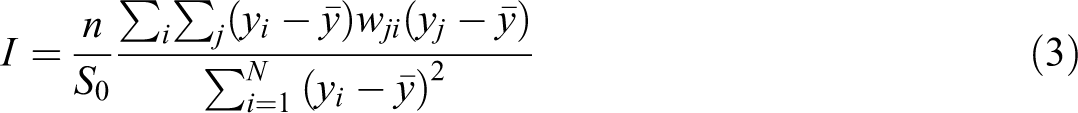
where
According to the results of Moran’s Index for the Gini coefficient and touristic amenities indices, variables are not randomly distributed (Table 3). Positive spatial autocorrelation in income inequality and water-based amenities and negative spatial autocorrelation in land-based and built amenities are observed. These features are in line with Kim et al. (2005) who affirm that place in space matters when thinking about economic growth and development through the exploitation of amenities. Results show that there is a clustered pattern between agglomerates for water-based amenities and a dispersed pattern with its neighbors for land-based amenities and built amenities.
Moran’s Index for Gini coefficient and tourist amenities.
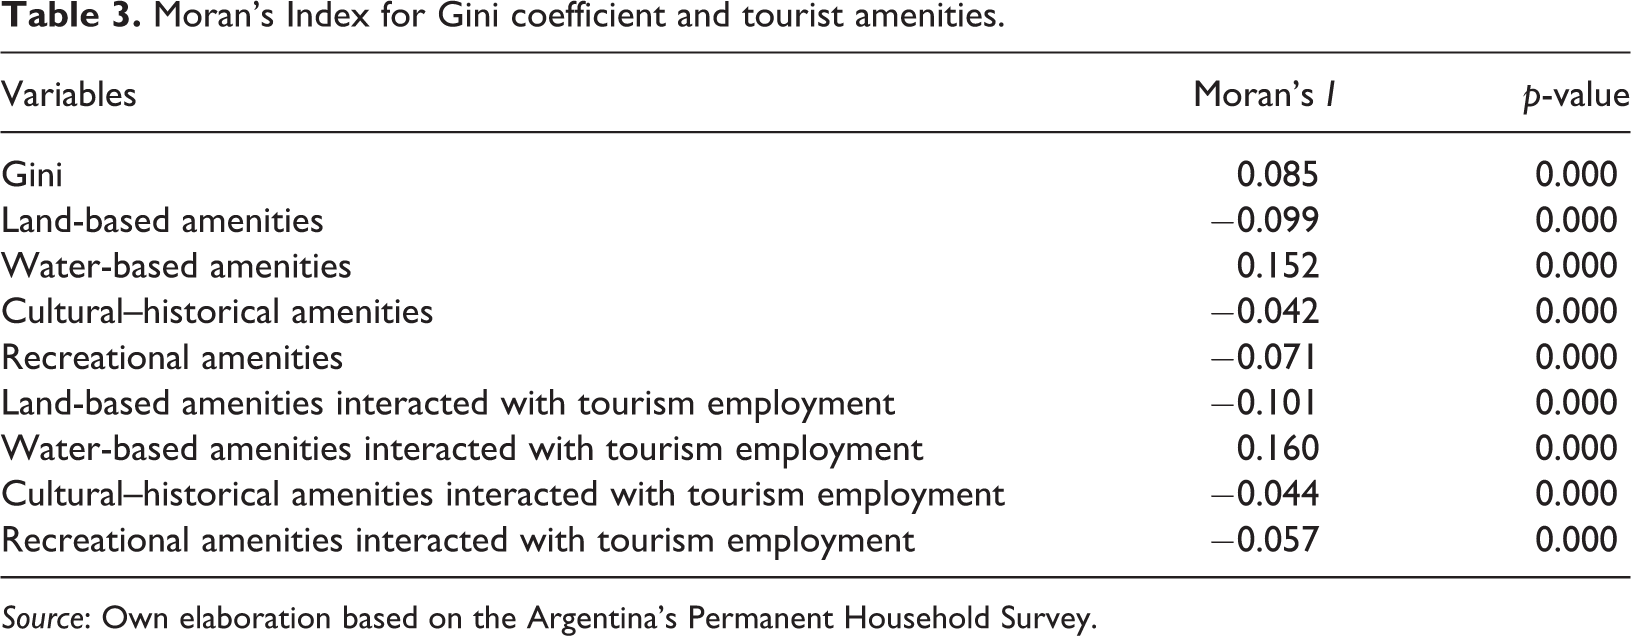
Source: Own elaboration based on the Argentina’s Permanent Household Survey.
Also, the Moran scatter plot for amenities is shown in Figure 1, which reinforces the results obtained using Moran’s Index. The Moran scatter plot is based on Moran’s Index and shows the degree of linear association between the value of a variable x in the spatial unit i and the spatially weighted mean of the neighboring values of variable x, Wx (or spatial lag) (Anselin and Bera, 1998). The Moran scatter plot can be divided into four quadrants to indicate different types of spatial association between the values of a location (x) and its spatial lag (Wx). Quadrants I and III represent positive spatial association because low–low and high–high values are associated, respectively. Quadrants II and IV indicate negative spatial association because high–low and low–high values are associated, respectively.
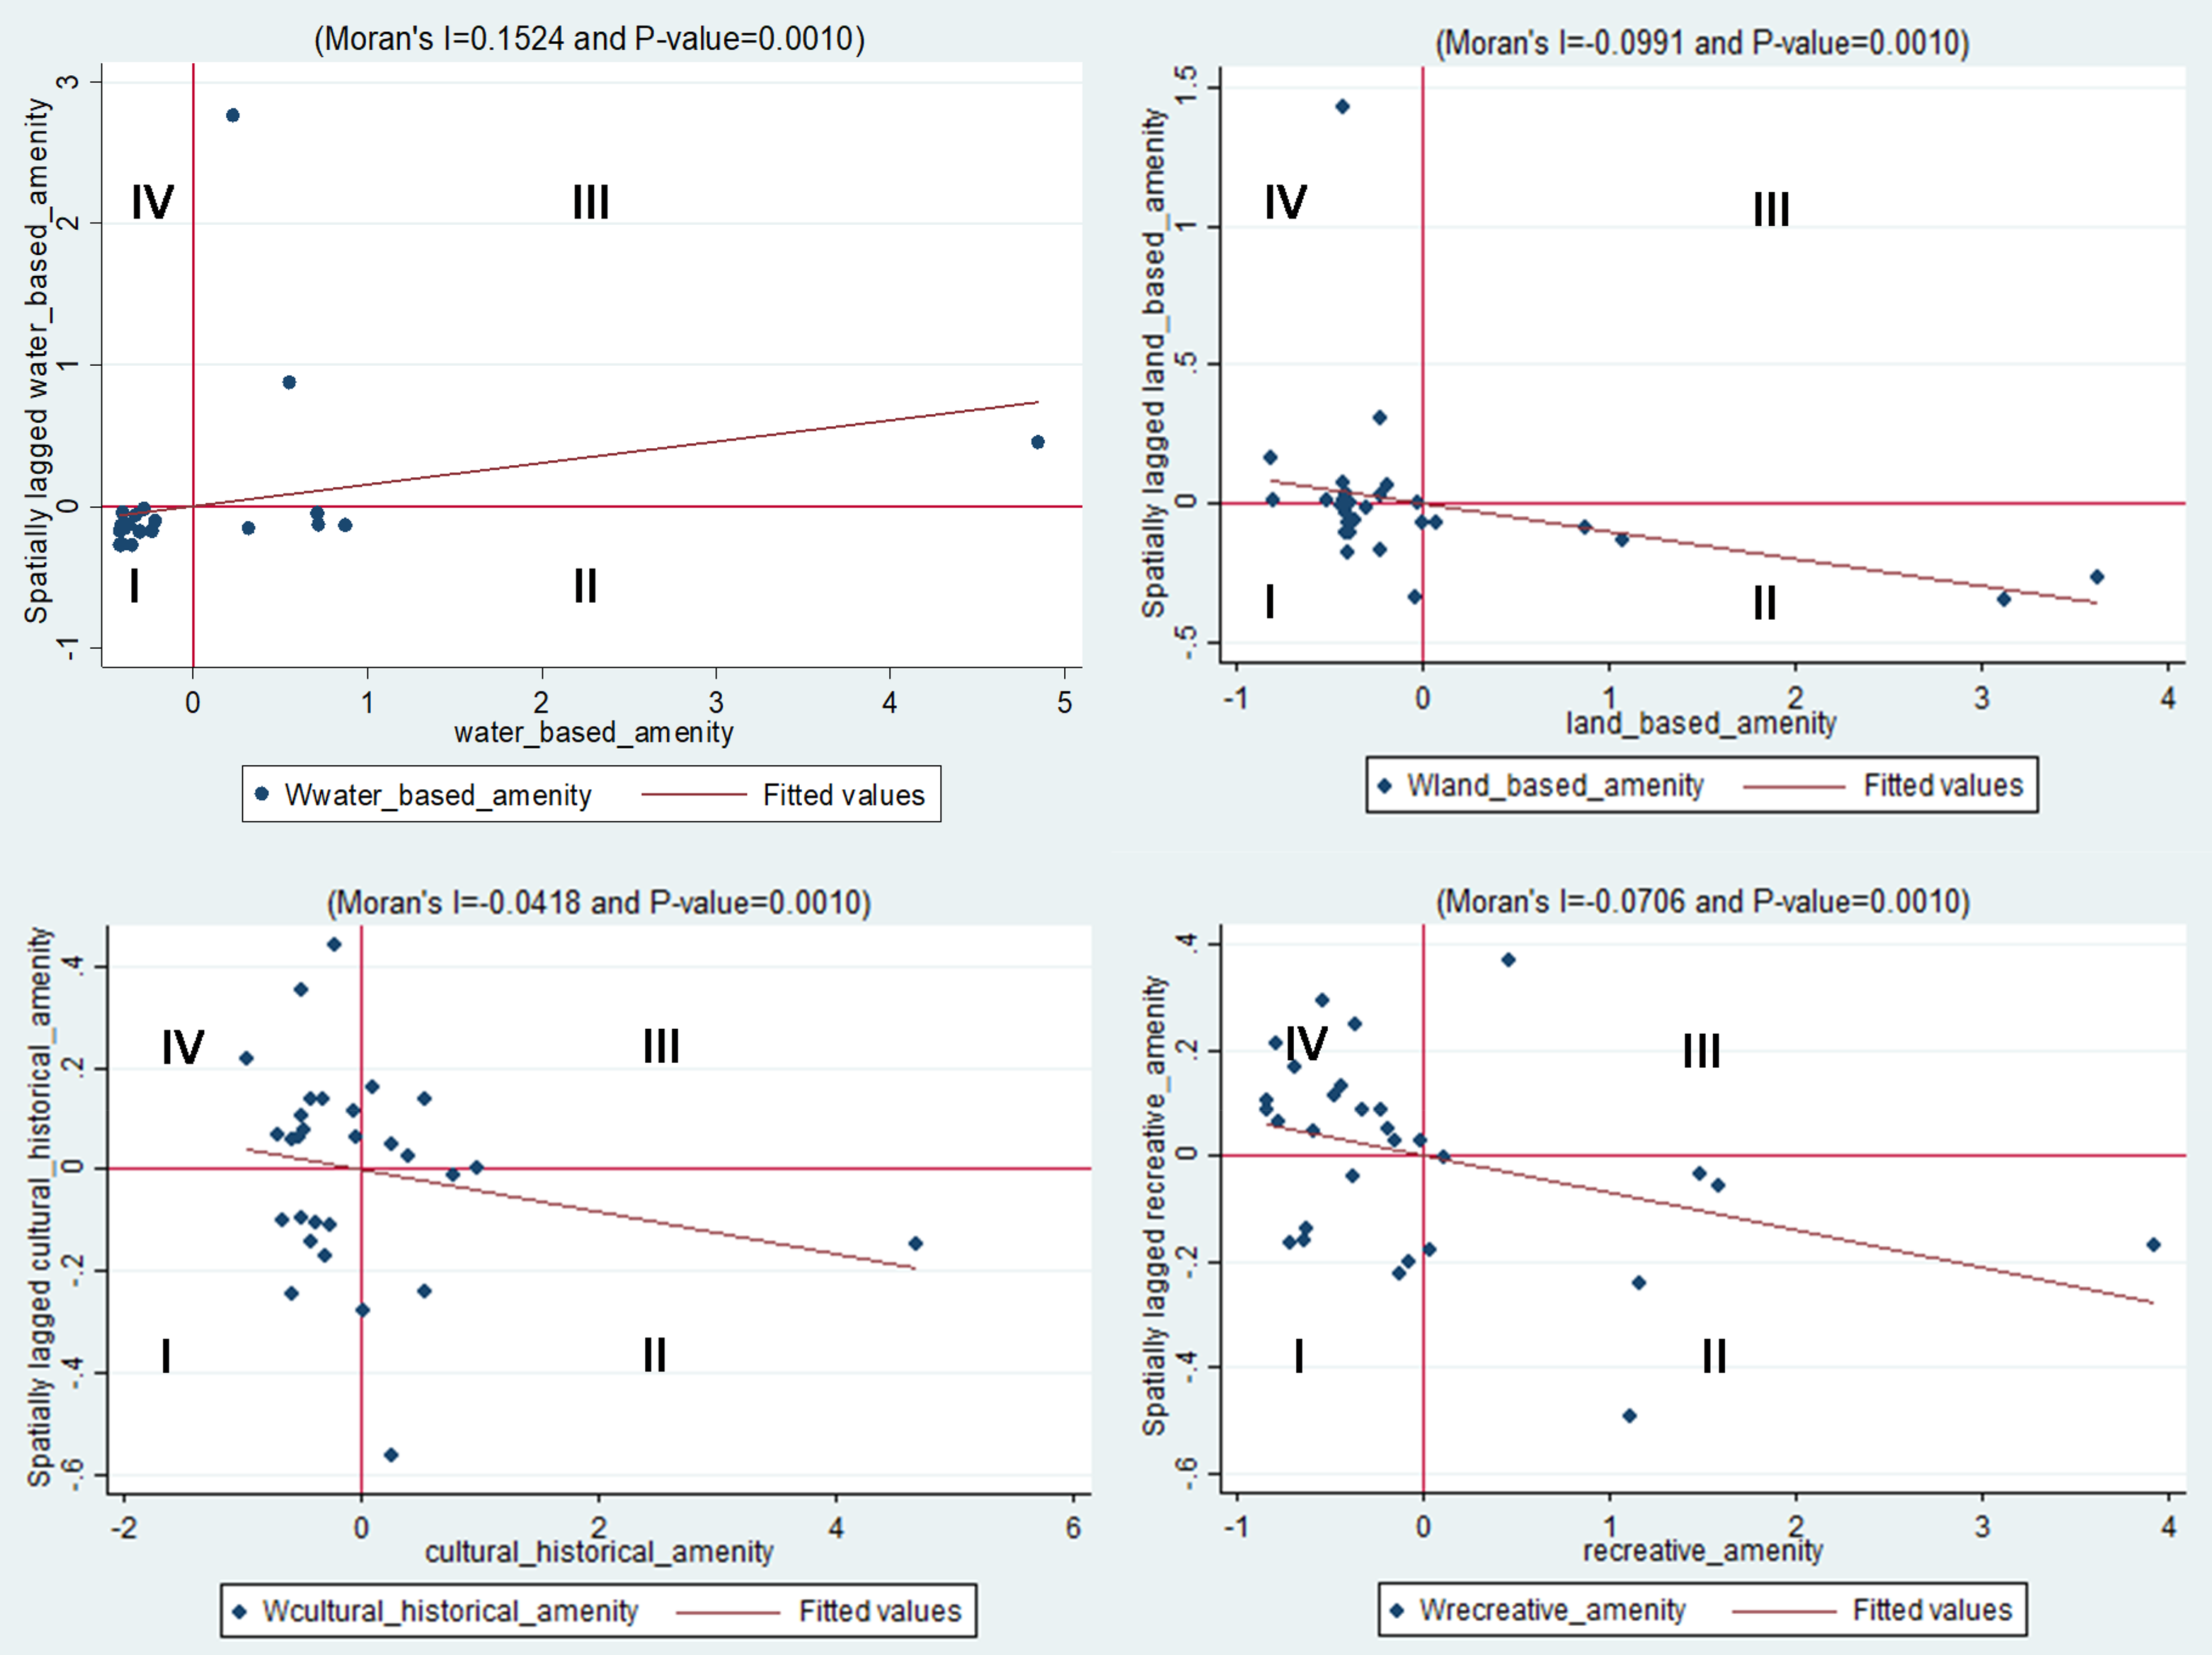
Moran scatter plot for types of amenities.
For water-based amenities, there are positive spatial autocorrelation between the standardized variable and its spatial lag, and most values are concentrated in Quadrant I (low–low), showing a clustered pattern. That is, a low–low association for water-based amenities means that if a spatial geographical unit has a low level and distribution of this type of amenities, its neighbors will also have a low level and distribution of them. Land-based and built amenities (cultural and recreational amenities) present a negative spatial autocorrelation, and values are concentrated in Quadrants II and IV, showing dispersion patterns.
In sum, the ESDA confirms the hypothesis that the amenities are not randomly located, and they present a spatial association, supporting the use of a spatial econometric model.
A complementary analysis through maps on Figures 2 and 3 also shows the spatial patterns in the variables. The Northwest and Northeast regions have a more unequal income distribution, compared to the Patagonia (South) region, in line with what was previously analyzed. Tourism employment has a high concentration in Greater Buenos Aires and Pampeana (Center) and Northwest regions (Figure 2).
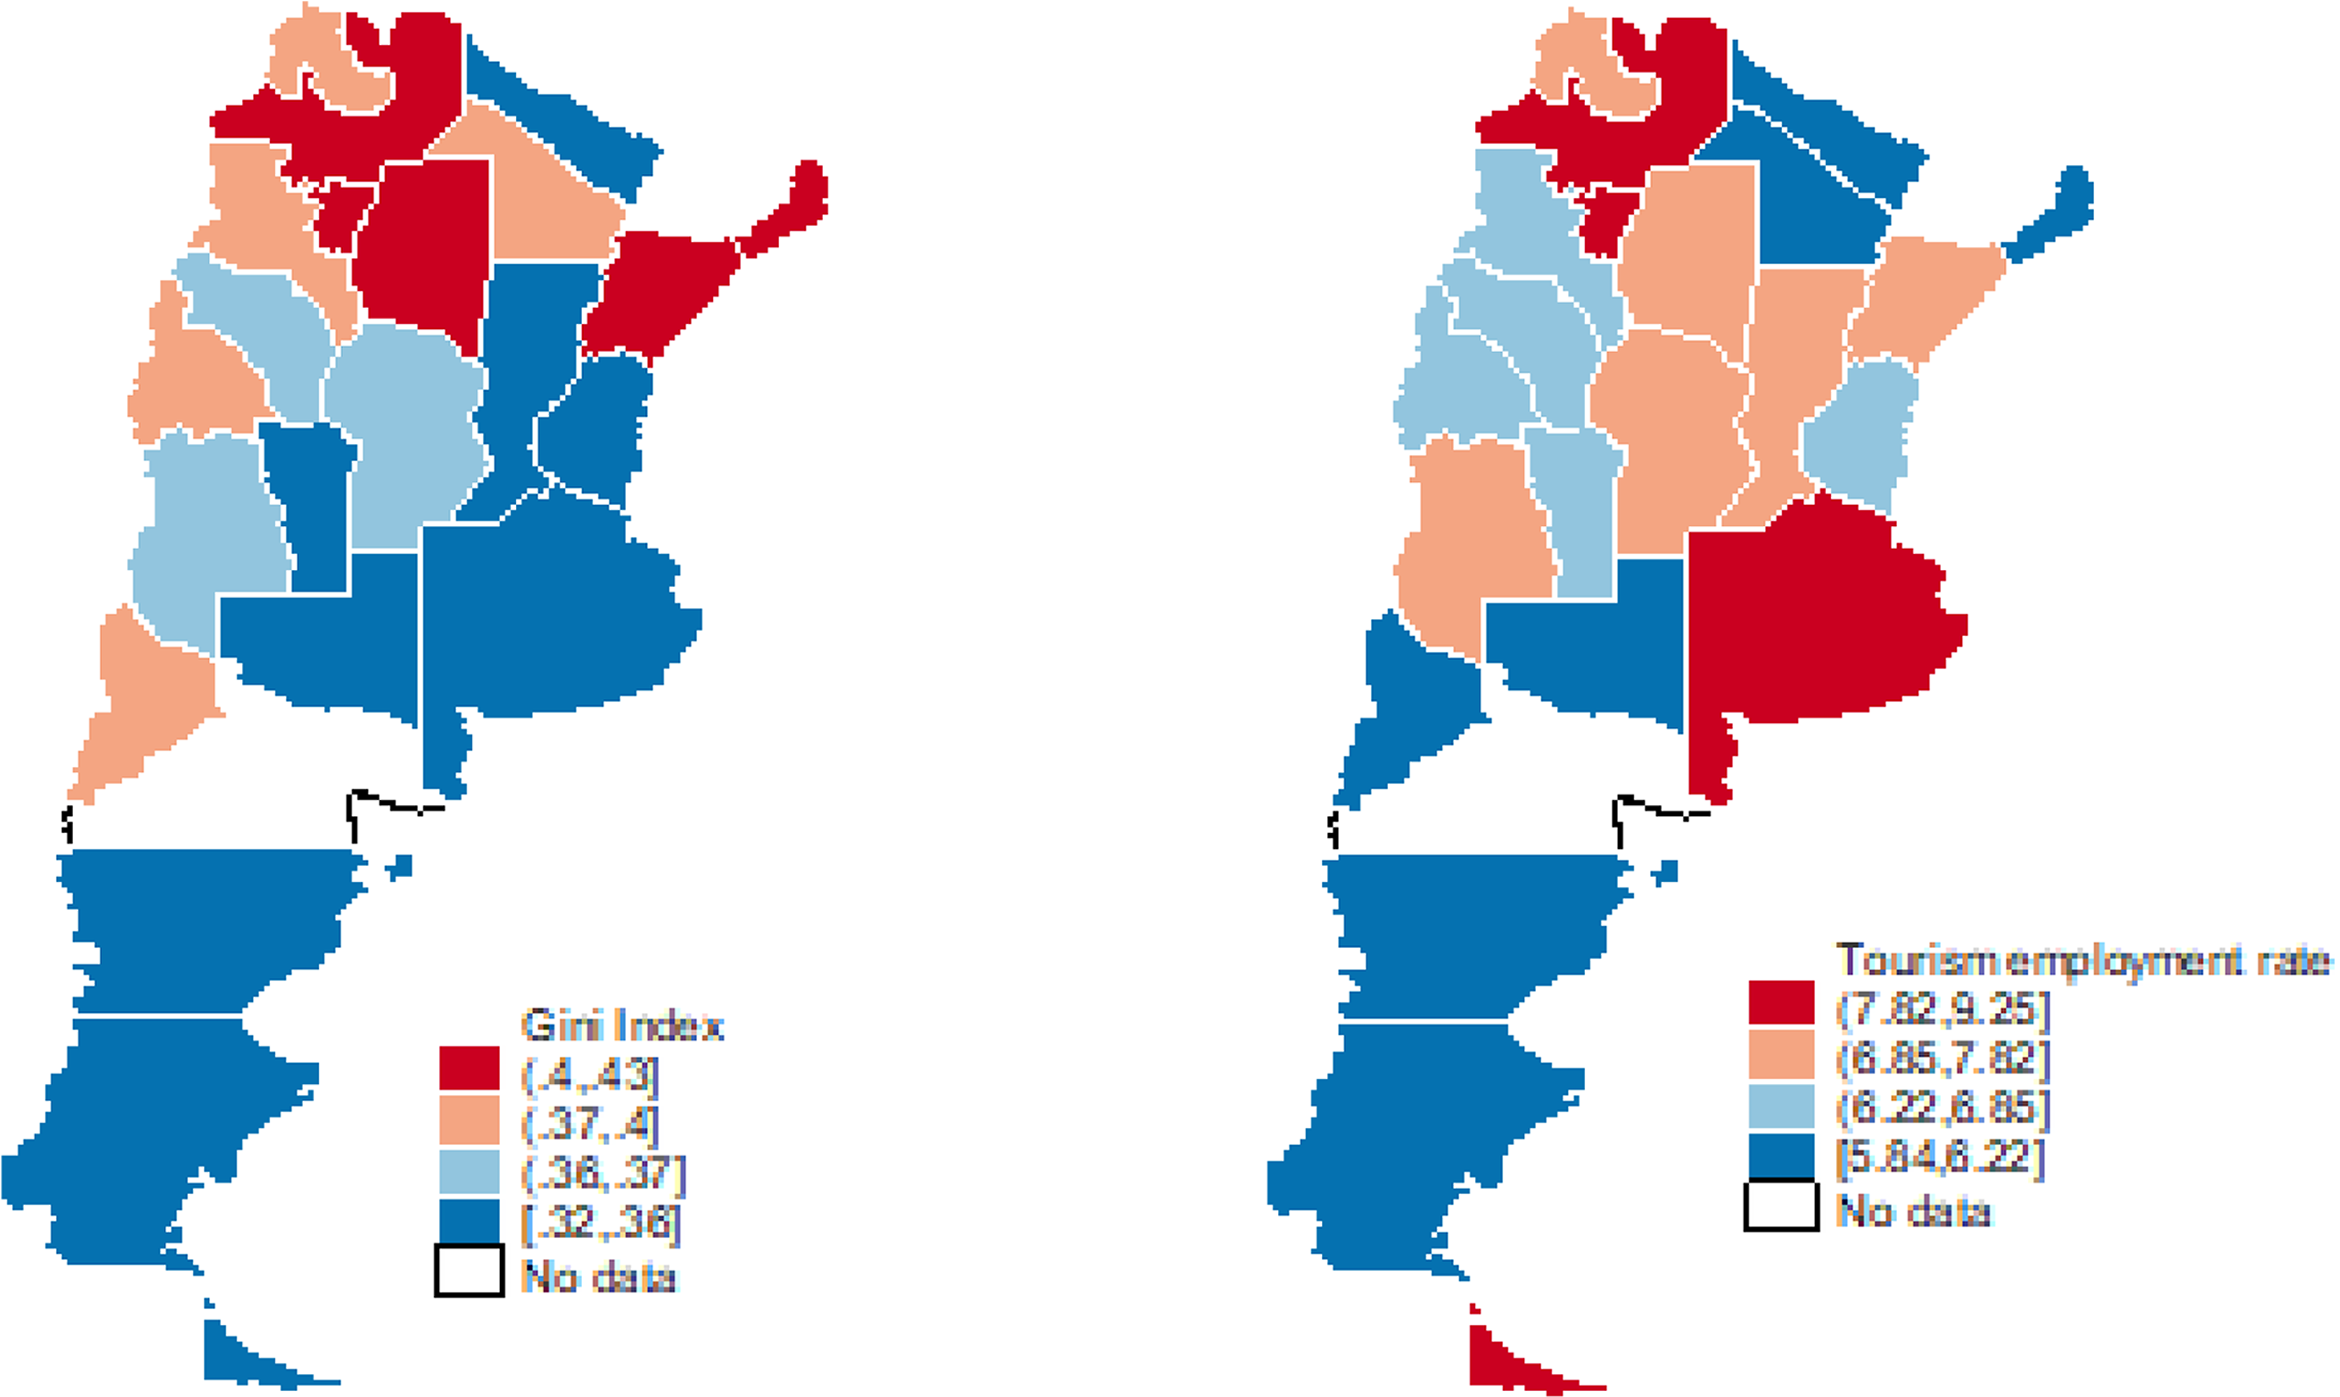
Average Gini index and tourism employment rate per province in Argentina in 2015.
In relation to the amenities, they also show a spatial pattern, dividing the country into four large regions based on the attributes of each type of amenity (Figure 3).
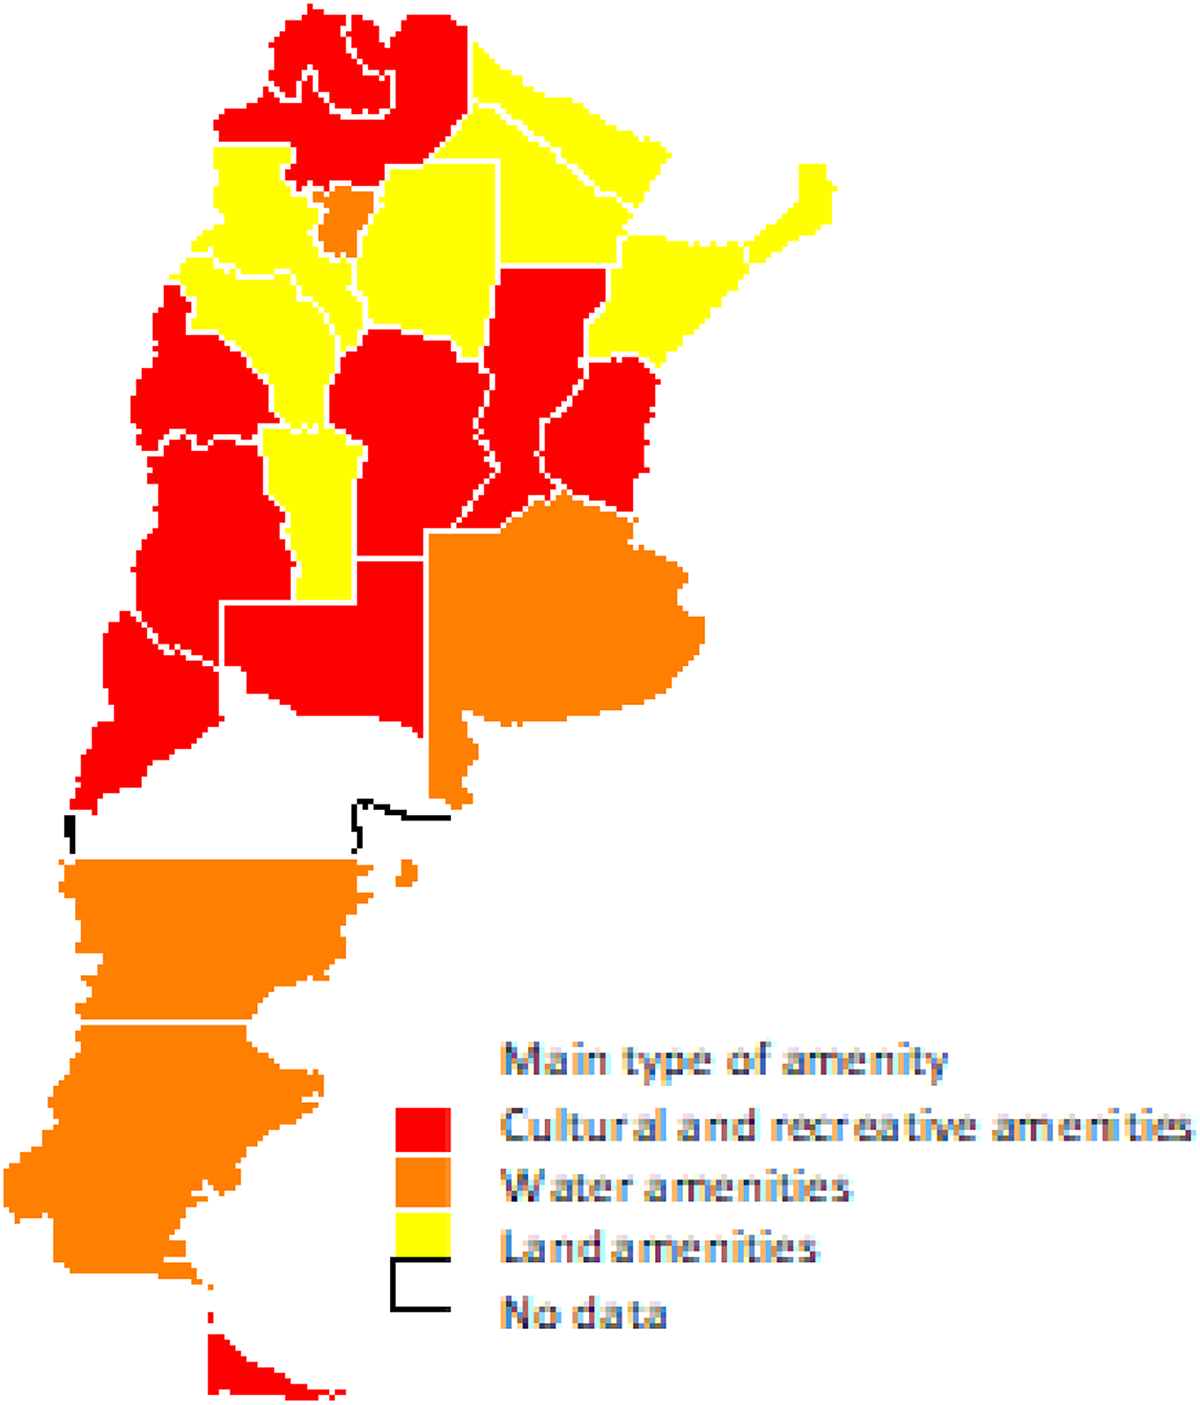
Main type of amenity per province in Argentina.
Analysis of the relationship between income distribution and tourist development
Results of the estimation of the SEM are shown in Table 4. 2 In column 1, we present the model estimated by FE without correction of spatial correlation in the error terms. In this case, it can be seen that the goodness of fit is high, which could be indicating a possible specification problem. The results for the SEM are presented in columns 2 to 7. The result of the LM test, previously mentioned, is shown in the last row. The spatial autoregressive coefficient (Lambda) is statistically significant, showing the presence of spatial autocorrelation in the error terms. However, it presents a negative sign, a result little common and counterintuitive. The existence of negative autocorrelation reflects that the residues of an agglomerate tend to be surrounded by neighbors with quite different residues. In other terms, the similar residues are not grouped in space but tend to be dispersed. This could be due to the existence of different spatial dependence patterns. In the ESDA, we observe different spatial autocorrelation patterns depending on the amenities. Other explanation could be the existence of aggregation errors in the elaboration of amenities variables. This last option is possible since the data were collected at the agglomerate urban level and provincial level, with the risk of committing aggregation errors. So, the analysis of the impact of amenities and the development of tourism with microdata could yield different results without necessarily contradicting those discussed here.
Results of spatial error estimated model.

Note: FE: fixed effects; LM: Lagrange multiplier. Standard errors in parentheses.
***p < 0.01; **p < 0.05; *p < 0.1.
Source: Own elaboration based on the Argentina’s Permanent Household Survey.
For the analysis of the relationship between regional tourism development and income inequality through an SEM, two types of variables are introduced into the model: the share of tourism-based employment in total employment in each agglomerate (column 2), the interaction between tourism amenities and tourism employment (columns 3 to 6) for the interaction term for each type of amenity separately, and column 7 for the inclusion of all the interactions terms. These interaction terms capture the effect of amenities-based tourism development.
The model shows that the share of tourism-based employment has an unequal effect on labor incomes. This result is associated with the theory that tourism development is worse than traditional forms of economic growth due to the relatively unfavorable characteristics of employment, in particular the lower wages and the negative labor features associated with service jobs like those of tourism (Ashworth, 1992; Marcouiller, 1997; Santos and Varejão, 2007). Espinola (2016) demonstrated that the tourism sector in Argentina is characterized by worse working conditions (low wages, high informality, low education level, and segregation in low-level qualification jobs), as compared to the nontourism service sector. Similar conclusions have been drawn for Portugal (Santos and Varejão, 2007), Spain (Muñoz-Bullón, 2009), and the United Kingdom (Purcell, 1997). The relatively lower labor characteristics of the tourism sector in the economy drive an unequal distribution of profits and tend to create a hollowing out of income distribution, leading to middle-income households becoming poorer (Leatherman and Marcouiller, 1996; 1999; Marcouiller et al., 2004). Lacher and Oh (2012) reinforced this idea and showed that jobs generated by tourism expenditures have a more unequal income distribution than the overall income distribution in three coastal regions of the United States and that the effect is more pronounced in urban areas.
Nevertheless, if tourism employment is interacted with amenities through the amenities-based tourism development, different results may be obtained. Only natural amenities have visible effects on income distribution in metropolitan agglomerates of Argentina, although the different kind of them (land vs. water) have opposite effects. Agglomerates with a major presence of land-based amenities have relatively more unequal labor income distribution, while those agglomerates with a major presence of water-based amenities have a relatively more equal labor income distribution. Our analysis suggests two possible explanations for this result. On the one hand, as Lee and Lin (2017) pointed out agglomerates with predominantly natural amenities have a mean higher income than other types, which could be influencing the distribution of income. In particular, agglomerates in Patagonia and Cuyo regions—both with mixed amenities (water and recreational)—have level incomes above the average. On the other hand, in the last years, water-based amenities have been the basis for a growing and expanding type of tourism with a high potential to attract new niches of tourism (European Commission, 2014; Jennings, 2007).
Following in the footsteps of previous research (English et al., 2000; Lee and O’Leary, 2008; Marcouiller et al., 2004; Reeder and Brown, 2005), this study supports the notion that tourism development—through the exploitation of natural amenities—is a way to reduce income inequalities, at least for water-based amenities.
These effects must be carefully considered when policymakers try to adopt natural amenities as a strategy for economic development. A regional spatial analysis as the one we have done here, to make a spatial distribution plan of amenities and inequalities, is needed. Although the hollowing out effect on the distribution of income attributed to the development of tourism may exist, it does not occur in all regions and depends on the natural resources used as inputs. In this way, this research demonstrates that if spatial processes were not appropriately controlled, modeling results could lead to incorrect policy inferences. Moreover, some strategies, like increasing creative types of jobs to generate more high-wage employment, may be imperious in some regions, though not necessarily in others (Lee and Lin, 2017).
Concerning control variables, the supply-side determinants traditionally used to explain wage inequality have the expected signs. According to the theory of gender inequality, the participation of men in the labor market has a negative relationship with wage inequality. A negative relationship between some education levels and income inequality is also observed: An increase in education levels may demonstrate an equalizing factor in regional labor income distribution. The effect is statistically significant for completed secondary degree and incomplete university degree (as compared with those who have primary education). The percentage of foreign workers shows a negative effect in income inequality, explained by the fact that, in Argentina, immigrants concentrate on the lower end of the scale of skills and concentrate in particular sectors (construction, services, retail, and agriculture) characterized by low levels of income and wages (Facchini, 2009).
The coefficients of lower (less than 3 months) and higher (5 years) seniority are positive and statistically significant, with the major effect in the first. In addition, there is a higher share of workers with seniority in the extremes, giving rise to higher inequality as compared to those of average seniority. Similarly, the permanent occupation variable has a negative effect on income inequality, and the informality variable has a positive effect. Regarding industrial composition, the model suggests that an increase in the percentage of workers in medium-sized companies (with 41–100 workers) has an equalizing effect on labor incomes, in comparison with small companies. An opposite result is obtained in large companies.
Discussion and conclusive remarks
For some time, the exploitation and development of natural resources for tourism, the preservation and enhancement of historical sites, and the promotion of different cultural activities have become the raw material for local and regional tourism development. In this way, touristic amenities have become a key element in our analysis, where the aim is to investigate the structure of income and wages in geographical units defined as dependent on different types of tourism.
We estimate an econometric model of spatial error for 29 metropolitan agglomerates of Argentina during the period 2004–2015, using the inequality in the labor income between agglomerates and over time as the dependent variable. We examine the influence of the supply-side determinants traditionally used to explain wage inequality (personal, sociodemographic, and labor characteristics), as well as the influence of the indices of touristic amenities that we formulated and those that interacted with the share of tourism employment.
This work contributes to the literature by computing four touristic amenities indices for Argentinian agglomerates and by providing an initial attempt to apply a tourism dependence definition based on amenities. The aim is the analysis of the relationship between tourism development, amenities endowment, and income distribution at the regional level. The topic presents interesting issues to analyze as one part of the literature finds the labor characteristics of the tourism sector to be unfavorable (low-qualified individuals, temporary, informal and relatively low-paid jobs, segregation, and so on), while another suggests that an amenities-based economy attracts more-qualified and better-paid workers. Although this study has certain limitations mainly due to the availability of data, we consider it an important step toward an understanding of the effects of tourism on the economic development of a developing country. It should be noted that much of the tourism activity in a country like Argentina develops outside metropolitan areas, and given this, finding a way to carry out a fundamental analysis of the sector is challenging. This article is the first attempt in this direction.
Results suggest that natural amenities and tourism development provide critical explanatory factors related to the distribution of income. Tourism development presents an unequal effect on labor income, supporting the hollowing out theory of income distribution proposed by empirical evidence. However, the inclusion of touristic amenities variables shows different effects depending on the type of amenity, meaning that the effect on the distribution of income also depends on the local endowment of natural resources. In the case of Argentina, water-based and land-based amenities show a different spatial distribution, and they also give rise to opposite effects on income distribution. Water-based amenities concentrate in Patagonia and Cuyo regions, where income labor is above the national average, and there is a tendency to a more equal distribution, while land-based amenities concentrate in Northwest and Northeast regions, with opposite characteristics.
As Marcouiller et al. (2004) mentioned, many regions have engaged the tourism sector as a key component in economic development planning without a thorough assessment. There exists a preconceived notion that the sector generates positive effects on regional development, based on the analyses of aggregate growth. This study opens this assumption up to debate; it explores several vital components related to the tourism sector and its effect on regional development in a Latin American country, demonstrating the complexity of the topic. What do tourism policymakers have to do in a big, large, and diversify country like Argentina to promote amenity-based development on equalizing tourism strategies? What we learned here gives some insights for that. First, identify amenities and classify them; second, map out their regional and spatial distribution; third, match the mapping with labor and income characteristics and the performance of each geographical unit to determine successful strategies of growth; fourth, reinforce public and private initiatives in spatial contexts where amenity-based tourism is incipient yet.
Taking into account this four-step strategy and according to empirical evidence on amenities endowment at a regional level in Argentina, one interesting initiative to promote a bundle package of tourism could be to tie the Northeast with Patagonia region, on one side, or the Northeast with Cuyo region, on the other side. The idea is to promote a more variety of activities and a longer length of stay in the first one in relation to the others. In this way, the regional development of tourism contributes to disperse the benefits all over the country, looking for an equal distribution of income (Koo et al., 2012).
Regional inclusive growth led by amenity-based tourism must be the idea to have in mind. As Hampton et al. (2018) pointed out, backward and forward linkages in the value chain of tourism are involved, and further innovation and creative jobs are needed in the path of growth. Argentina has a clear regional tourism development strategy to stimulate.
Footnotes
Declaration of conflicting interests
The author(s) declared no potential conflicts of interest with respect to the research, authorship, and/or publication of this article.
Funding
The author(s) received no financial support for the research, authorship, and/or publication of this article.