



Abstract
In this article, we study the effect of ICT on tourism demand in nine major tourist destinations based on visitor arrivals. Mobile and broadband subscriptions are used to proxy for ICT. Additionally, we account for price, source country’s income, and the destination’s income. Balanced panels for the period 1995–2017 and 2002–2017 are used for mobile and broadband subscriptions, respectively. The pooled mean group approach is used for estimation. The results indicate a 1% increase in mobile subscriptions and broadband would increase international visitor arrivals by 0.04% and 0.11%, respectively. The elasticity coefficients of price and income are −0.71 and 1.58, respectively, based on the mobile subscription model, and −0.88 and 1.83, respectively, based on broadband subscription. The destination’s income has only a short-run positive association with tourism demand. The causality results indicate that ICT cause tourism demand, and support for technology-led growth hypothesis in the major tourist destinations.
Introduction
Technology continues to revolutionize tourism industries in many countries, especially in the context of digital tourism. Digital tourism refers to a suite of real world and online contents aimed at improving experiences of tourists (Adeola and Evans, 2019a). For tourists, technology can be an important tool, especially in terms of finding information about the intended destinations, climate and weather patterns, accommodations, sceneries, geopolitical and economic situations, making travel bookings, online shopping and payments, and capturing memories, among other things (Law et al., 2018).
Several studies have shown a close link between ICT and economic growth (Jorgenson, 2001; Jorgenson and Vu, 2011; Kumar, 2014; Kumar and Kumar, 2012; Kumar et al., 2015, 2016; Madden and Savage, 1998; Pohjola, 2002; Stiroh, 2002; Strobel, 2016; Ward and Zheng, 2016). The high-income and highly developed provinces, countries, and regions can benefit from ICT developments, especially in terms of productivity and economic growth (Lam and Shiu, 2010). Because tourism development and economic activity are closely linked (Lanza and Pigliaru, 2000; Narayan et al., 2010; Pablo-Romero and Molina, 2013; Sheldon, 1993), interest in exploring key drivers of tourism demand is growing. Studies have shown that developments in the tourism sector can result in the improvements in infrastructure including technology and public facilities (Andereck et al., 2005; Yoon et al., 2001), the reduction in poverty (Croes, 2014; Vanegas et al., 2015), additional employment (Andereck and Nyaupane, 2011), and the creation of local businesses (Dyer et al., 2007).
In this study, we examine the association between ICT, measured by mobile and broadband usage, and tourism demand in nine major tourist destinations ranked by visitor arrivals. Drawing insights from the gravity model and demand theory, we estimate the tourism demand model that includes leading tourist destinations. Our sample includes China, France, Germany, Italy, Mexico, Russia, Spain, the United Kingdom, and the United States. 1 Interestingly, these countries possess a well-developed ICT infrastructure (Lam and Shiu, 2010) and are experiencing growth in tourism (Shahzad et al., 2017). The pooled mean group (PMG; Pesaran et al., 1999) approach is used to estimate the long-run and short-run models, and the Dumitrescu–Hurlin (2012) heterogeneous panel test is used to examine causation. The model with mobile usage as an indicator of ICT comprises data from 1995 to 2017, and the model with broadband usage as an indicator comprises data from 2002 to 2017, which amounts to 207 and 144 observations, respectively. The rest of the article is set as follows: in the second section, we discuss the literature on ICT and tourism. The third section is on data and methods. The fourth section 4 is on the results, and the fifth section concludes with some policy implications.
Literature review
Tourism demand is often measured by visitor arrivals, tourism receipts or expenditure, nights spent by a tourist in the destination country or distance traveled, Song et al. (2010) categorize these measures into quantity, pecuniary, time consumed, and distance criterion. In any case, visitor arrivals are the most commonly used measure of tourism demand (Crouch, 1994; Li et al., 2005; Lim, 1997). The popularity of the use of visitor arrivals as a measure is because they provide information to tourism service suppliers regarding the scope of new investments in hotel, aircraft, and tourism infrastructure (Sheldon, 1993; Song et al., 2010).
A tourism demand model consists of variables like the tourist’s price and the tourists’ income, among other variables. The income variable is usually measured by the real GDP per capita of the source markets, industrial production index, and the real consumption expenditure (Dogru et al., 2017; Kim and Lee, 2017). However, when the focus is on estimating models that examine overall tourism demand from all destinations’ source markets, then the use of the world real GDP can represent the income variable (Algieri, 2006).
The price variable is commonly measured by the real exchange rate. This measure also minimizes the risk of obtaining biased price elasticities when relative prices and exchange rates are individually incorporated into the model (Seetaram et al., 2016). The real exchange rate allows a prospective tourist to compare the cost of living in the destination against the local currency (Song and Li, 2008). Moreover, it has been noted that leisure travelers are more price elastic than business travelers because the latter can postpone their travel (Crouch, 1994). Depending on the availability of data, studies have considered additional variables to account for transportation costs (Narayan, 2004), substitute prices (Seetaram, 2012), seasonality effects (Ridderstaat et al., 2014), and structural breaks (Smeral, 2017) in a tourism demand model.
Further, the causal models for tourism demand have followed either the demand or gravity theories. Some earlier studies like Anderson and Van Wincoop (2003) suggest that such an approach overcomes the large data requirements of the demand-based model that follows the almost ideal demand system. The gravity model specification includes trade which can act as the tourism price indicator. Durbarry (2008) uses a gravity model to explain the inbound international tourism demand in the United Kingdom. The regression method employed was the fixed and random effects. The results are consistent with the demand theory in that tourism price, measured by the real exchange rate, has a negative association with tourism demand. Moreover, the source country’s income has a positive effect on the United Kingdom’s tourism demand. Interestingly, the study notes that the income of the destination is negatively associated with tourism demand, and that travel distance has a positive association.
Digital tourism refers to the application of ICT to create a substantive user experience for the tourist (Adeola and Evans, 2019a; Benyon et al., 2014). Recent studies have shown that ICT like smartphones and the Internet can have positive impacts on the tourism industry, in terms of, among other things, easing communication channels, providing efficient payment mechanisms, and access to useful information for decision-making (Law et al., 2018; Tan et al., 2017; Wang et al., 2018).
Focusing on the e-commerce industry, Werthner and Ricci (2004) highlight that the tourism sector can be a positive driver. This and some other studies (Buhalis, 1998; Buhalis and Law, 2008; Navío-Marco et al., 2018) have established a plausible link between tourism and technology. The ICT-tourism is characterized by consumer demand, technological innovations, and industry functions. From the consumer demand perspective, ICT enables tourists to access up-to-date information on reservations at a fraction of the cost and provides relevant information regarding destinations, resorts and hotels, and suite of activities (Buhalis and Law, 2008; Li and Buhalis, 2005; Mills and Law, 2004; Niininen et al., 2007; O’Connor, 1999; O’Connor et al., 2001). In this regard, ICT can promote word-of-mouse effect through review and post-travel reports on websites and travel forums (Gelb and Sundaram, 2002). Subsequently, ICT can reduce time lags due to lengthy information search, and the uncertainty that may arise from expensive travels and bad experiences (Fodness and Murray, 1997; Harrison-Walker, 2001; Song et al., 2003; cf. Spencer, 2019). In an earlier study, Buhalis (1998) notes that many service providers use ICT to communicate prices and special offers to prospective tourists. Savings from lower prices, commissions, or reduced airfares means tourists have more to spend at a prospective destination (Clemons et al., 2002; Luo et al., 2004). Additionally, through easy access to information supported by ICT, a well-informed tourist is better able to interact with the locals, find special offers and other deals that meet his or her tastes, and add a personal touch to the trip (Kotiloglu et al., 2017). The use of smartphones has greatly facilitated these aspects among other things like travel apps to help in route mapping, booking tickets and accommodation, and searching for packaged tours (Adeola and Evans, 2019a).
While the theoretical link between ICT and tourism is clear, there are a few studies that have empirically examined the relationship between the two (Adeola and Evans, 2019a, 2019b). Adeola and Evans (2019a) examine the linear and nonlinear effects of mobile phones and Internet in Africa over the period 1996–2017 using the systems generalized method of moments approach. They note a U-shaped response between mobile penetration, Internet usage, and tourism. Their results indicate a unidirectional causality from mobile usage to tourism demand. In another study, Adeola and Evans (2019b) relate ICT infrastructure to tourism development in African countries over the period 1996–2016 using the dynamic gravity model. They find that ICT infrastructure has a positive and statistically significant effect on visitor arrivals. Moreover, the study notes that additional drivers of tourism demand are the bilateral real exchange rate and the real per capita GDP of the origin countries. However, it was noted that distance and visitor arrivals are negatively correlated which supports the view that greater travel distance could be due to higher travel costs.
Methods and data
Cointegration, long run, and short run
The basic model specification is consistent with earlier studies (Durbarry, 2008; Lin et al., 2015) and follows the autoregressive distributed lag (ARDL) framework

where
For estimation, we use the PMG estimator developed by Pesaran et al. (1999). This is a panel ARDL approach and the model is estimated with maximum likelihood with the short-run individual heterogeneous effects (Pesaran and Smith, 1995) and the long-run homogenous effects. The procedure is an intermediate case between the mean group and dynamic fixed panel estimator (cf. Khoshnevis-Yazdi and Dariani, 2019). The procedure can be applied with
The Hausman homogeneity test is an integral part of the PMG analysis. It tests the null hypothesis of that pooling of the long-run coefficients is appropriate against the alternative that long-run effects poolability is invalid (Asafu-Adjaye et al., 2016). The null hypothesis requires that the difference between the mean group and PMG is not systematic (Asafu-Adjaye et al., 2016). Additional tests carried out are the unit roots test which assumes common AR effects (Levin et al., 2002) and individual AR effects (Im et al., 2003), and the tests for robustness in the presence of cross-sectional dependence (Pesaran, 2007). Additionally, we test for cross-sectional dependence using the Breusch and Pagan Lagrange multiplier (LM), Pesaran’s scaled LM, and Pesaran’s bias-corrected scaled LM tests. Cointegration test follows the Pedroni’s (2004) and Kao’s (1999) tests. The two cointegration tests assume the null hypothesis of no cointegration.
Causality
We apply two tests to assess the direction of causality. To test for bivariate causality, we use the Granger causality test developed by Dumitrescu and Hurlin (2012) with insights from some recent tourism demand studies (Dogru and Bulut, 2018; Tugcu, 2014). The approach is a non-causality test for heterogeneous panels with fixed coefficients in a bivariate vector autoregression (VAR) model (Tugcu, 2014). Under the null hypothesis, there is no causality for any cross-sectional units of the panel, termed as the homogenous non-causality (HNC) hypothesis. Under the alternative hypothesis, at least one cross-sectional subgroup has a causal relationship from the explanatory to the independent variable (Tugcu, 2014). The Wald statistic is averaged for each cross-sectional unit to develop the panel version of the test static to test the HNC hypothesis (Dumitrescu and Hurlin, 2012). The approach has good statistical properties even in the presence of cross-sectional dependence and can be applied irrespective of the structure of the panel (Alam and Paramati, 2016; Dogru and Bulut, 2018; Tugcu, 2014).
Additionally, to test for multivariate causality, we apply the Granger causality test of Toda and Yamamoto (1995). The approach enables causality to be determined with a mixture of
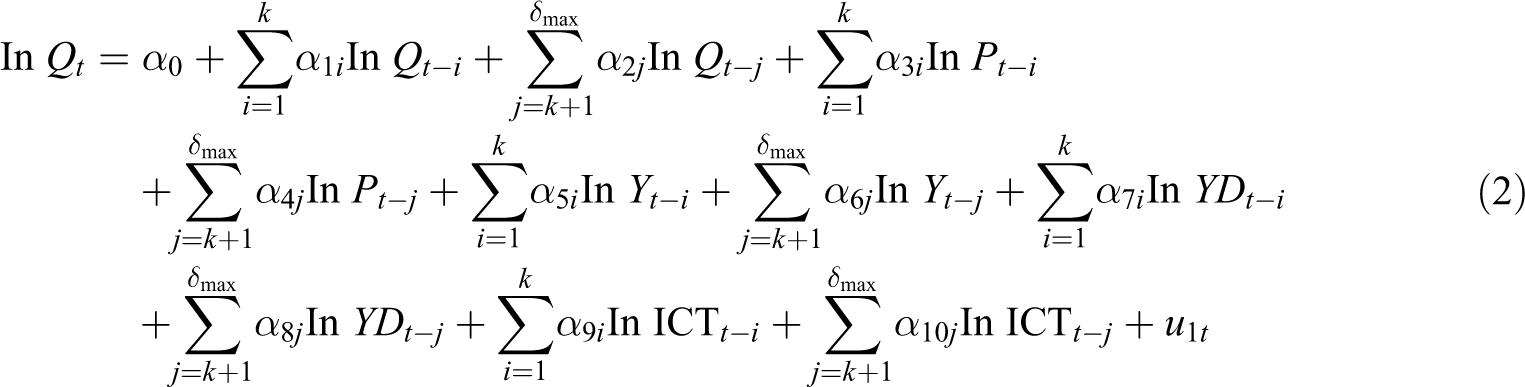
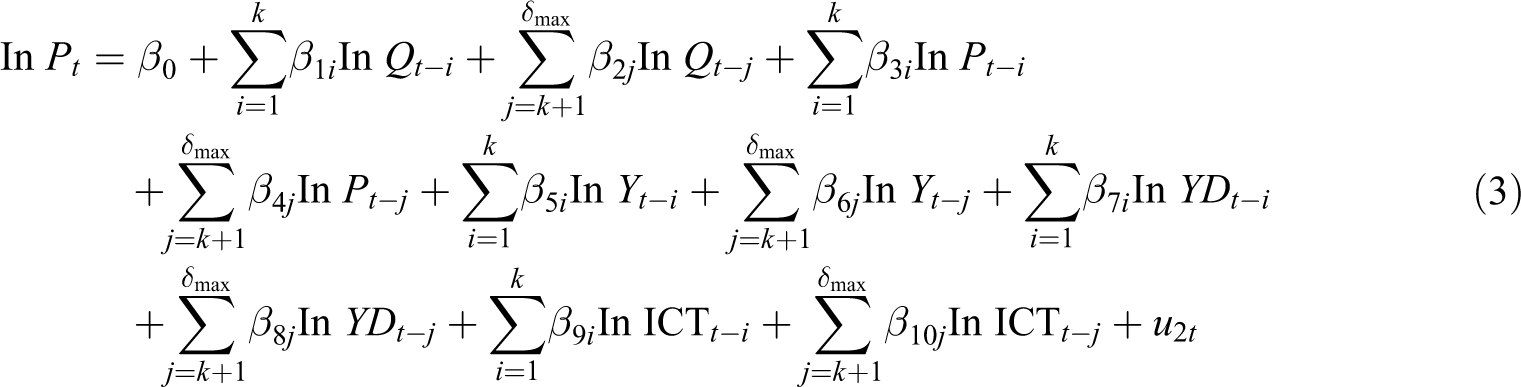
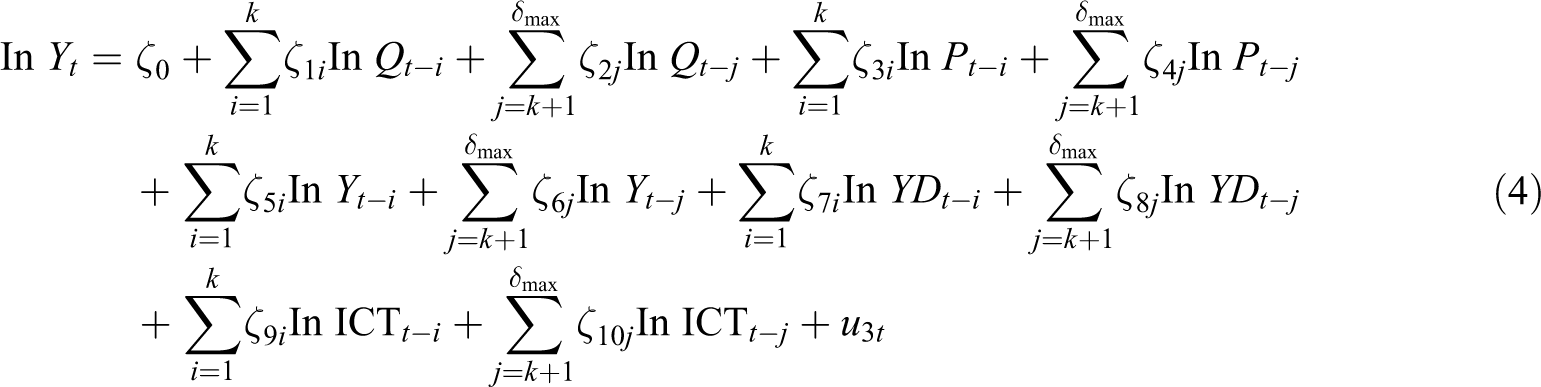
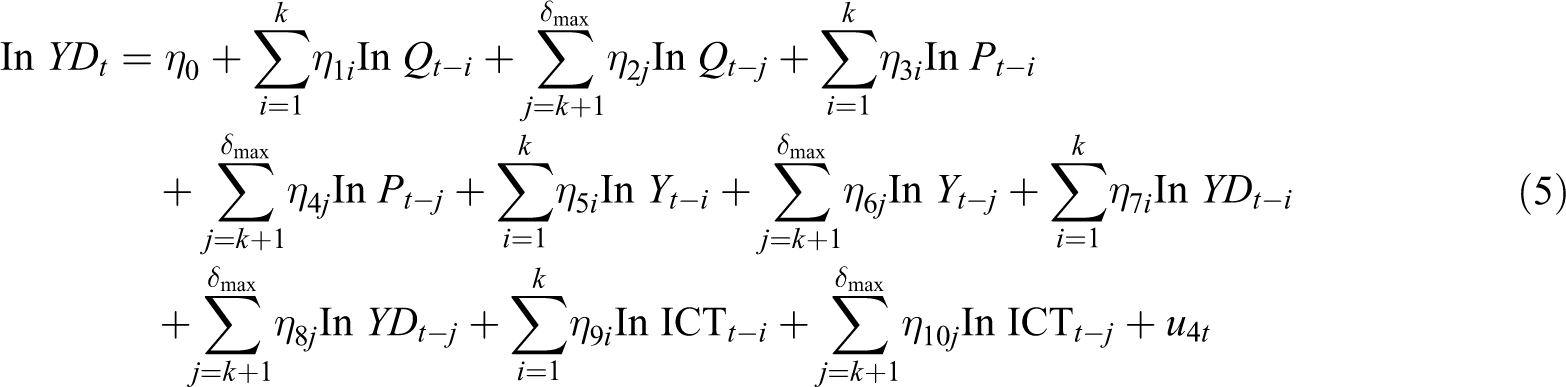
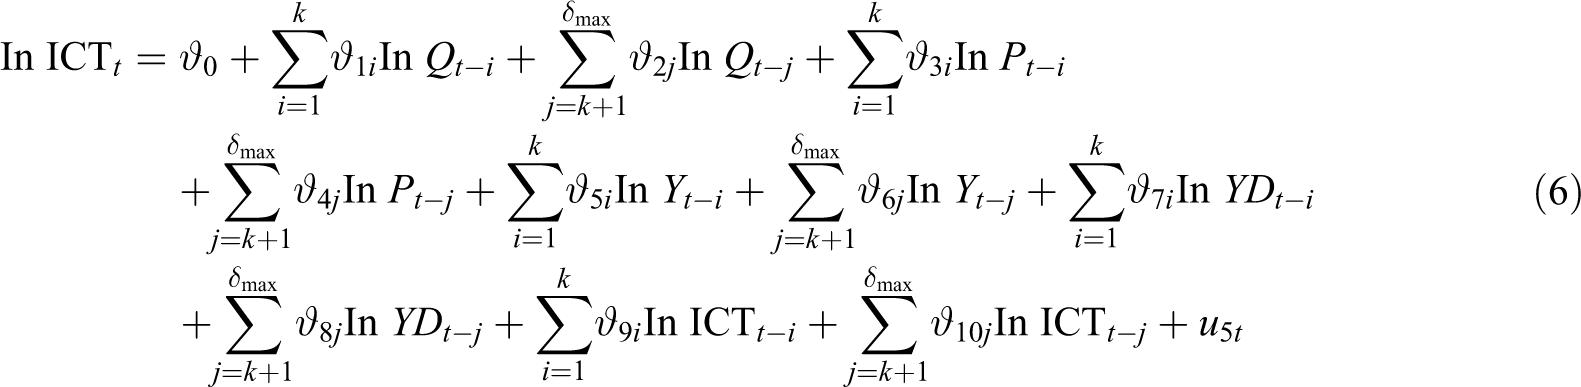
The null hypothesis of the absence of causality is rejected if the probability value (p value) is less than 10%. Hence, in equation (2), Granger causality from
Data
The data for visitor arrivals, real effective exchange rate, destination per capita GDP, mobile subscriptions, and fixed broadband subscriptions are gathered from the World Development Indicators and Global Development Finance database (World Bank, 2019). The data for visitor arrivals are from 1995 to 2017. The per capita real GDP data are from 1960 to 2017 for China, France, Italy, Mexico, Spain, the United Kingdom, and the United States. For Germany, data on per capita real GDP are from 1970 to 2017, and for Russia, they are from 1989 to 2017. The data for mobile subscriptions are from 1987 to 2017 for China, from 1986 to 2017 for France, from 1985 to 2017 for Germany, Italy, and the United Kingdom, from 1988 to 2017 for Mexico, from 1991 to 2017 for Russia, from 1986 to 2017 for Spain, and from 1984 to 2017 for the United States. Data for the real effective exchange rate are from 1980 to 2017 for China, France, Italy, Mexico, Spain, and the United States, and for Germany and the United Kingdom, they are from 1979 to 2017. The data for world per capita GDP are used as a proxy for source market income effects (Algieri, 2006). These data are extracted from the Federal Reserve Economic Database (FRED, 2019) and covers the period 1960–2017. A balanced panel is created with 23 years of annual data for the nine countries, thus a total of 207 observations with mobile subscriptions as a proxy for ICT. However, due to lack of data on broadband subscription as a proxy for ICT, we have 16 years of data for nine countries, thus a total of 144 observations. All variables are transformed into logarithms to interpret the coefficients as elasticities and minimize standard errors.
Results
Descriptive statistics and correlation matrix
In Table 1, we present the descriptive statistics and correlation matrix. A positive correlation is noted between mobile subscriptions and visitor arrivals, and broadband subscriptions and visitor arrivals.
Descriptive statistics and correlation matrix.
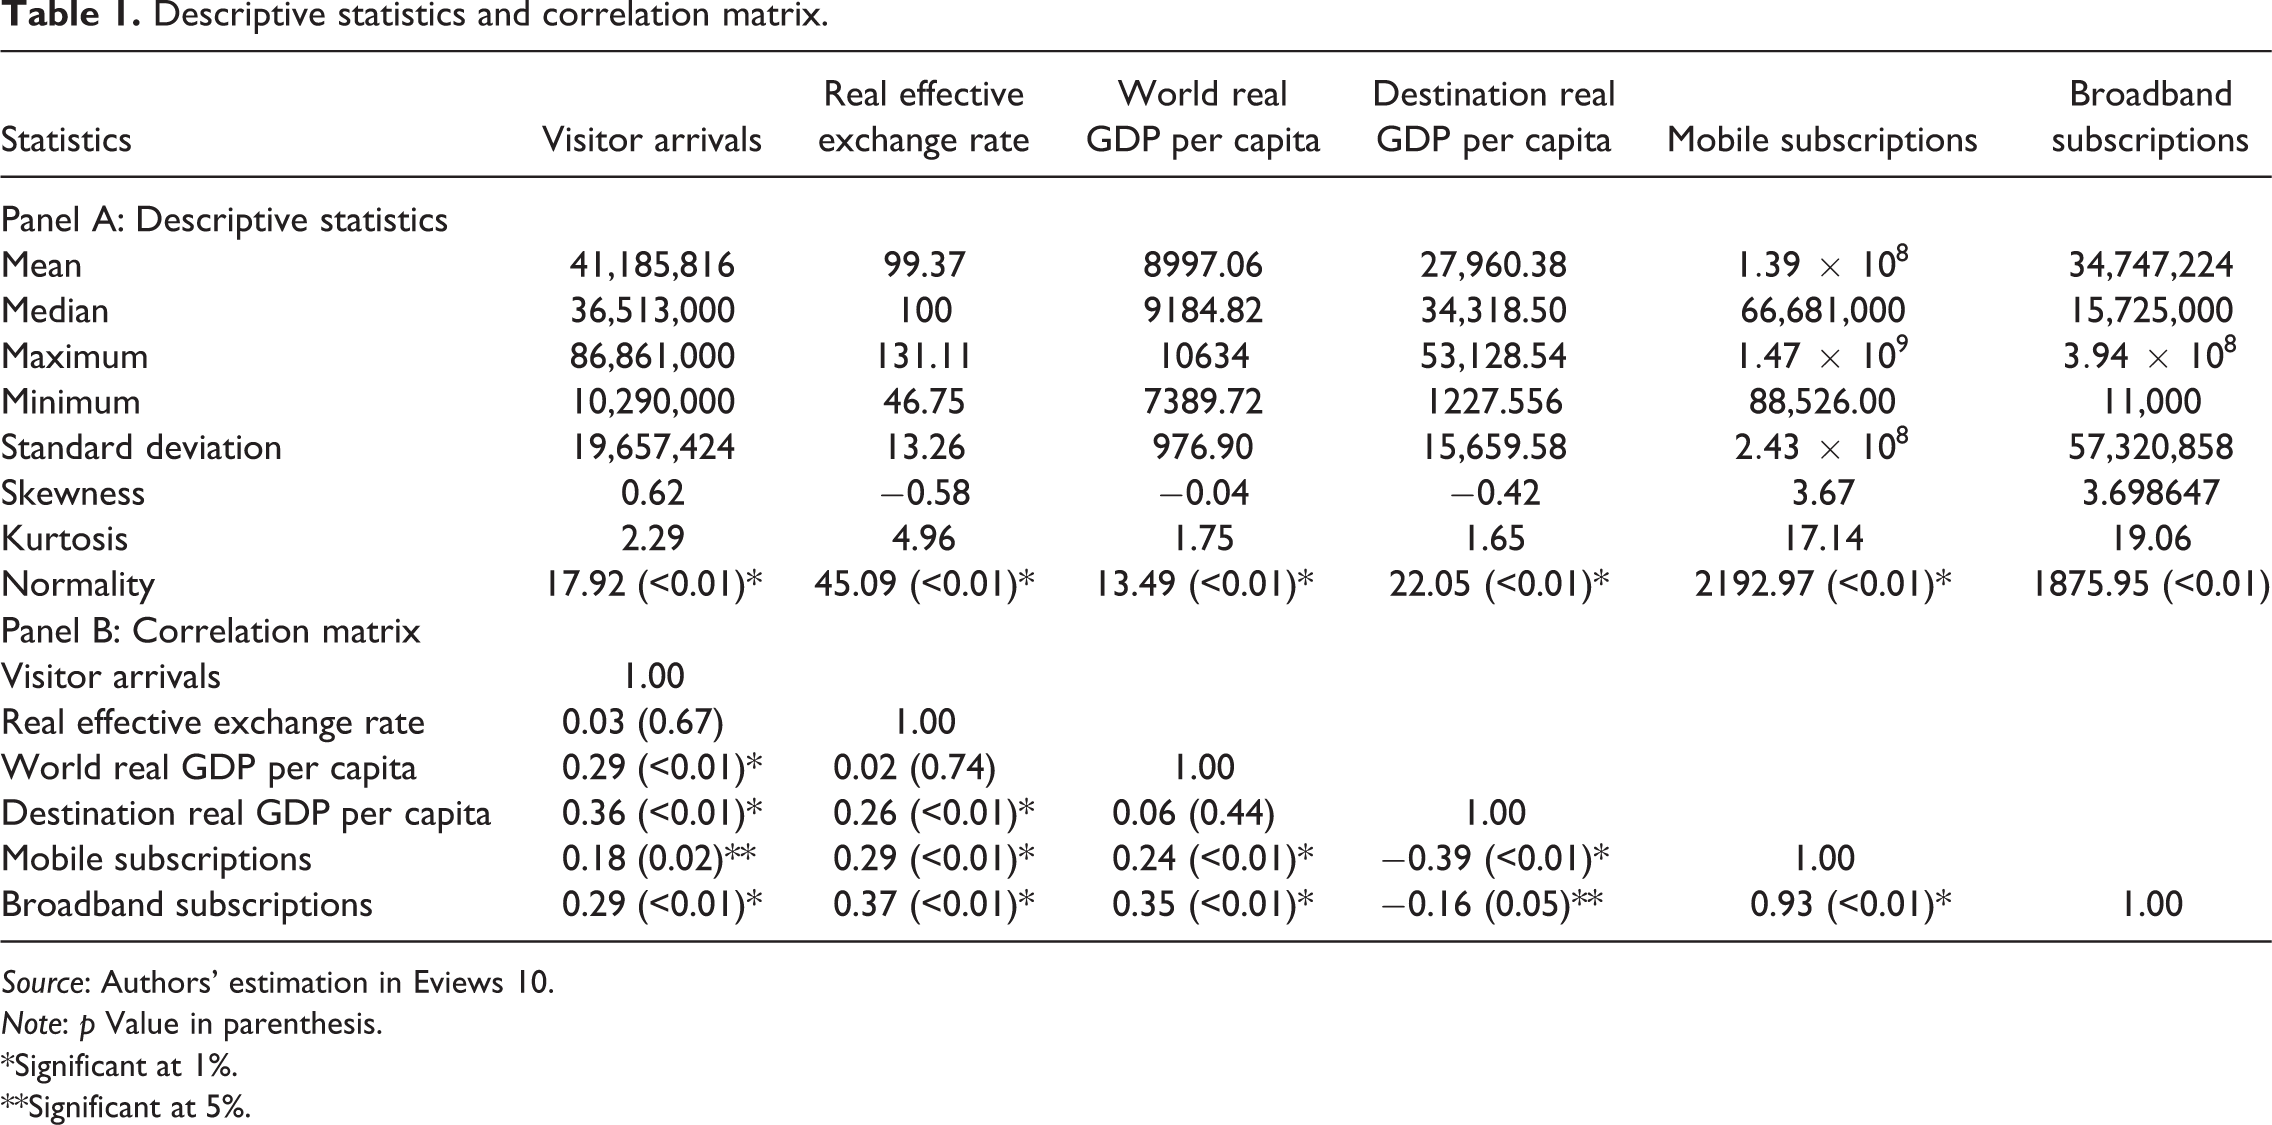
Source: Authors’ estimation in Eviews 10.
Note: p Value in parenthesis.
*Significant at 1%.
**Significant at 5%.
Cross-sectional dependence and unit root
Results in Table 2 indicate the presence of cross-sectional dependence. Subsequently, we examine the presence of unit roots, and the results are reported in Table 3. We note from the unit root test results that the maximum order of integration is one, and a mix of order of integration exists between series.
Cross-sectional dependence test.
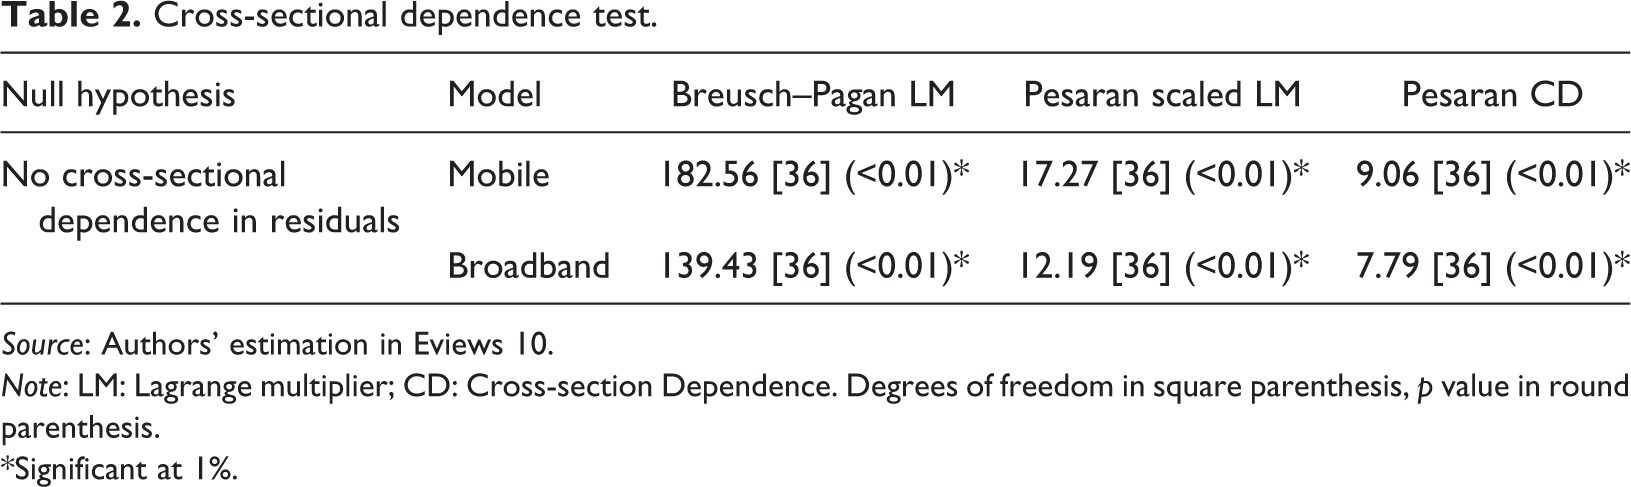
Source: Authors’ estimation in Eviews 10.
Note: LM: Lagrange multiplier; CD: Cross-section Dependence. Degrees of freedom in square parenthesis, p value in round parenthesis.
*Significant at 1%.
Unit root test.
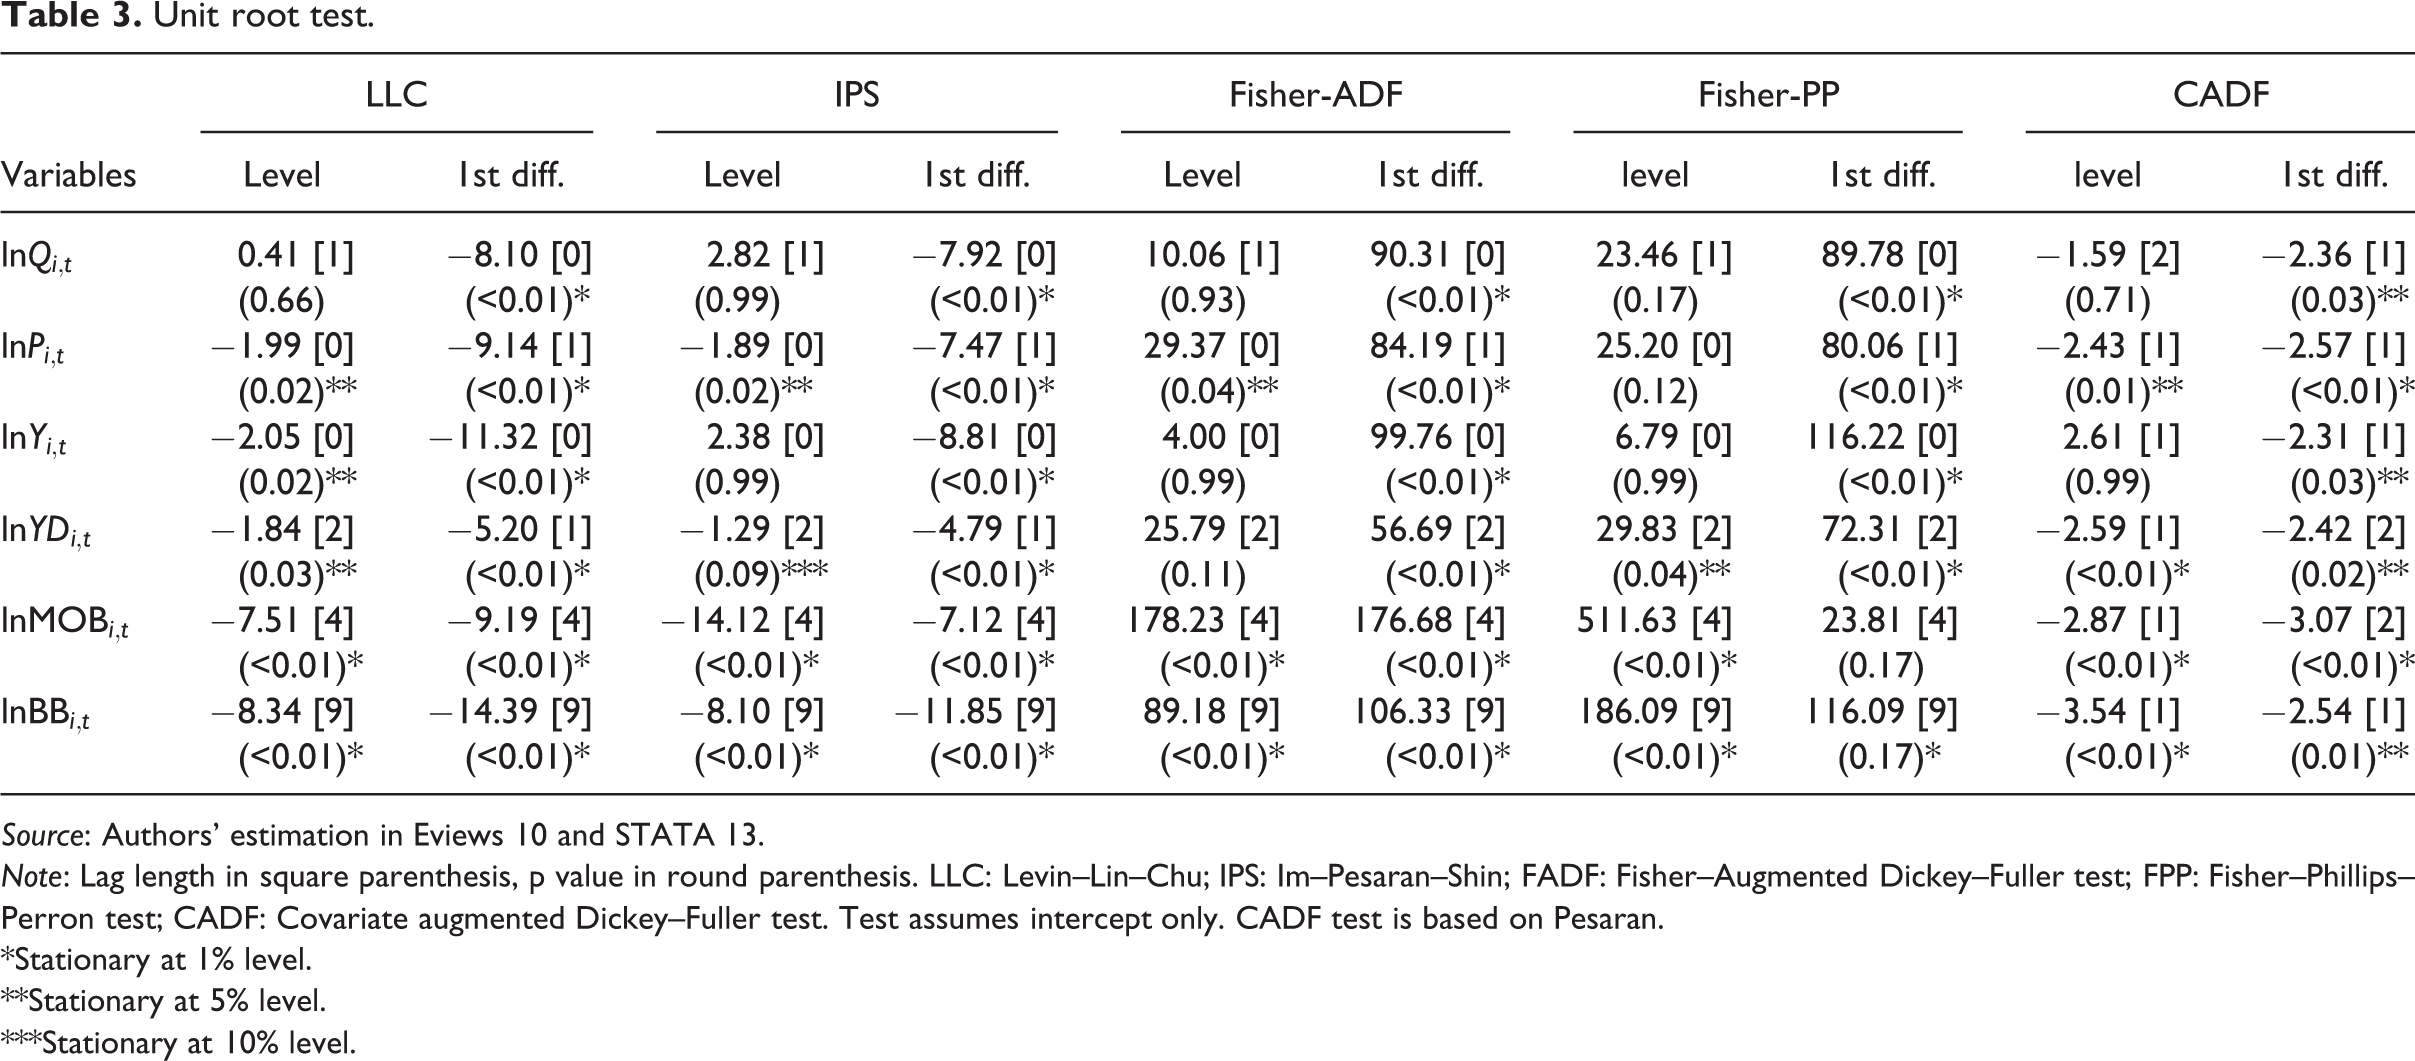
Source: Authors’ estimation in Eviews 10 and STATA 13.
Note: Lag length in square parenthesis, p value in round parenthesis. LLC: Levin–Lin–Chu; IPS: Im–Pesaran–Shin; FADF: Fisher–Augmented Dickey–Fuller test; FPP: Fisher–Phillips–Perron test; CADF: Covariate augmented Dickey–Fuller test. Test assumes intercept only. CADF test is based on Pesaran.
*Stationary at 1% level.
**Stationary at 5% level.
***Stationary at 10% level.
Cointegration and poolability
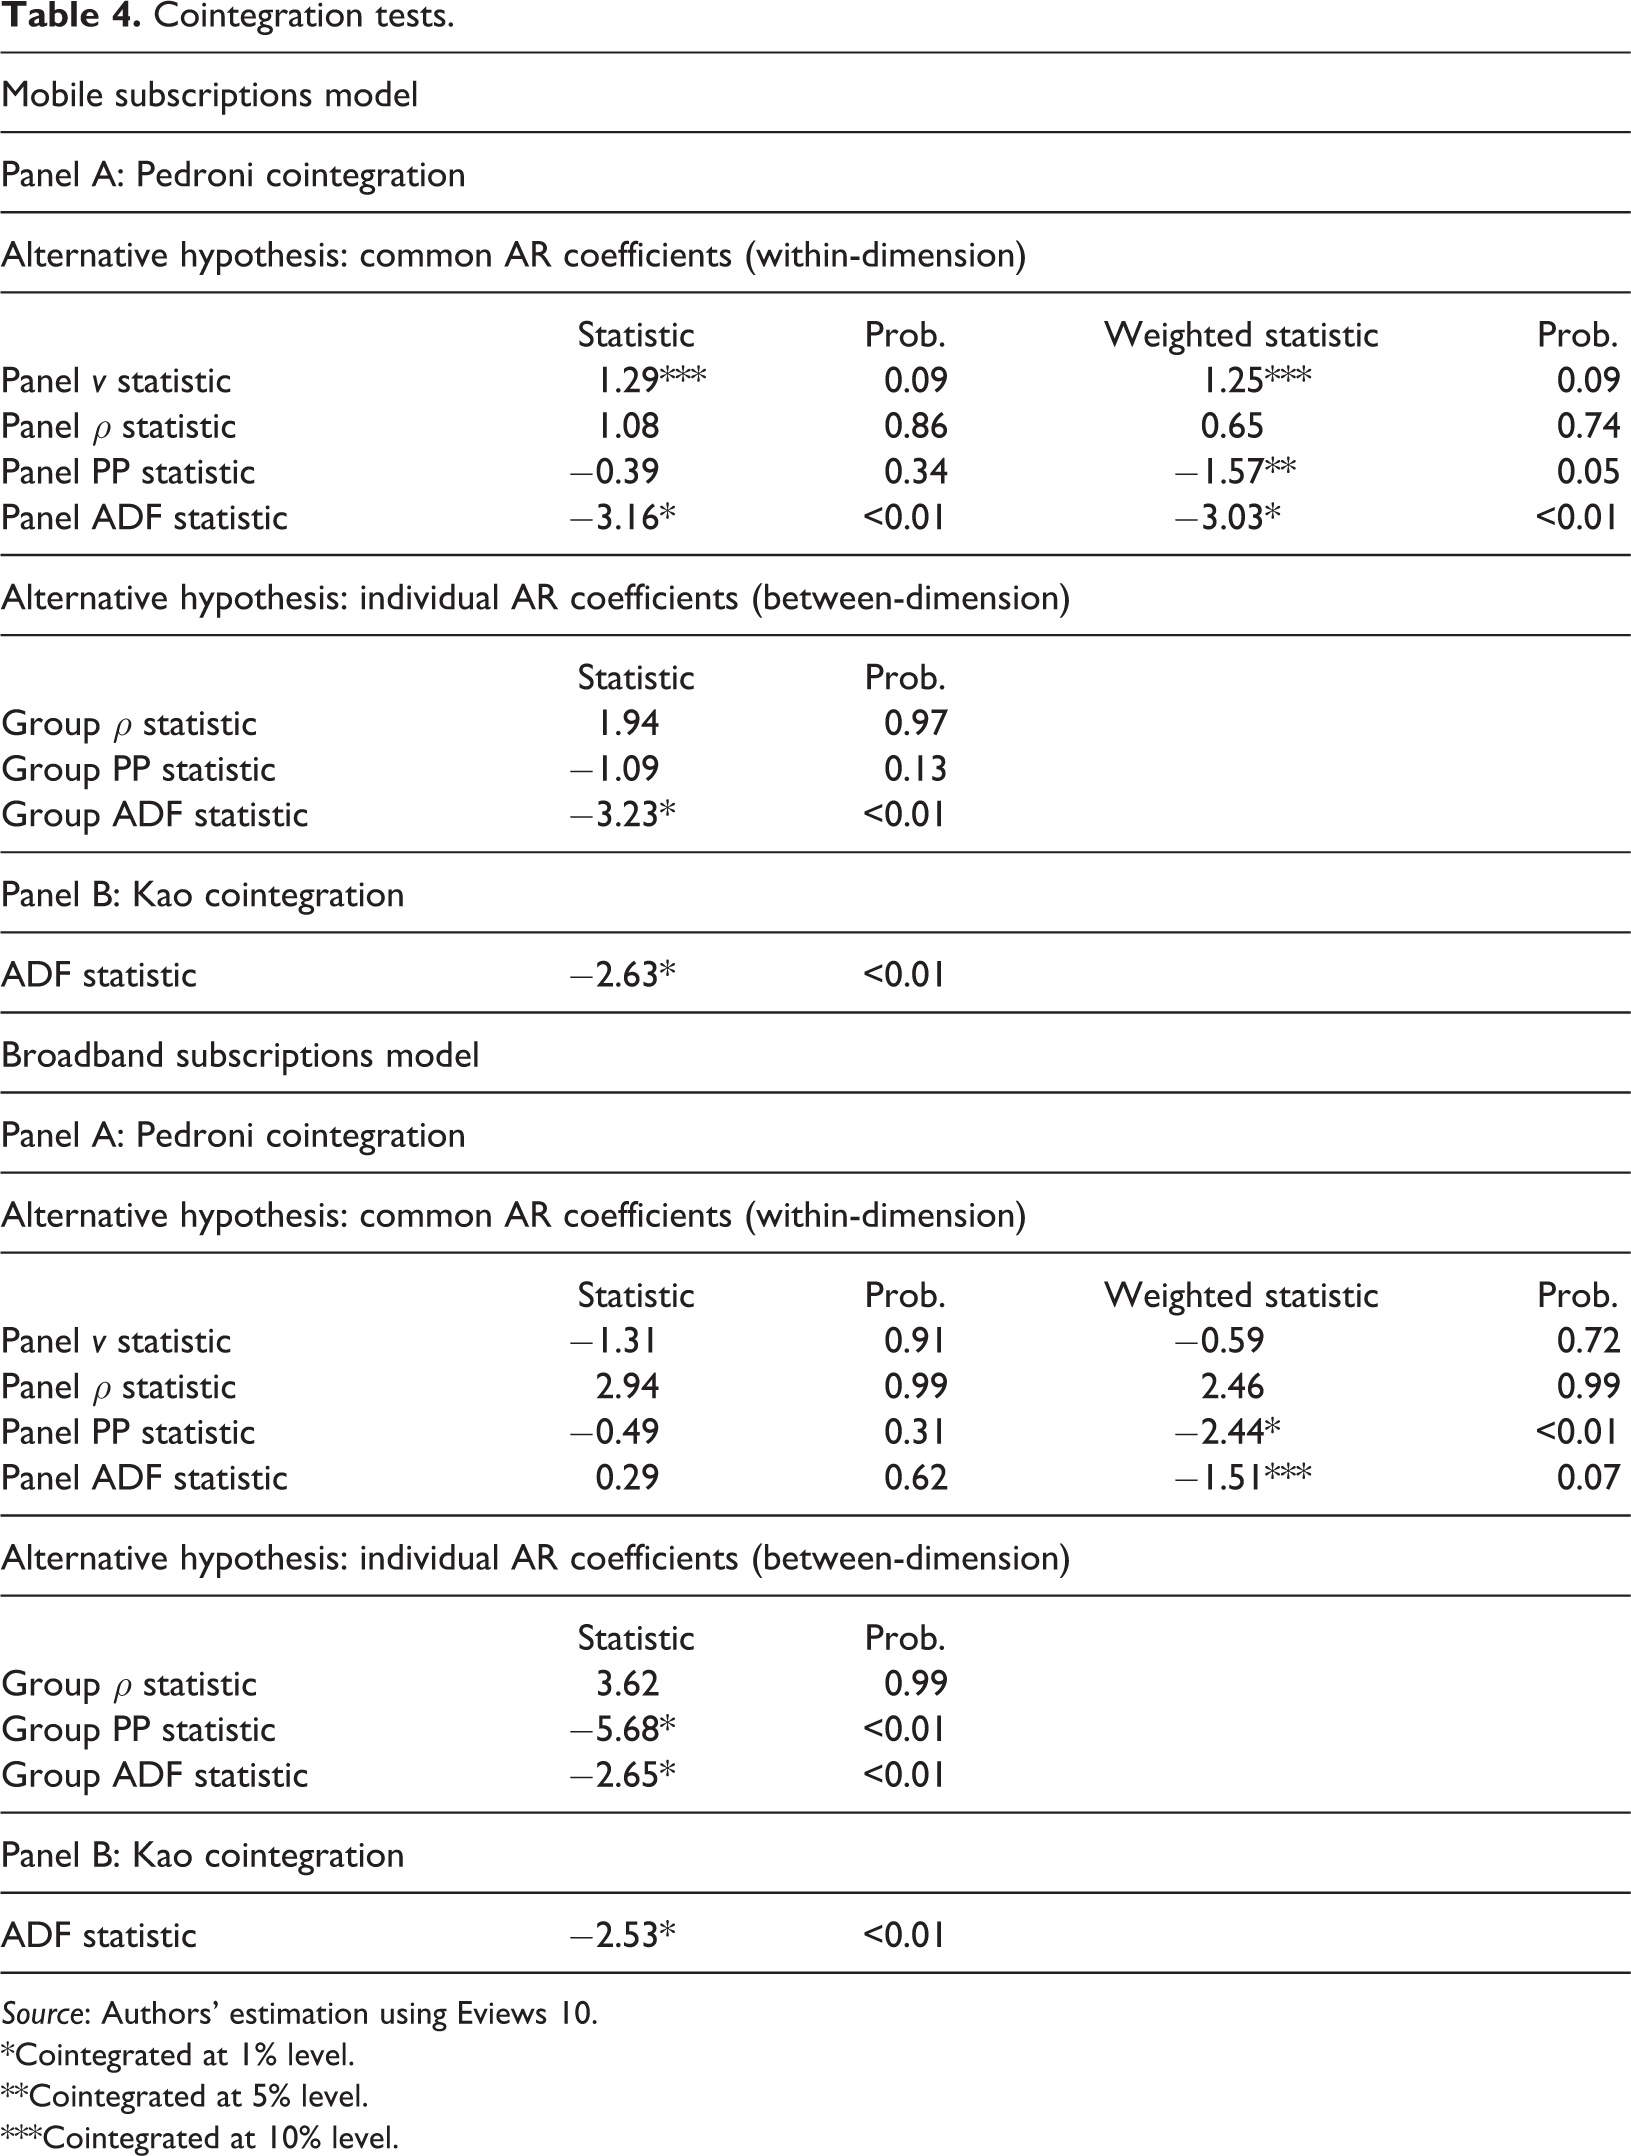
Based on the Hausman test results, we note that the series are cointegrated. This is confirmed via the Pedroni and Kao cointegration tests (Table 4). Additionally, the null hypothesis of long-run homogeneity cannot be rejected, and thus, the PMG method is appropriate for further estimation (Table 5).
Cointegration tests.
Source: Authors’ estimation using Eviews 10.
*Cointegrated at 1% level.
**Cointegrated at 5% level.
***Cointegrated at 10% level.
Hausman poolability test.

Source: Authors’ estimation using Stata 13.
Long run and short run
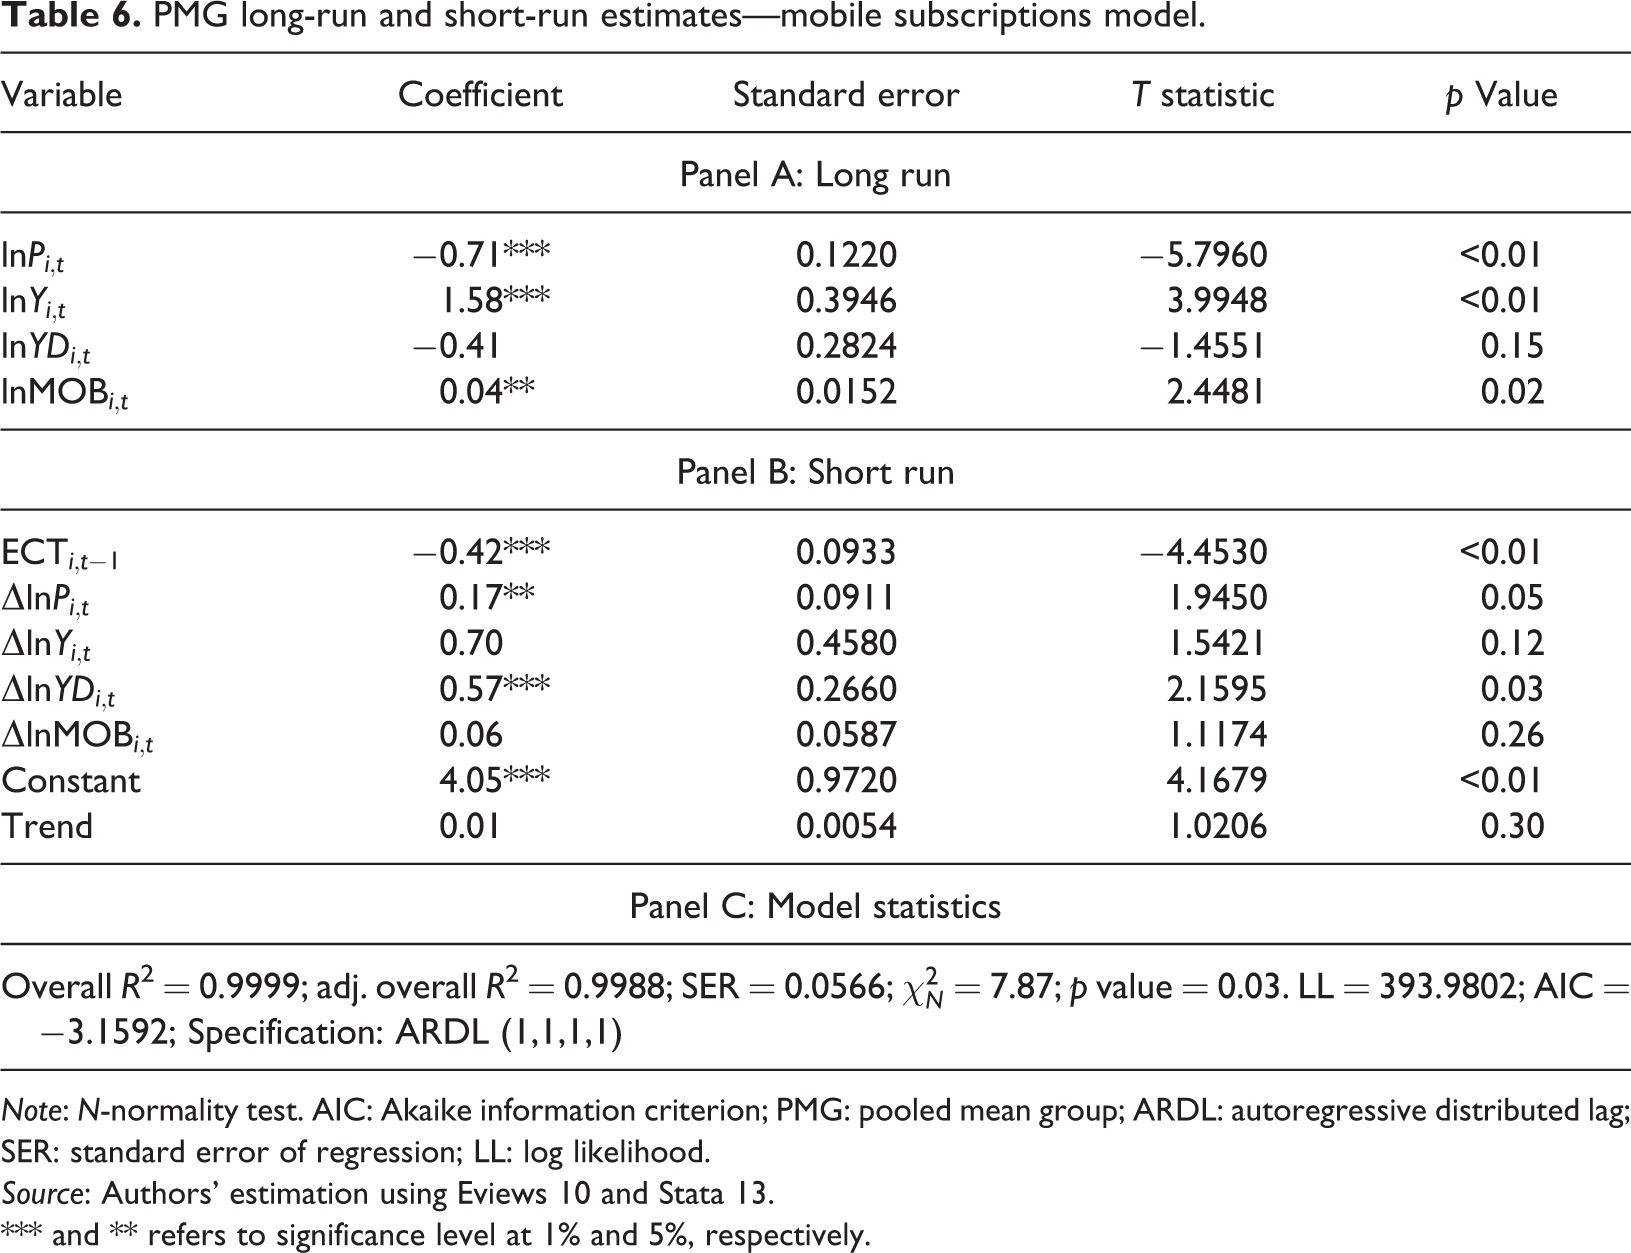
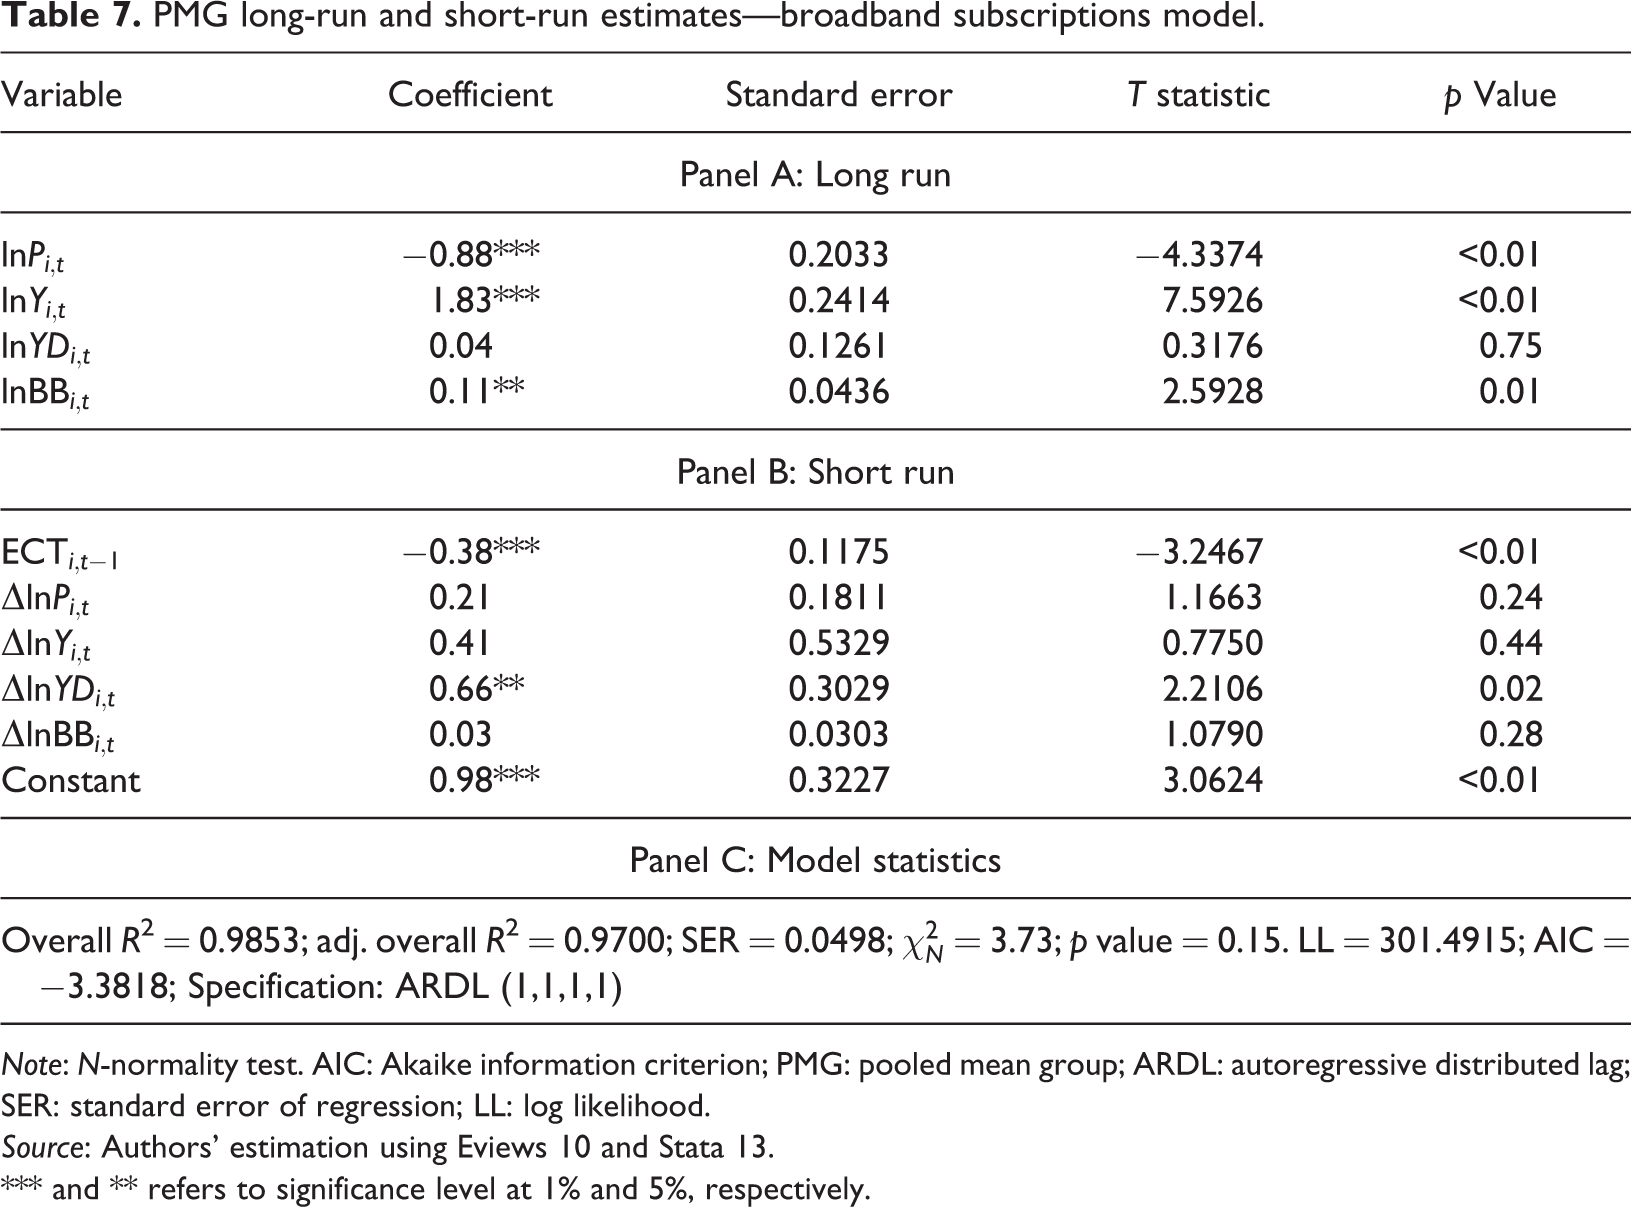
The results with mobile and broadband subscriptions are reported in Tables 6 and 7, respectively. In both cases, the optimal specification is based on the Akaike information criterion and the lag length of 1 is applied.
PMG long-run and short-run estimates—mobile subscriptions model.
Note: N-normality test. AIC: Akaike information criterion; PMG: pooled mean group; ARDL: autoregressive distributed lag; SER: standard error of regression; LL: log likelihood.
Source: Authors’ estimation using Eviews 10 and Stata 13.
*** and ** refers to significance level at 1% and 5%, respectively.
PMG long-run and short-run estimates—broadband subscriptions model.
Note: N-normality test. AIC: Akaike information criterion; PMG: pooled mean group; ARDL: autoregressive distributed lag; SER: standard error of regression; LL: log likelihood.
Source: Authors’ estimation using Eviews 10 and Stata 13.
*** and ** refers to significance level at 1% and 5%, respectively.
In the mobile subscriptions model, the elasticity of mobile subscriptions with respect to visitor arrivals is 0.04. This implies that a 1% increase in mobile subscriptions would increase international arrivals by 0.04%, ceteris paribus. The price coefficient is −0.71, which indicates an inelastic price. The income elasticity is 1.58 which means that the countries are luxury destinations (Crouch, 1994). The ECT indicates that about 42% of disequilibrium errors are corrected each year and that equilibrium is achieved in about 2.4 (1/0.42) years. Notably, the destination’s income coefficient (0.57) is statistically significant in the short run only (Table 6).
In Table 7, broadband subscriptions is used as a proxy for ICT. We note its elasticity with respect to visitor arrivals is 0.11. Thus, a 1% increase in mobile subscriptions would increase international arrivals by 0.11%, ceteris paribus. The price elasticity is estimated at −0.88, which is also price inelastic, and the income elasticity is estimated at 1.83. Based on the coefficient of the ECT, about 38% of disequilibrium is corrected each year. Further, the destinations’ income has a short-run effect only. Interestingly, the outcomes are consistent with the results obtained in Table 6, where mobile subscriptions is used as a proxy for ICT.
Causality
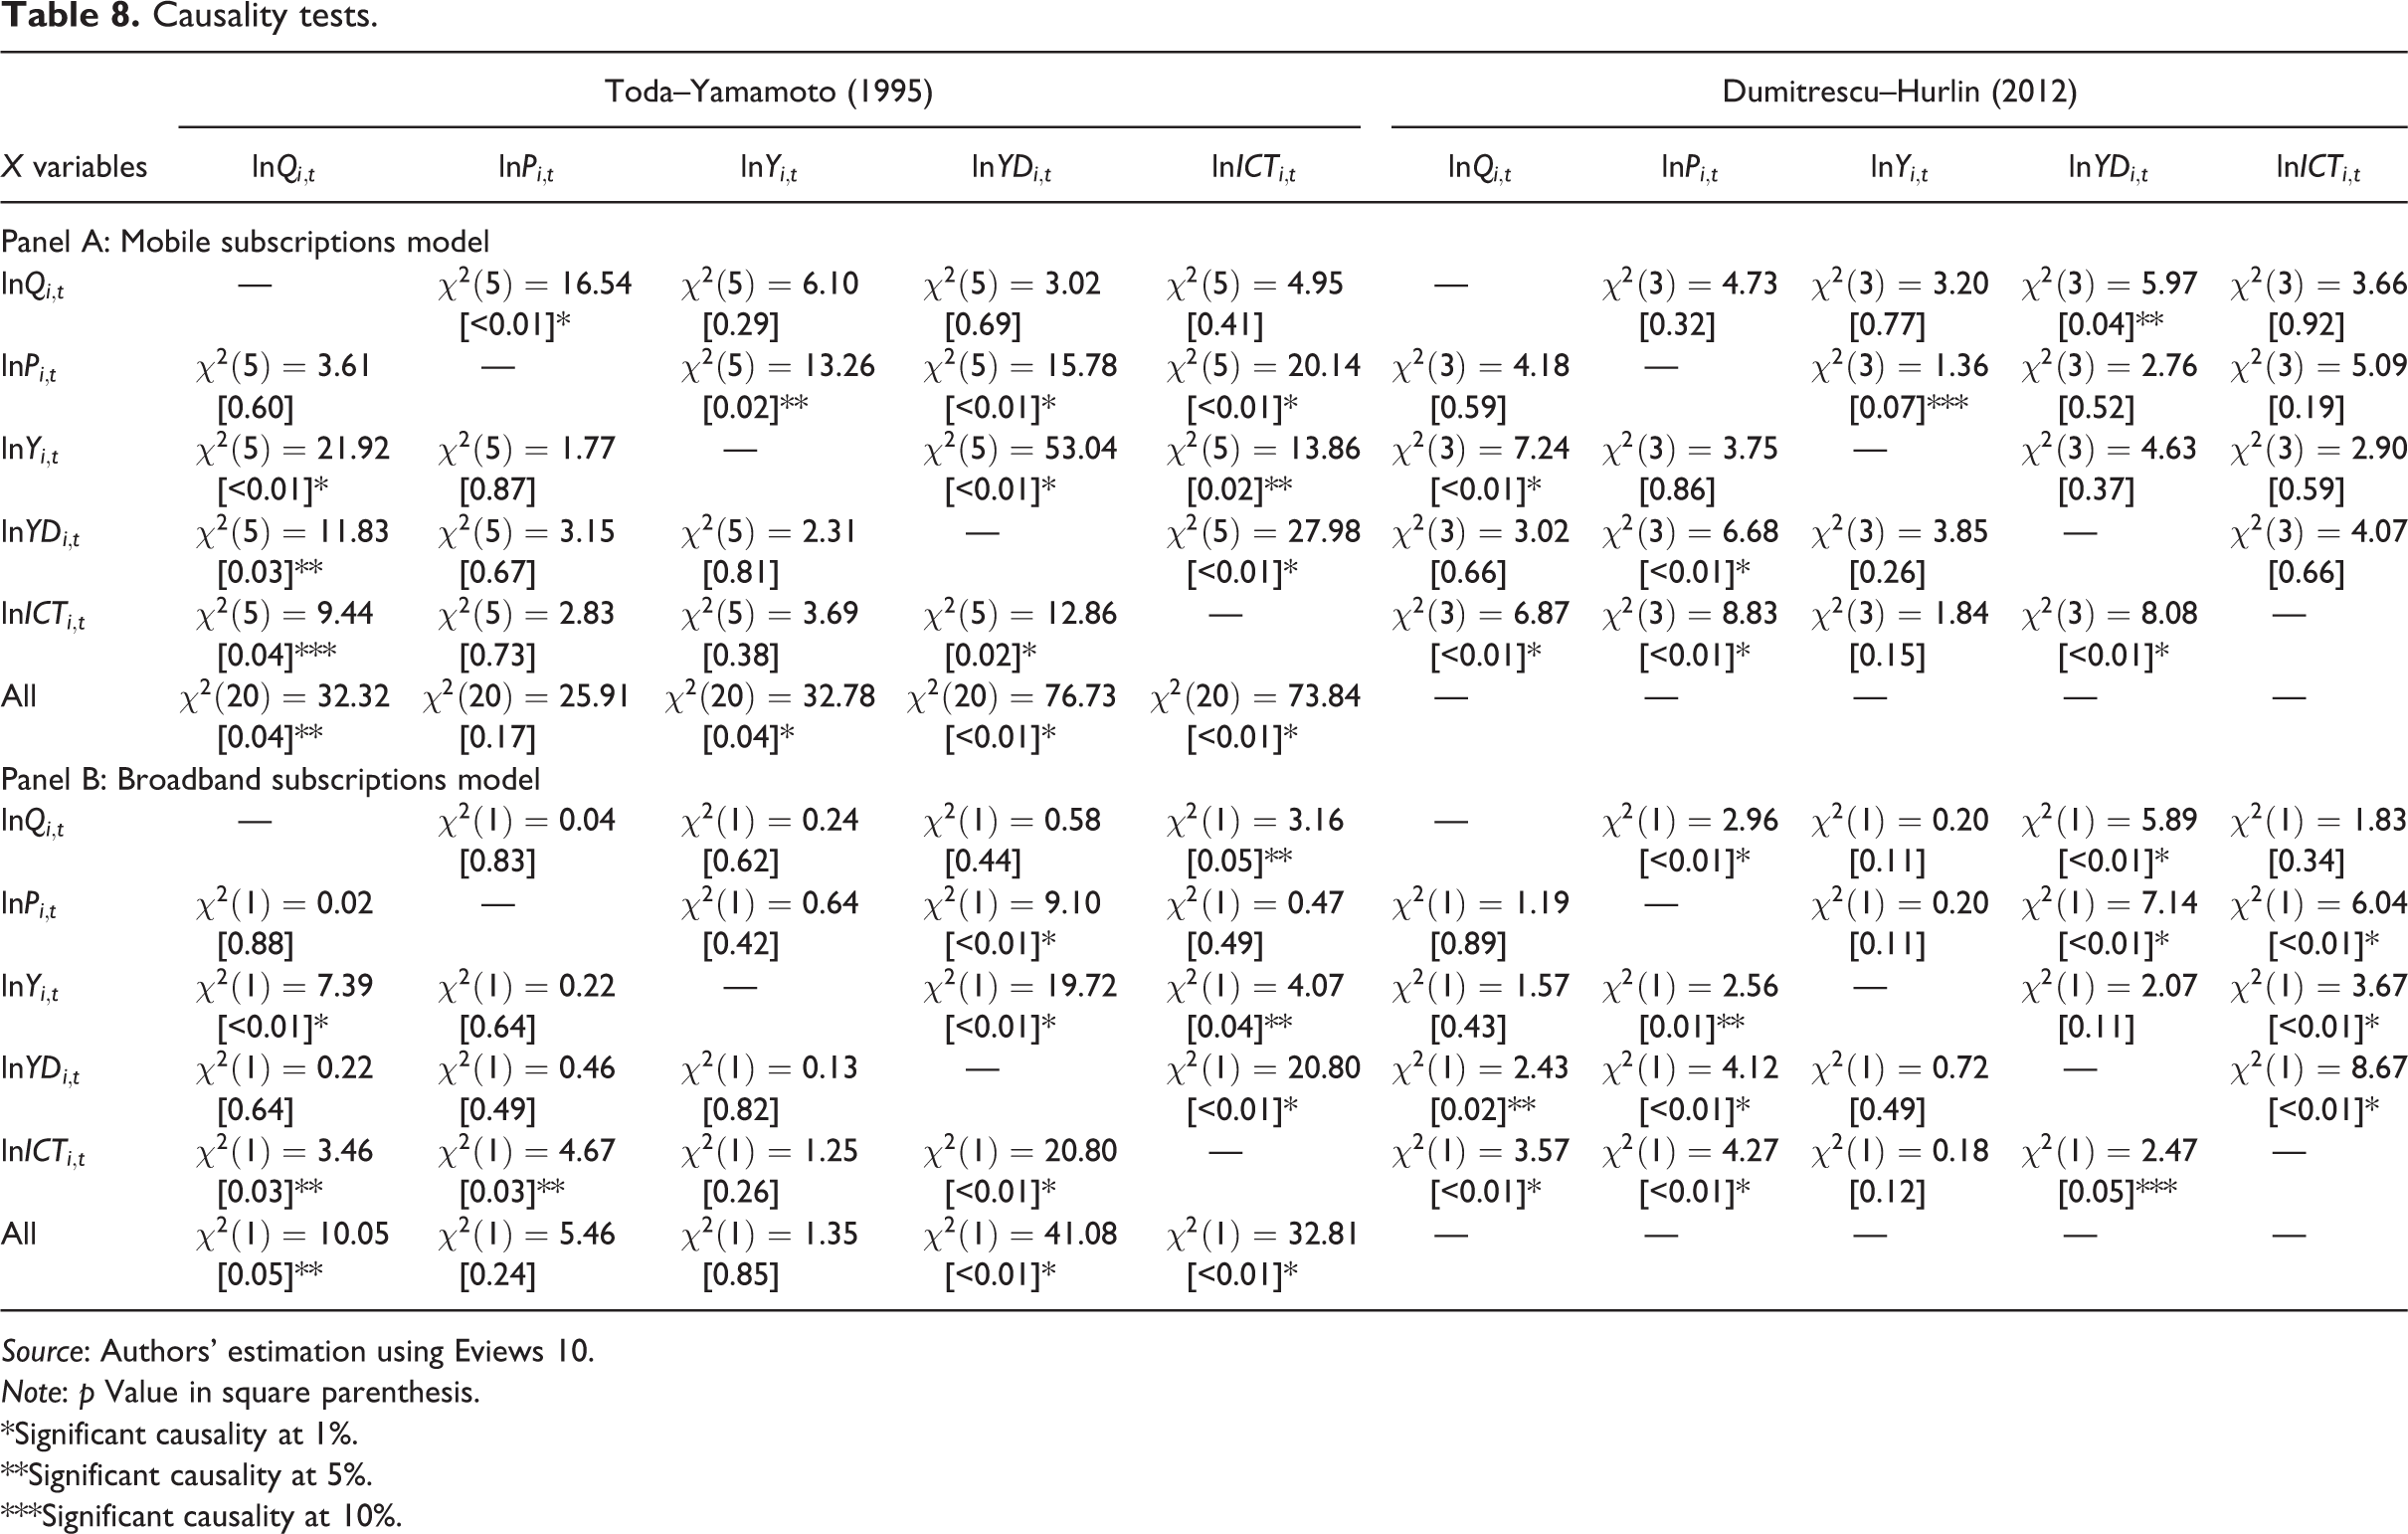
Causality based on the Dumitrescu and Hurlin (2012) and Toda and Yamamoto (1995) are reported in Table 8. In both cases, mobile and broadband subscriptions as proxies for ICT indicate a unidirectional causality, which means that ICT cause visitor arrivals and hence tourism demand. Additionally, it is noted that ICT cause destination’s real GDP, which duly supports technology-led growth hypothesis.
Causality tests.
Source: Authors’ estimation using Eviews 10.
Note: p Value in square parenthesis.
*Significant causality at 1%.
**Significant causality at 5%.
***Significant causality at 10%.
Discussion and conclusions
The study set out to examine the effect of ICT on tourism demand in nine major tourist destinations, based on the largest number of visitor arrivals. It was noted that cointegration exists between ICT and tourism demand. Mobile and broadband subscriptions were used to proxy for ICT. Additionally, price, income, and destination’s income were included in the estimation. Our sample consisted of a balanced panel with 207 observations in the case of mobile subscription and 144 observations in the case of broadband subscription. Cross-sectional dependence, unit root, and cointegration tests were carried out, accordingly.
We note consistent results in both cases. The short- and the long-run results with respect to visitor arrivals indicate that ICT is positively associated, price is negatively associated, and source country income is positively associated—the latter implies that the major tourist destinations are of luxury type. Moreover, it is noted that the destination country’s growth has only a short-run positive effect on tourism demand. Further, we note a unidirectional causality from ICT to tourism demand and destination country’s income.
The study has some clear contributions. First, the study reinforces the role of technology as a driver of tourism demand and confirms that the major countries are luxury destinations. Second, the study examines major tourism destinations from the perspective of tourism-ICT literature, which was previously absent. Third, consistent results based on the two measures of ICT indicate that both mobile and broadband subscriptions are correlated, and thus can be used as reliable indicators of ICT. Additionally, the study reinforces the ICT-led growth hypothesis in the major tourist destinations. Our analysis underscores that ICT development as a subset of the broader definition of infrastructure improves visitor arrivals to the major destinations, holding all other things constant.
Future research can consider the links between the various digital platforms and visitor arrivals. The role of ICT in the context of platforms like social media can be analyzed in relation to tourism demand. Moreover, given that ICT is a broad term, additional indicators to proxy ICT development can be identified and examined in relation to tourism demand. Of course, with a larger data set, it is plausible to explore nonlinearity and asymmetries in tourism demand, namely, ICT, and subsequently examine the threshold levels of ICT.
Our results clearly indicate a strong link between ICT and tourism demand in major tourist destinations (China, France, Germany, Italy, Mexico, Russia, Spain, the United Kingdom, and the United States). Therefore, by enhancing the quality and coverage of technology infrastructure, these destinations can effectively promote their tourism sector at a greater scale. Using ICT tools to scale up digital tourism will be an effective strategy to improve tourism demand in the future. Additionally, for future consideration, we propose the possibility of implementing artificial intelligence and virtual tourism experience in tourism industry, especially in countries where technology and connectivity are par excellence.
Footnotes
Acknowledgements
The authors sincerely thank the editors, Professors Rodolfo Baggio and Davide Provenzano, and the anonymous reviewers for their comments and suggestions. The usual disclaimer applies.
Declaration of conflicting interests
The authors declared no potential conflicts of interest with respect to the research, authorship, and/or publication of this article.
Funding
The authors received no financial support for the research, authorship, and/or publication of this article.
