
Abstract
The authors investigate the effect of location on the nightly hotel room rates charged in Las Vegas. Using a hedonic estimation approach, the authors control for room amenities and hotel and time characteristics. Including 6087 hotel room nights for hotels located near the Las Vegas Strip in two different years (2012 and 2017), the authors estimate the relationship between hotel location and nightly room rates. Consistent with prior investigations, the authors find strong evidence for the effect of location, amenities, and day of week on hotel prices, with a “Strip premium” of 40.21% (US$106.85 at the mean hotel price) for hotels located within 0.25 miles of the Las Vegas Strip compared to hotels beyond 0.75 miles of the Strip. They estimate a Center-of-Strip premium of 70.23% (US$186.61 at the mean hotel price) for hotels located within 0.75 miles, 36.89% (US$98.01) for the next 0.75 miles, and 18.89% (US$50.18) for the next 0.75 miles, compared to hotels beyond 2.25 miles.
For an existing location, hoteliers can focus on the advantages that their businesses have with regard to accessible distances to an attraction or the city center, as well as the inherent advantages of their neighborhood characteristics….(Zhang et al., 2011a, p. 979)
Introduction
Research on hotel room rates has demonstrated that proximity to popular locations or attractions such as the Central Business District (CBD) (Bull, 1994; Hung et al., 2010; Lee and Jang, 2012; Shoval, 2006; Thrane, 2007; Valentin and O’Neill, 2019; Zhang et al., 2011a), beaches (Espinet et al., 2003; Rigall-I-Torrent and Fluvià, 2011), shopping and entertainment districts (Andersson, 2010), urban (compared to rural) centers (Monty and Skidmore, 2003; Sánchez-Pérez et al., 2019), and airports (Lee and Jang, 2011) matters. With some notable exceptions (e.g. see Chen and Rothschild, 2010) the essential finding for all of these is that hotel prices generally decline as one moves away from the local attraction or “spatial amenity.” With the largest hotel room inventory in the world, including 7 of the top 10 largest hotels, and attracting over 42 million visitors in 2017, Las Vegas, Nevada, plays a prominent role in the US hotel industry (LVCA, 2017). The city is also famous for gaming, boasting nearly US$10 billion in revenue in 2017, with US$6.5 billion coming from hotels and casinos located along the major artery traversing the center of the city, also known as the Las Vegas Strip (“Strip”) (LVCA, 2017). Notwithstanding its prominence in the hotel industry, we are unaware of any other analysis of this kind for Las Vegas.
In addition to providing multiple venues for gaming, the Strip also provides a focal point for tourists due to the myriad bars and restaurants as well as free entertainment adjacent to many casinos, such as Bellagio’s fountains. Thus, the Strip is part-hotel row, part-CBD, and part-tourist attraction. As such, we expect hotel prices to be highest near the Strip, declining with distance from both the Strip and the Center of the Strip. We also wish to provide a detailed visualization of the spatial price mapping for these two points of reference and to quantify the proximity premium—that is, the value or “premium” exceeding what one would normally be willing to pay for an item, due to its closeness or “proximity” to a particular point of reference (see Sah et al., 2016). We wish to estimate this using specific, incremental distances from the Strip and Center of Strip, while controlling for important room amenities, hotel characteristics, and time effects such as day of the week and year of booking.
Research presented here provides support for land-rent gradient theory (Alonso, 1964; Muth, 1969) and its early application for hotel properties by Yokeno (1968) and suggests that the Strip, especially the Center of Strip, serves as an important attraction for hotel visitors to Las Vegas who are willing and able to pay a premium to stay near the center. As with many other investigations, we find a negative relationship between price and distance. However, prior investigations in this area have essentially investigated an “average price–distance” relationship. We are aware of only one other investigation (Valentin and O’Neill, 2019) that uses higher order terms to estimate the price–distance relationship as we do here. We also estimate specific distance incremental effects (or “splines”) which provides isolated, specific, and localized estimations of the distance effects—something which is not possible with the prior “average price–distance” approaches to the topic (regardless of location). We believe this provides a level of detail in understanding this relationship which has heretofore gone uninvestigated. The proximity premium disappears beyond one-half of a mile from the Strip, itself. The Center-of-Strip premium appears to be much more robust, disappearing beyond 2.25 miles from the Center of the Strip.
Literature review
Empirical research on hotel location
Research on hotel location has followed closely from seminal work by Hartman (1989) who used a hedonic estimation technique similar to that of Rosen (1974) to estimate the impact of hotel amenities on price. This research was expanded to include important spatial controls such as distance from the beach (Espinet et al., 2003; Rigall-I-Torrent and Fluvià, 2011; Thrane, 2005), proximity to an interstate highway for budget hotels and motels (White and Mulligan, 2002), and proximity to shopping and entertainment districts (Andersson, 2010). Findings are generally consistent in prior investigations, determining that increasing distance from the CBD is negatively associated with hotel prices in a variety of settings including Oslo, Norway (Thrane, 2007), Chicago (Lee and Jang, 2012; Valentin and O’Neill, 2019), NSW Australia (Bull, 1994), Singapore (Andersson, 2010), New York City (Zhang et al., 2011a), Jerusalem (Shoval, 2006), Southeastern Wisconsin (Monty and Skidmore, 2003), and six US cities (Lee and Jang, 2011). Importantly, Chen and Rothschild (2010) find an opposite result for Taipei but hypothesize that this is due to larger luxury resorts being located outside of the city and a highly competitive hotel market in the CBD.
Yokeno (1968) provides an early model explaining why hotels are often located in and around the CBD—that is, they are able to outbid competing industries for land. Employing the bid-rent gradient model presented in Alonso’s (1964) seminal work on urban location theory, Egan and Nield (2000) theorize that hotels fall into a spatial hierarchy, with luxury, five-star hotels in the center, followed by budget type-A hotels, then business hotels, and finally budget type-B hotels at the periphery. These models are consistent with the empirical findings discussed above in which hotel prices decline with distance from the CBD.
Hotel and room attributes have also been found to influence hotel prices. For example, previous investigations have found that having an LED television (Chen and Rothschild, 2010), a minibar (Thrane, 2007), breakfast (Lee and Jang, 2011; Thrane, 2005; White and Mulligan, 2002), and parking (Espinet et al., 2003; Lee and Jang, 2011; Thrane, 2007) is positively associated with hotel price. Due to multicollinearity among the many hotel attributes (a common problem in these studies), we limit our analysis here to a subset of these attributes.
Perhaps due to data limitations, there is a dearth of investigations which include room size (notable exceptions are Chen and Rothschild, 2010; Monty and Skidmore, 2003) as an explanatory variable. This is surprising given the importance of square footage in related research areas such as the housing literature (see Sirmans et al., 2006). We are able to capture square footage of hotel room in this investigation and find it to be very significant. While there is a paucity of investigations that include square footage of room, many have included hotel-level characteristics such as “hotel size” (often proxied by the number of hotel rooms—e.g. see Balaguer and Pernías, 2013; Becerra et al., 2013; Chen and Chang, 2012; Hung et al., 2010; Mohammed et al., 2019; Zhang et al., 2011b) and “hotel quality,” proxied as a star rating (Andersson, 2010; Bull, 1994; Espinet et al., 2003; Israeli, 2002; Kuminoff et al., 2010; Melis and Piga, 2017; Rodríguez-Algeciras and Talón-Ballestero, 2017; Sánchez-Pérez et al., 2019; Thrane, 2005). We include both of these hotel-level characteristics here and expect their effect to be positive. However, in order to avoid the difficulties of the complete star-category indicator approach noted by Thrane (2005), we include a five-star dummy variable as a proxy for overall hotel quality. The star rating is based on customer reviews, not necessarily a specific set of hotel characteristics (see Wang et al., 2019 for a discussion of the importance of online user ratings; and Sánchez-Pérez et al., 2019 for a discussion of electronic word-of-mouth ratings). Next, we wish to introduce a conceptual/theoretical model to explain the role of distance in hotel pricing.
Model
Method
As noted above, hotel clients generally prefer to locate near spatial centers or attractions such as CBDs, airports, or tourist attractions like sunny beaches in order to reduce travel time costs, resulting in greater demand for hotels in these locations. Hotel prices would therefore be higher at these locations, assuming hotel supply is also spatially constrained. More formally, we assume hotel clients are rational agents, solving constrained maximization problems in which time travel costs are positive. Following closely from Lee and Jang (2011) and Hamilton and Röell (1982), we assume that a typical Las Vegas hotel guest’s utility from staying at a hotel is expressed as U(h, g), where h is the number of hotel nights spent per year and g represents the amount of all other goods purchased per year. The utility of hotel guests

is assumed to be subject to a budget constraint

where Y is the hotel guest’s annual budget, c is travel cost from the hotel to the Strip in terms of time and money for a one-mile trip, a is the number of daily round trips from the hotel to the Strip, x is the round trip distance from the hotel to the Strip (in miles), ph is the nightly price of hotel goods, pg is the price of all other goods and services. Solving (2) for the hotel price, the result is

Under the following conditions


the equilibrium outcome implies that as x increases, ph
falls. This outcome—tested in the context of distance from the CBD—has been empirically validated by Valentin and O’Neill (2019) and Shoval (2006), who found that hotel prices decline exponentially with distance from the CBD. We wish to test whether this relationship would hold in this specific context. More formally, our hypotheses are:
In what follows below, we present our data and empirical methodology for this current analysis.
Methodological framework
Sample and data collection
The data for the room and hotel characteristics were collected by visiting the popular hotel site vegas.com on multiple days from August 31, 2012 to October 1, 2012 and then again from June 21, 2017 to July 5, 2017. We collected hotel night information for expected one-night stays from October 23, 2012 to October 27, 2012, then from August 14, 2017 to August 20, 2017, and again from October 23, 2017 to October 29, 2017. We collected data in two different years, five years apart, and in multiple months to ensure generalizability and robustness of our results. We also collected data at least 2 months in advance and collected many observations in a single day of data collection in order to reduce volatility of prices from day to day, which is likely to increase as the reservation date approaches (see Palmquist, 2005; Soler et al., 2019). A total of 10,489 observations (hotel night stays) were collected initially. However, because we wished to include only non-holiday observations, we dropped the December dates and removed outliers, resulting in a final total of 6087 observations. 1 The sample includes all of the major hotels within a five-mile radius of the Center of the Las Vegas Strip (which we define geographically, based on vegas.com map provided in Figure 1, as the intersection of Flamingo Road and Las Vegas Boulevard). Distance measures were determined using Google Maps’ address-to-address walking distance. The 5-year interval of data provides a broader framework and the resulting data set is among the most comprehensive data sets we are aware of for this type of analysis.
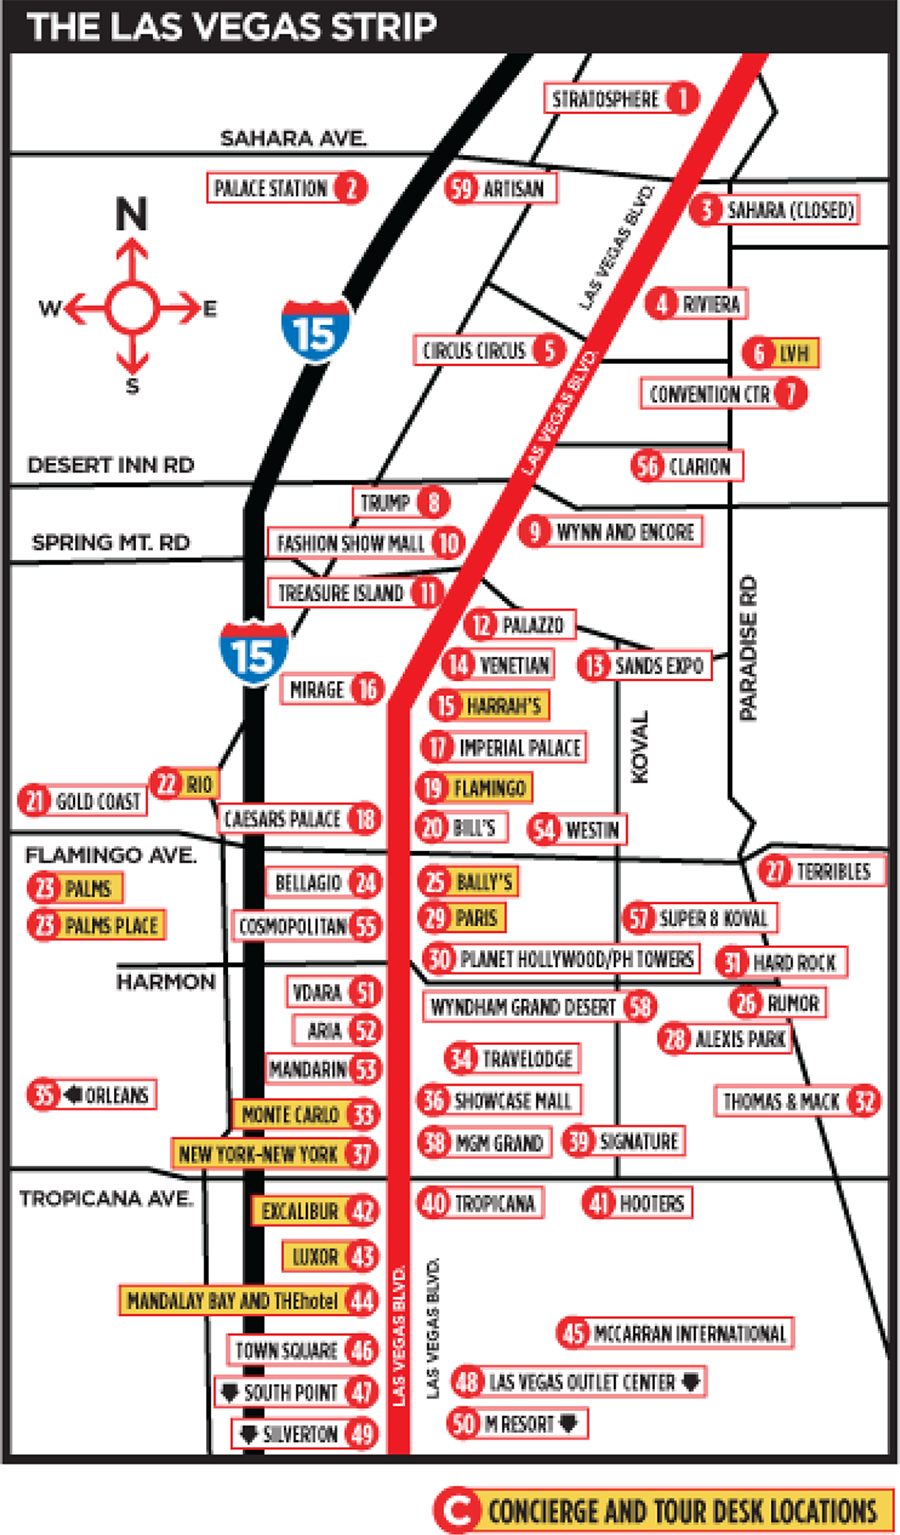
2-D visual map of Las Vegas Strip.
Consistent with previous investigations (Andersson, 2010; Lee and Jang, 2011, 2012; Zhang et al., 2011a) we use a hedonic pricing model with a log-dependent variable in our estimations. The log transformation has favorable econometric properties, particularly with right-sided skewness, as is the case here, which we confirm comparing our probability density function (PDF) for “log price” (Figure 2) with “price” (Figure 3). The PDF for “log price” appears to be distributed normally while that for “price” is skewed right.
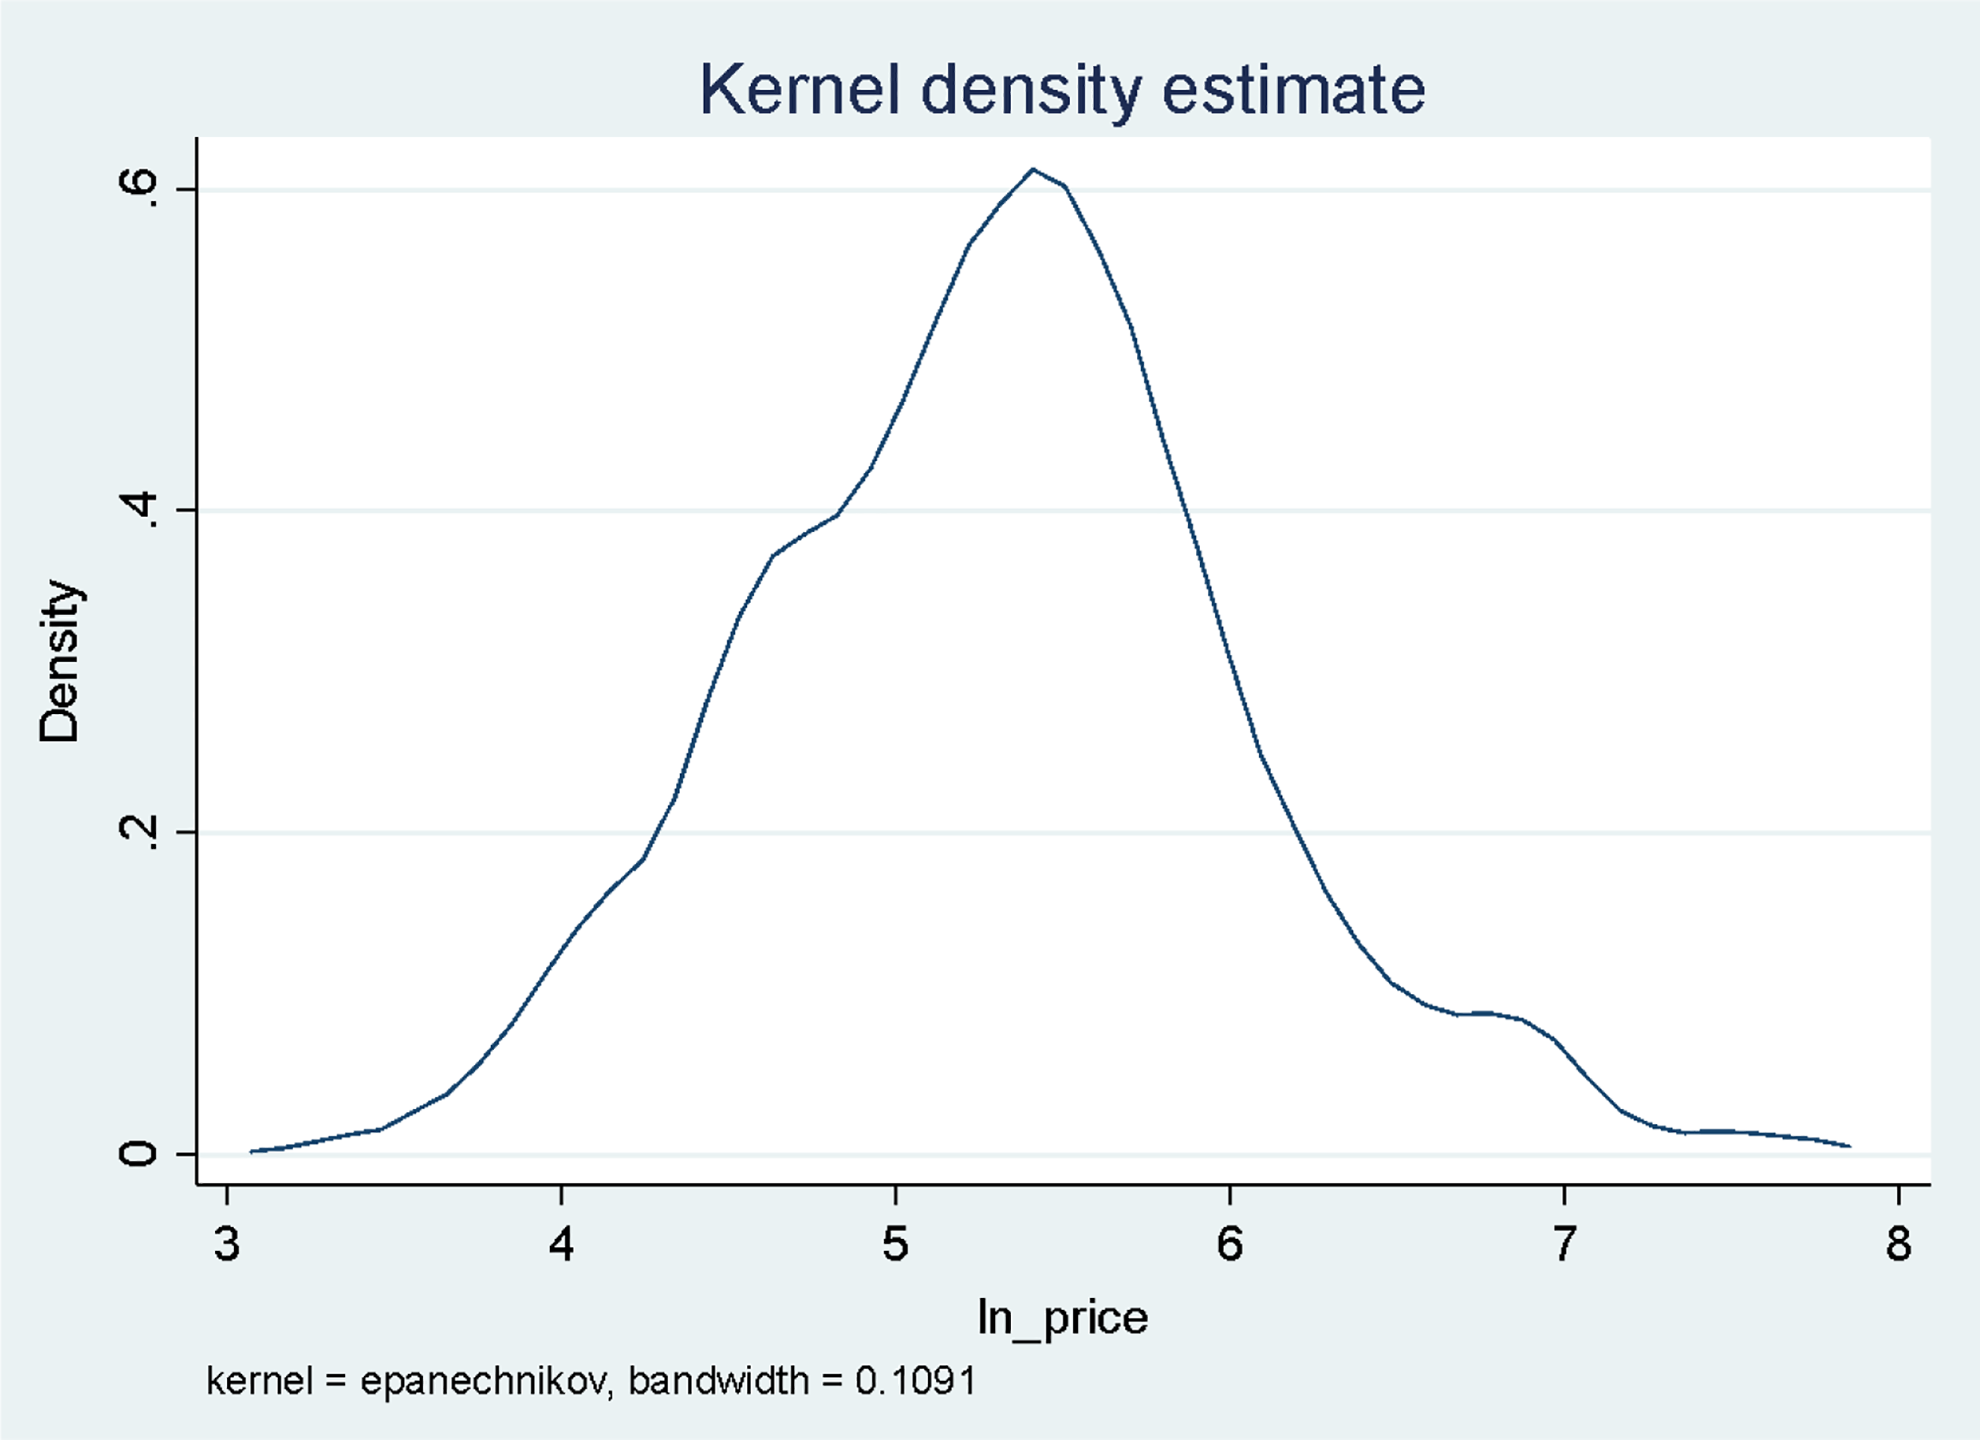
Kernel density estimate for natural log of hotel room price.
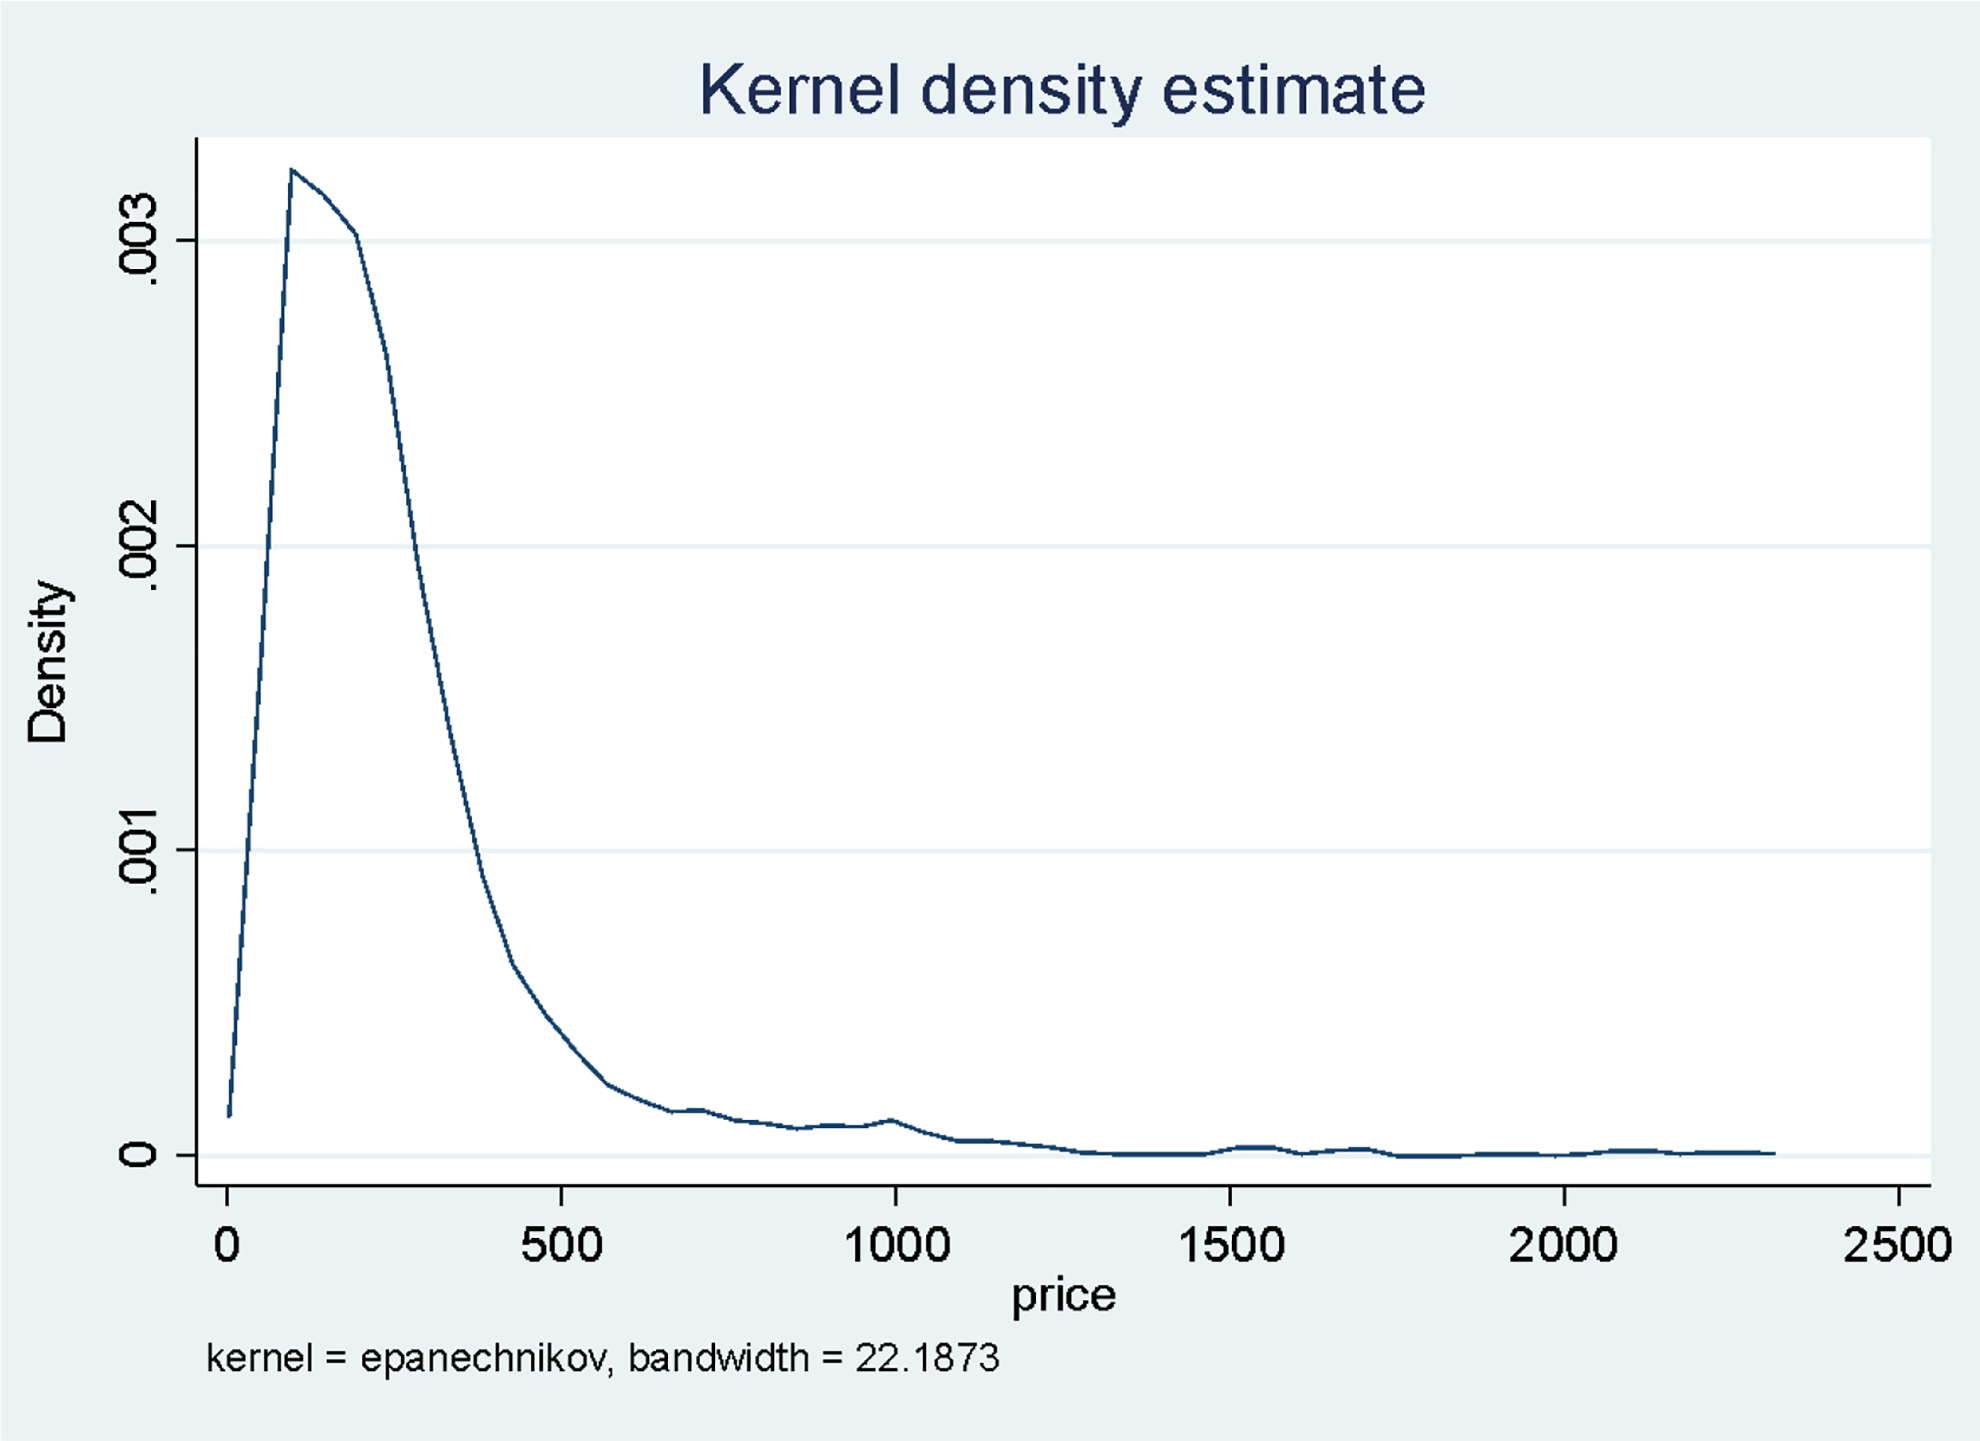
Kernel density estimate for hotel room price.
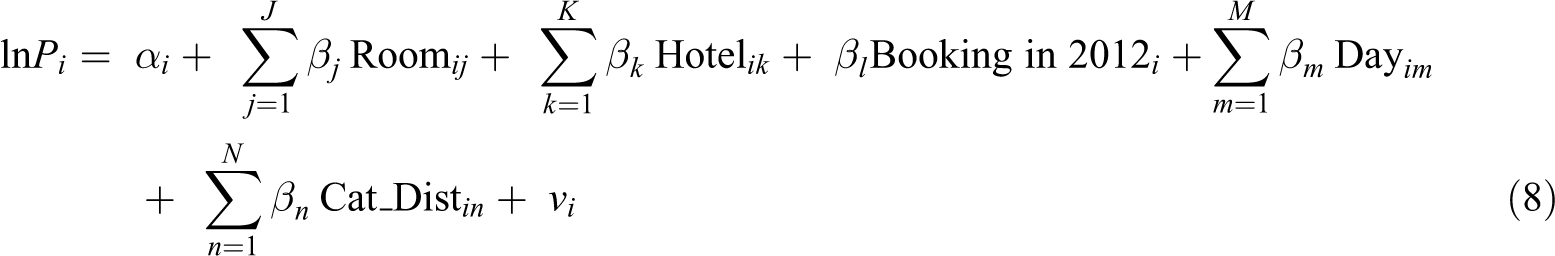
Model 1 is presented here
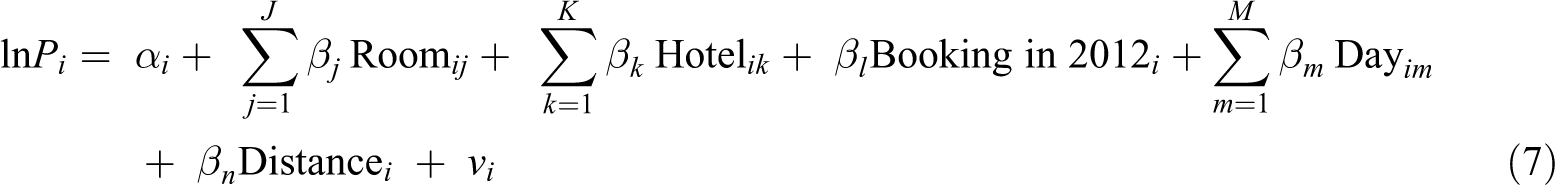
where lnPi is the natural log of nightly hotel price for observation i. The variable Room ij is the jth room characteristic variable (i.e. square footage of hotel room, dummy variables for having one king bed, an in-room sound system, a separate shower and bath, a minibar, and a variable for the number of televisions in the room) for observation i, Hotel ik is the kth room characteristic variable (i.e. having a five-star popular rating and a proxy for size—number of hotel rooms), Booking in 2012 i is a dummy variable for a booking that took place in 2012 (compared to 2017) for observation i, Day im is the mth day variable for observation i (where the day of the week is either Friday night or Saturday night, compared to all other days of the week), and Distance i is the continuous distance to the Strip (specified in miles and is the shortest distance to the closest part of the Strip) for observation i. In model 2, rather than including a continuous distance effect as in model 1, we replace the “distance” variable with a piece-wise linear spline in order to improve precision in the distance estimation. This “spline” approach has been used in other related contexts such as residential real estate models which isolate the specific distance incremental effects moving away from the Pacific Coast (Conroy and Milosch, 2011) and from elementary schools (Sah et al., 2016). Model 2 is specified as follows
where everything is as specified in model 1 except
Analysis and results
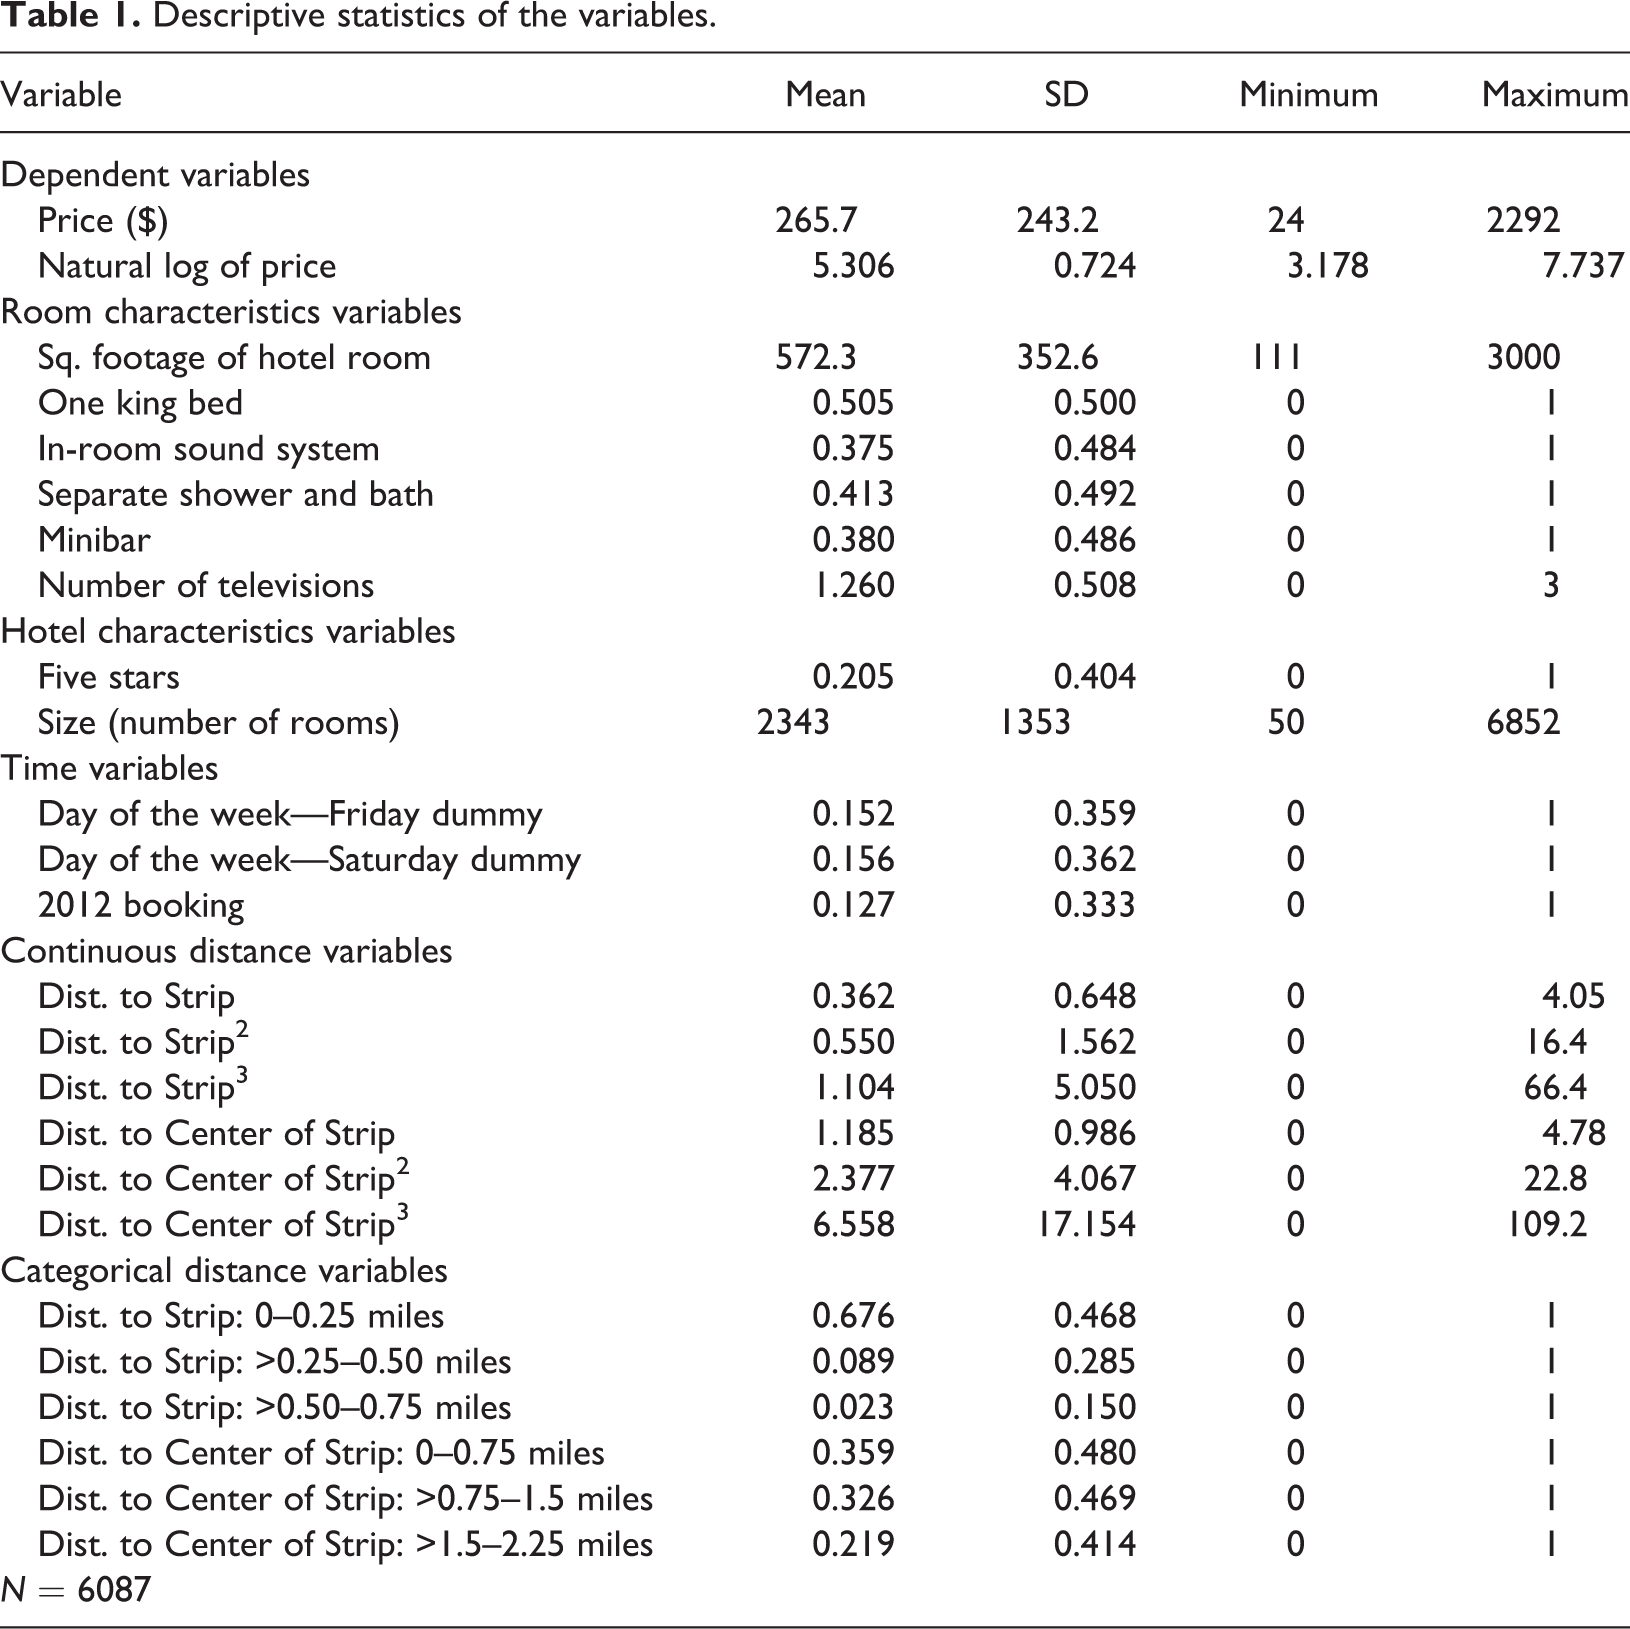
Having specified the empirical models to test the effect of distance on hotel room prices, we present the descriptive statistics for hotel night stays in Las Vegas (Table 1). In all four models, we include six Room Characteristics variables (Square Footage of Hotel Room, One King Bed, In-Room Sound System, Number of Televisions, Minibar, and Separate Shower and Bath), two Hotel Characteristics (a dummy for five-star rating of hotel and the number of rooms in the hotel), and three Time Characteristics variables (Dummy for Friday night, Dummy for Saturday night, and a Dummy for a hotel booking in 2012). We were limited to the room characteristics which were clearly articulated in all of the hotel room listings. We expect the signs for each of the room characteristics variables to be positive since they reflect amenities which are likely valued by customers (Schamel, 2012). Consistent with Schamel’s finding of 48% higher weekend rates, we expect the coefficients for Friday and Saturday dummies to be positive and significant. Given the combined factors of inflation and economic recovery from the Great Recession by 2017, we expect the coefficients for the 2012 dummy variable to be negative.
Descriptive statistics of the variables.
The difference among the four models has to do with (a) the point of reference (i.e. distance to Strip or Center of Strip) and (b) the type of distance variables (i.e. Continuous Distance variables or Categorical Distance variables). The Continuous Distance categories (including distance, distance-squared, and distance-cubed) are included in models 1 and 3 while the piece-wise linear spline categories (Categorical Distance) are included in models 2 and 4. We use the distance to the Strip (which is the shortest linear distance to the closest part of the Strip) for models 1 and 2, and distance to the Center of Strip for models 3 and 4.
In order to test whether there is a relationship between price per square foot of hotel room and distance, we plot the data and estimate a trend line for distance to the Strip (Figure 4) and Center of Strip (Figure 5). In both cases, the trend is negative in distance. In order to provide a more complete/nuanced spatial mapping, we estimated a heat map of average price per square foot for each hotel in the sample along the Strip (Figure 6). The heat map for hotel price per square foot appears to be quasi-linear along the Strip. We provide a more detailed three-dimensional bar map for average price per square foot for each hotel in the sample in Figure 7.
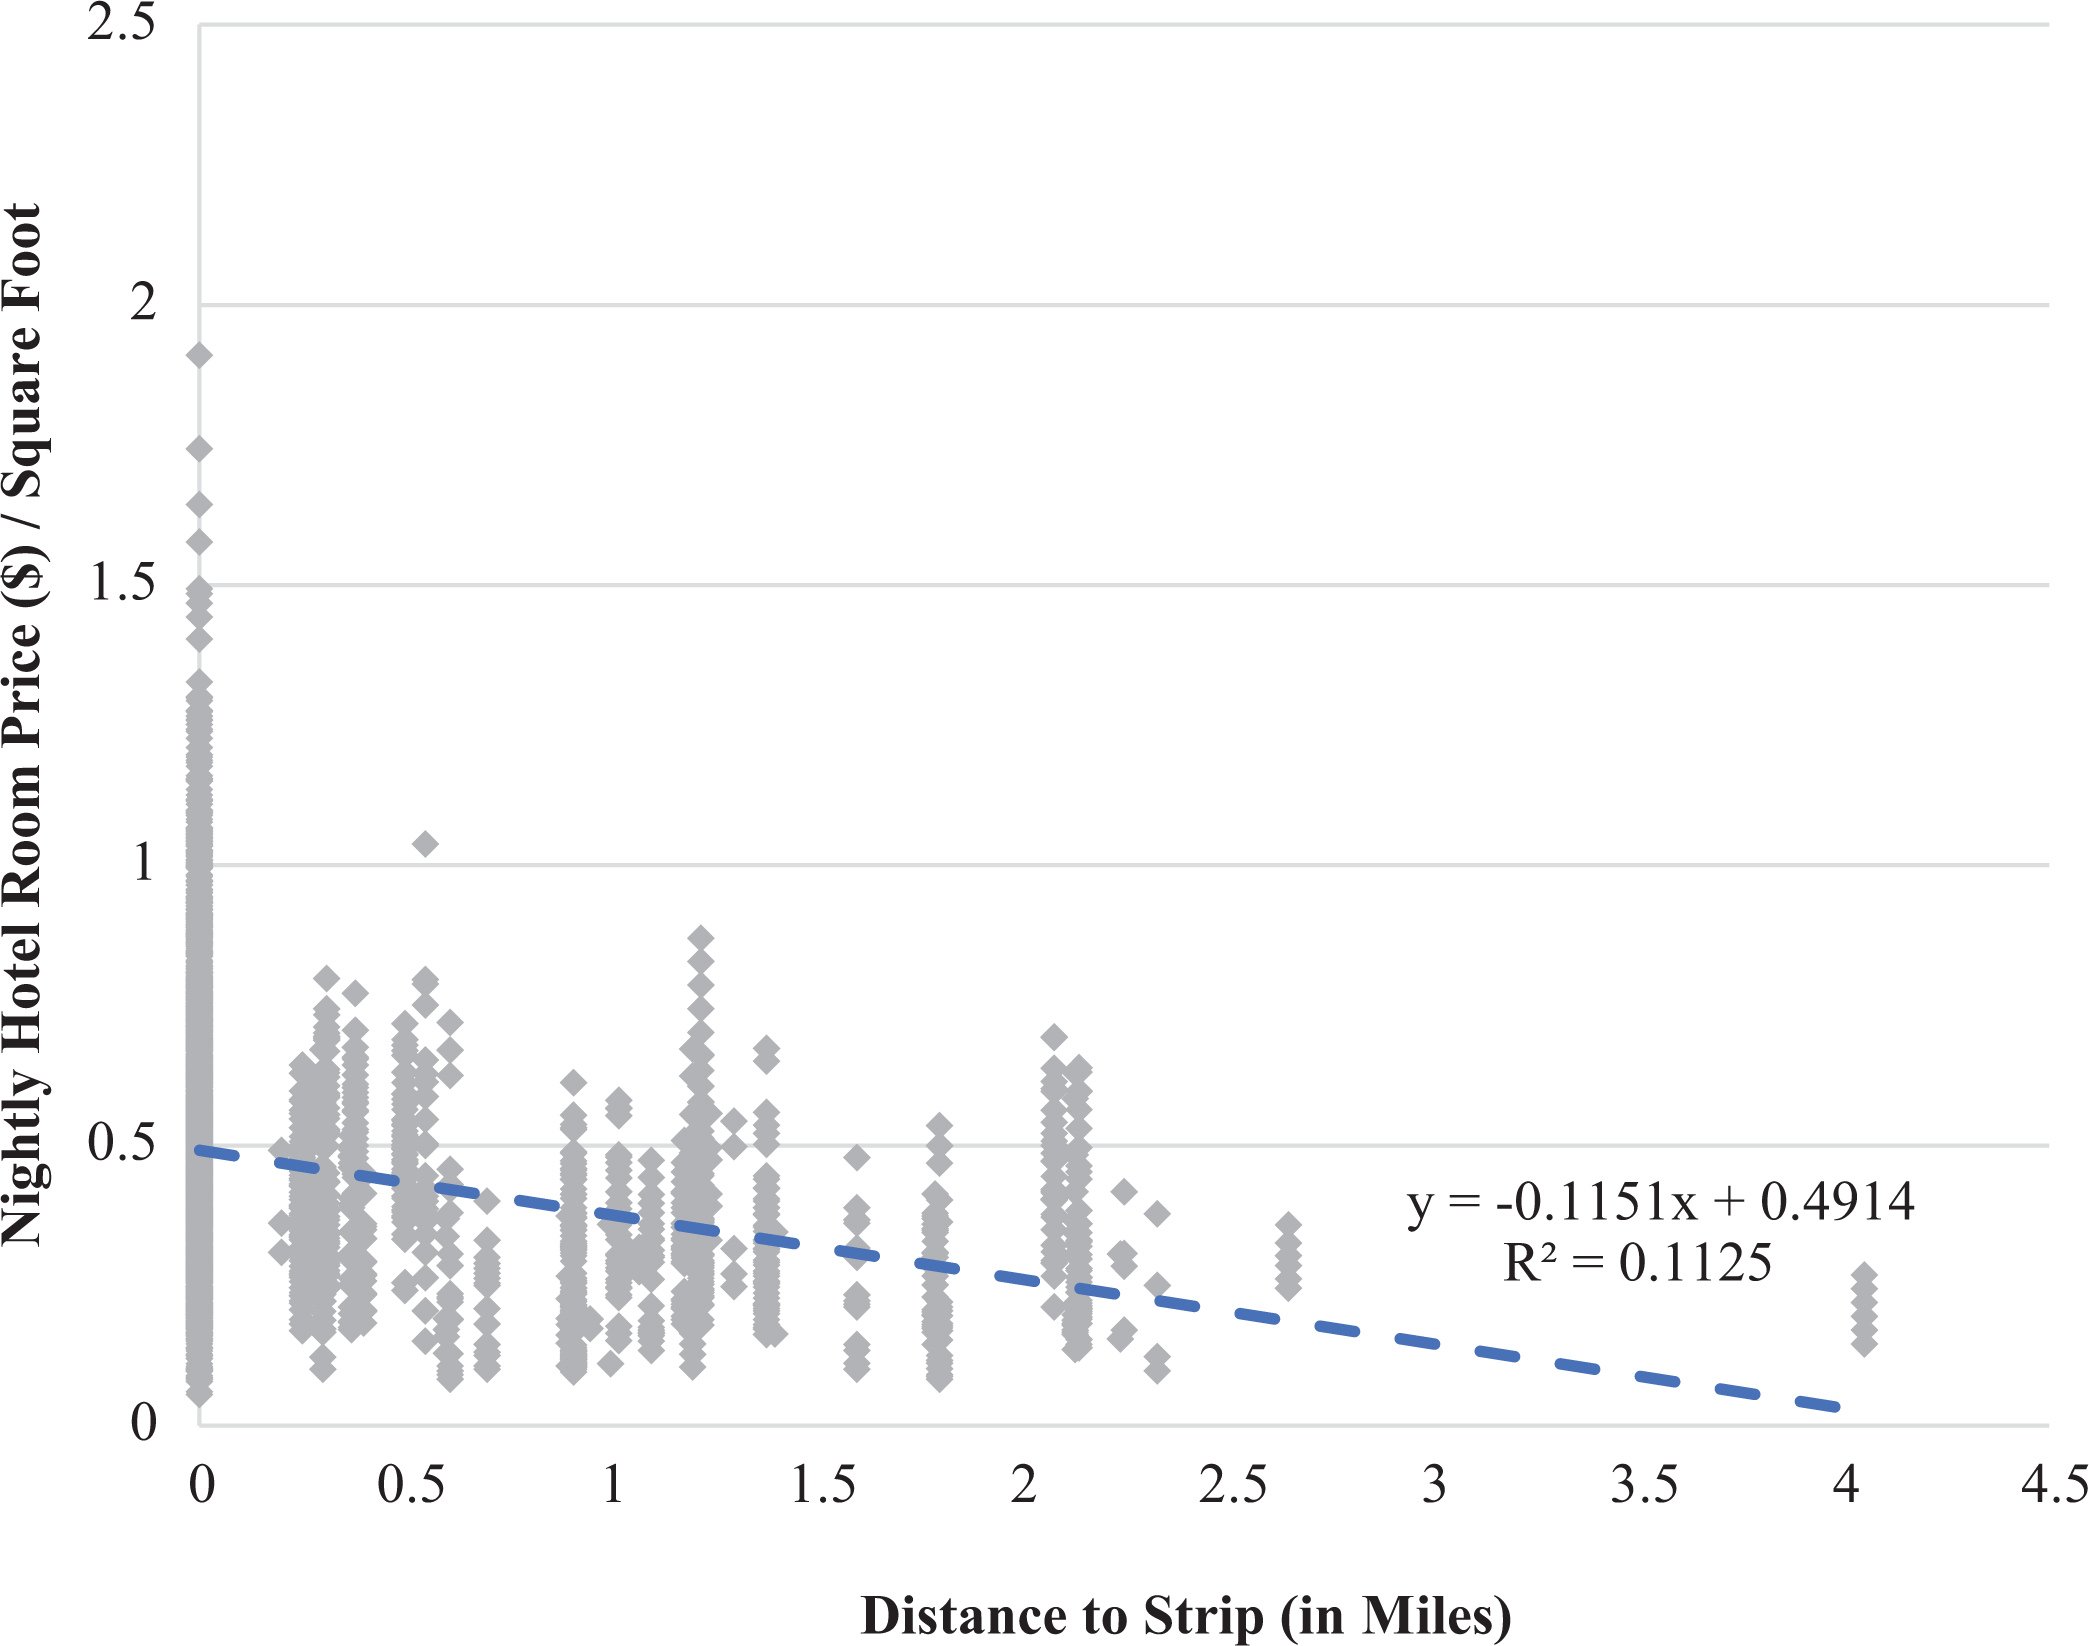
Nightly hotel room price ($) per square foot as a function of distance to Strip.
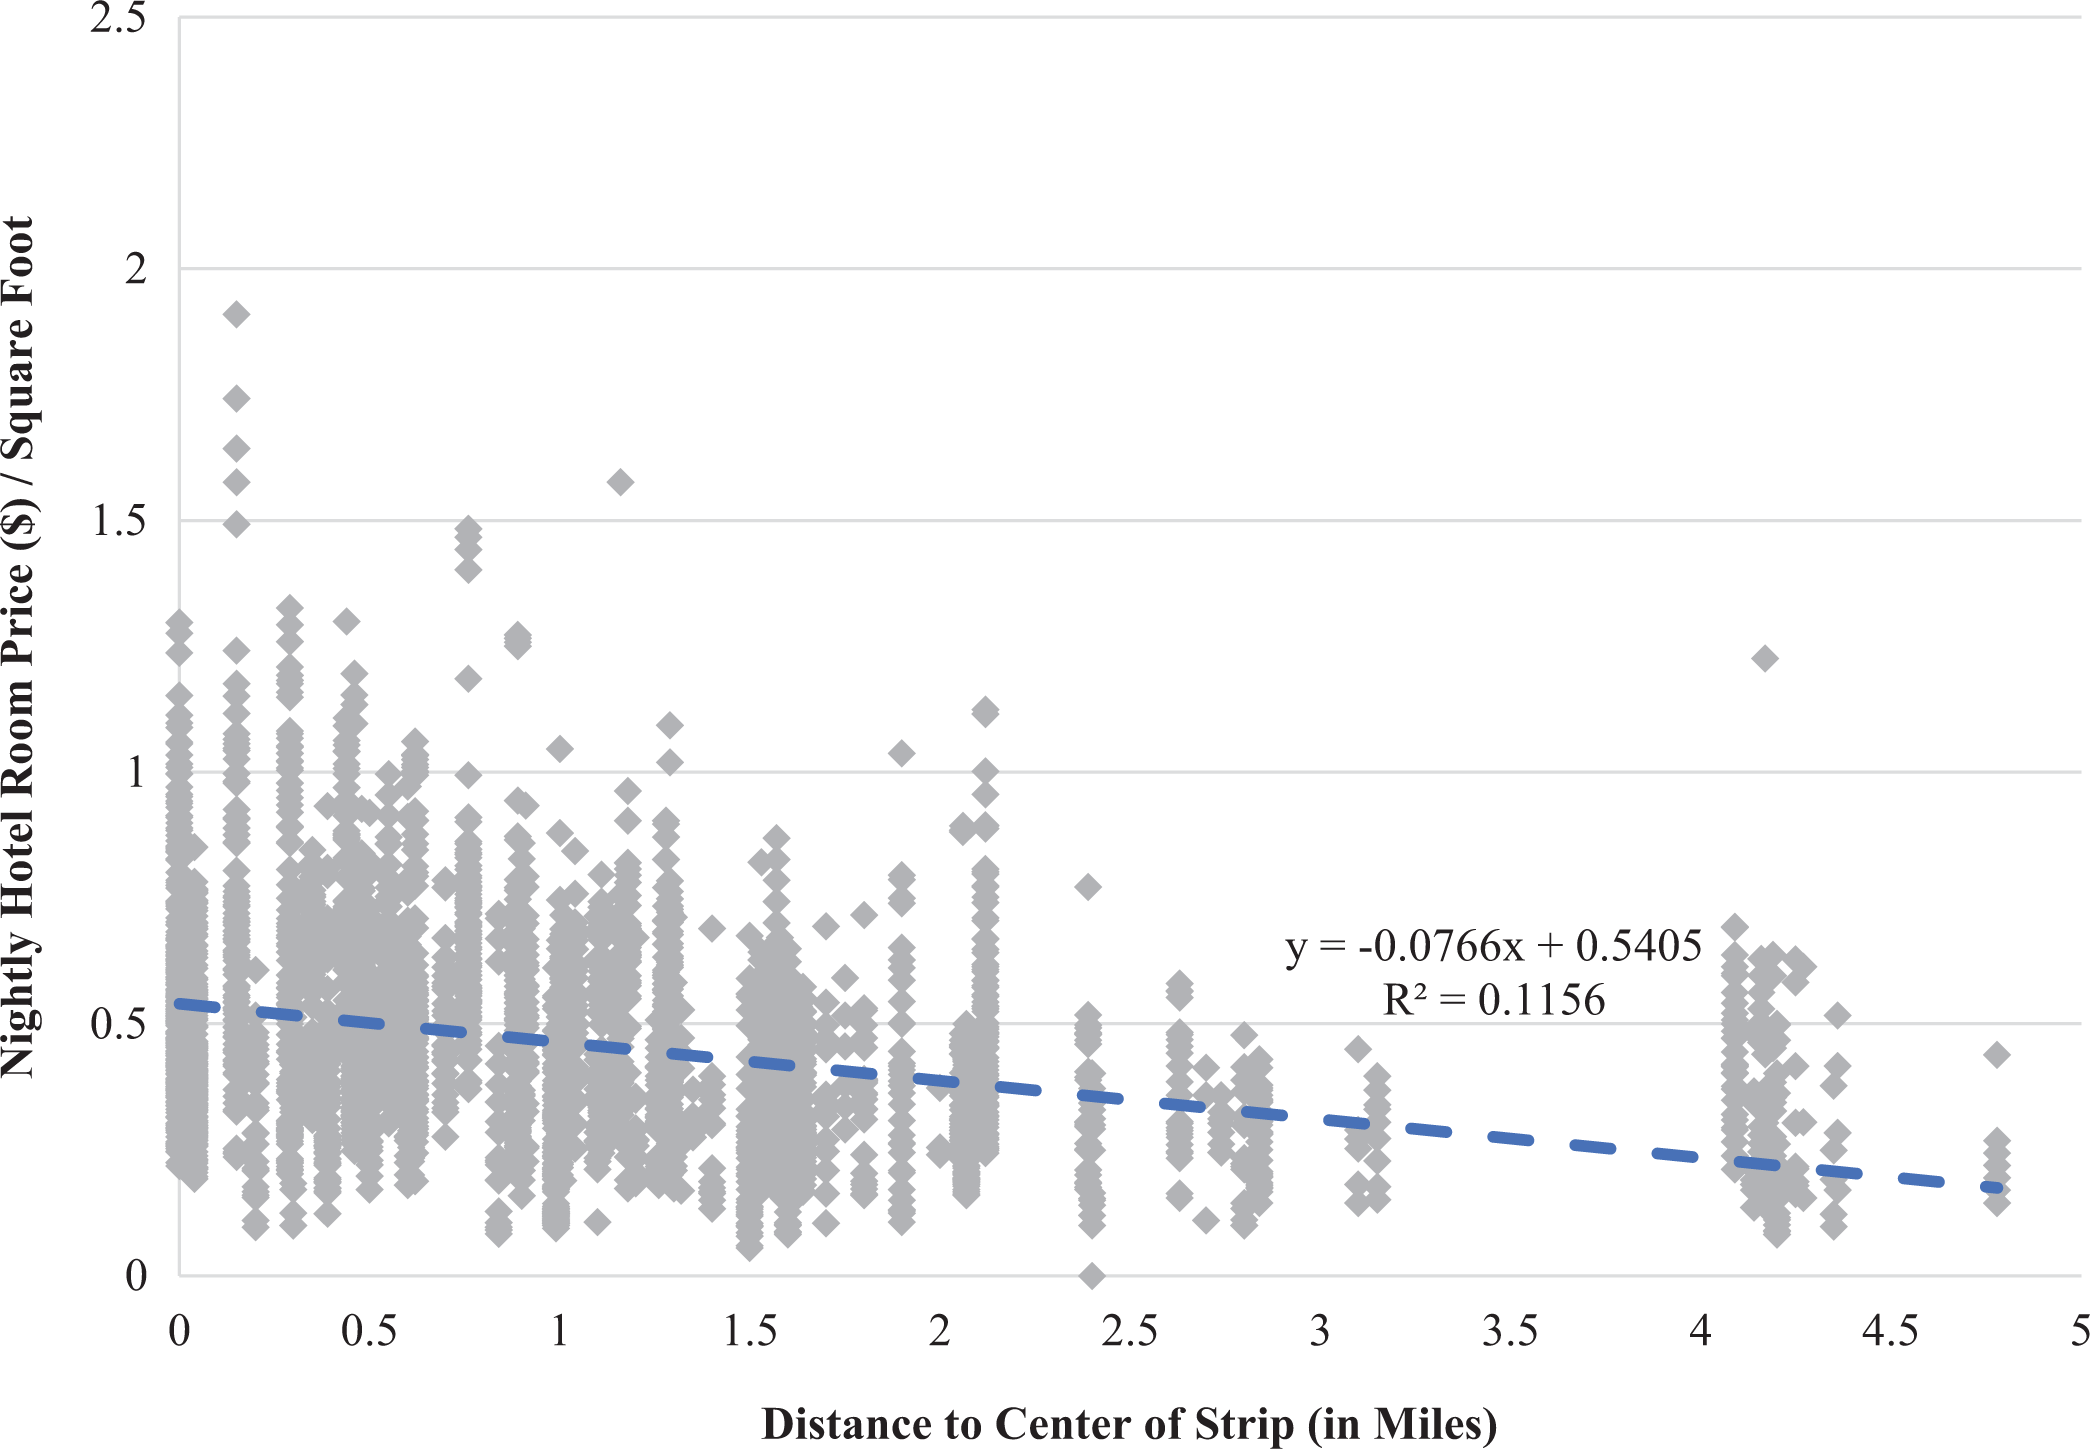
Nightly hotel room price ($) per square foot as a function of distance to Center of Strip.
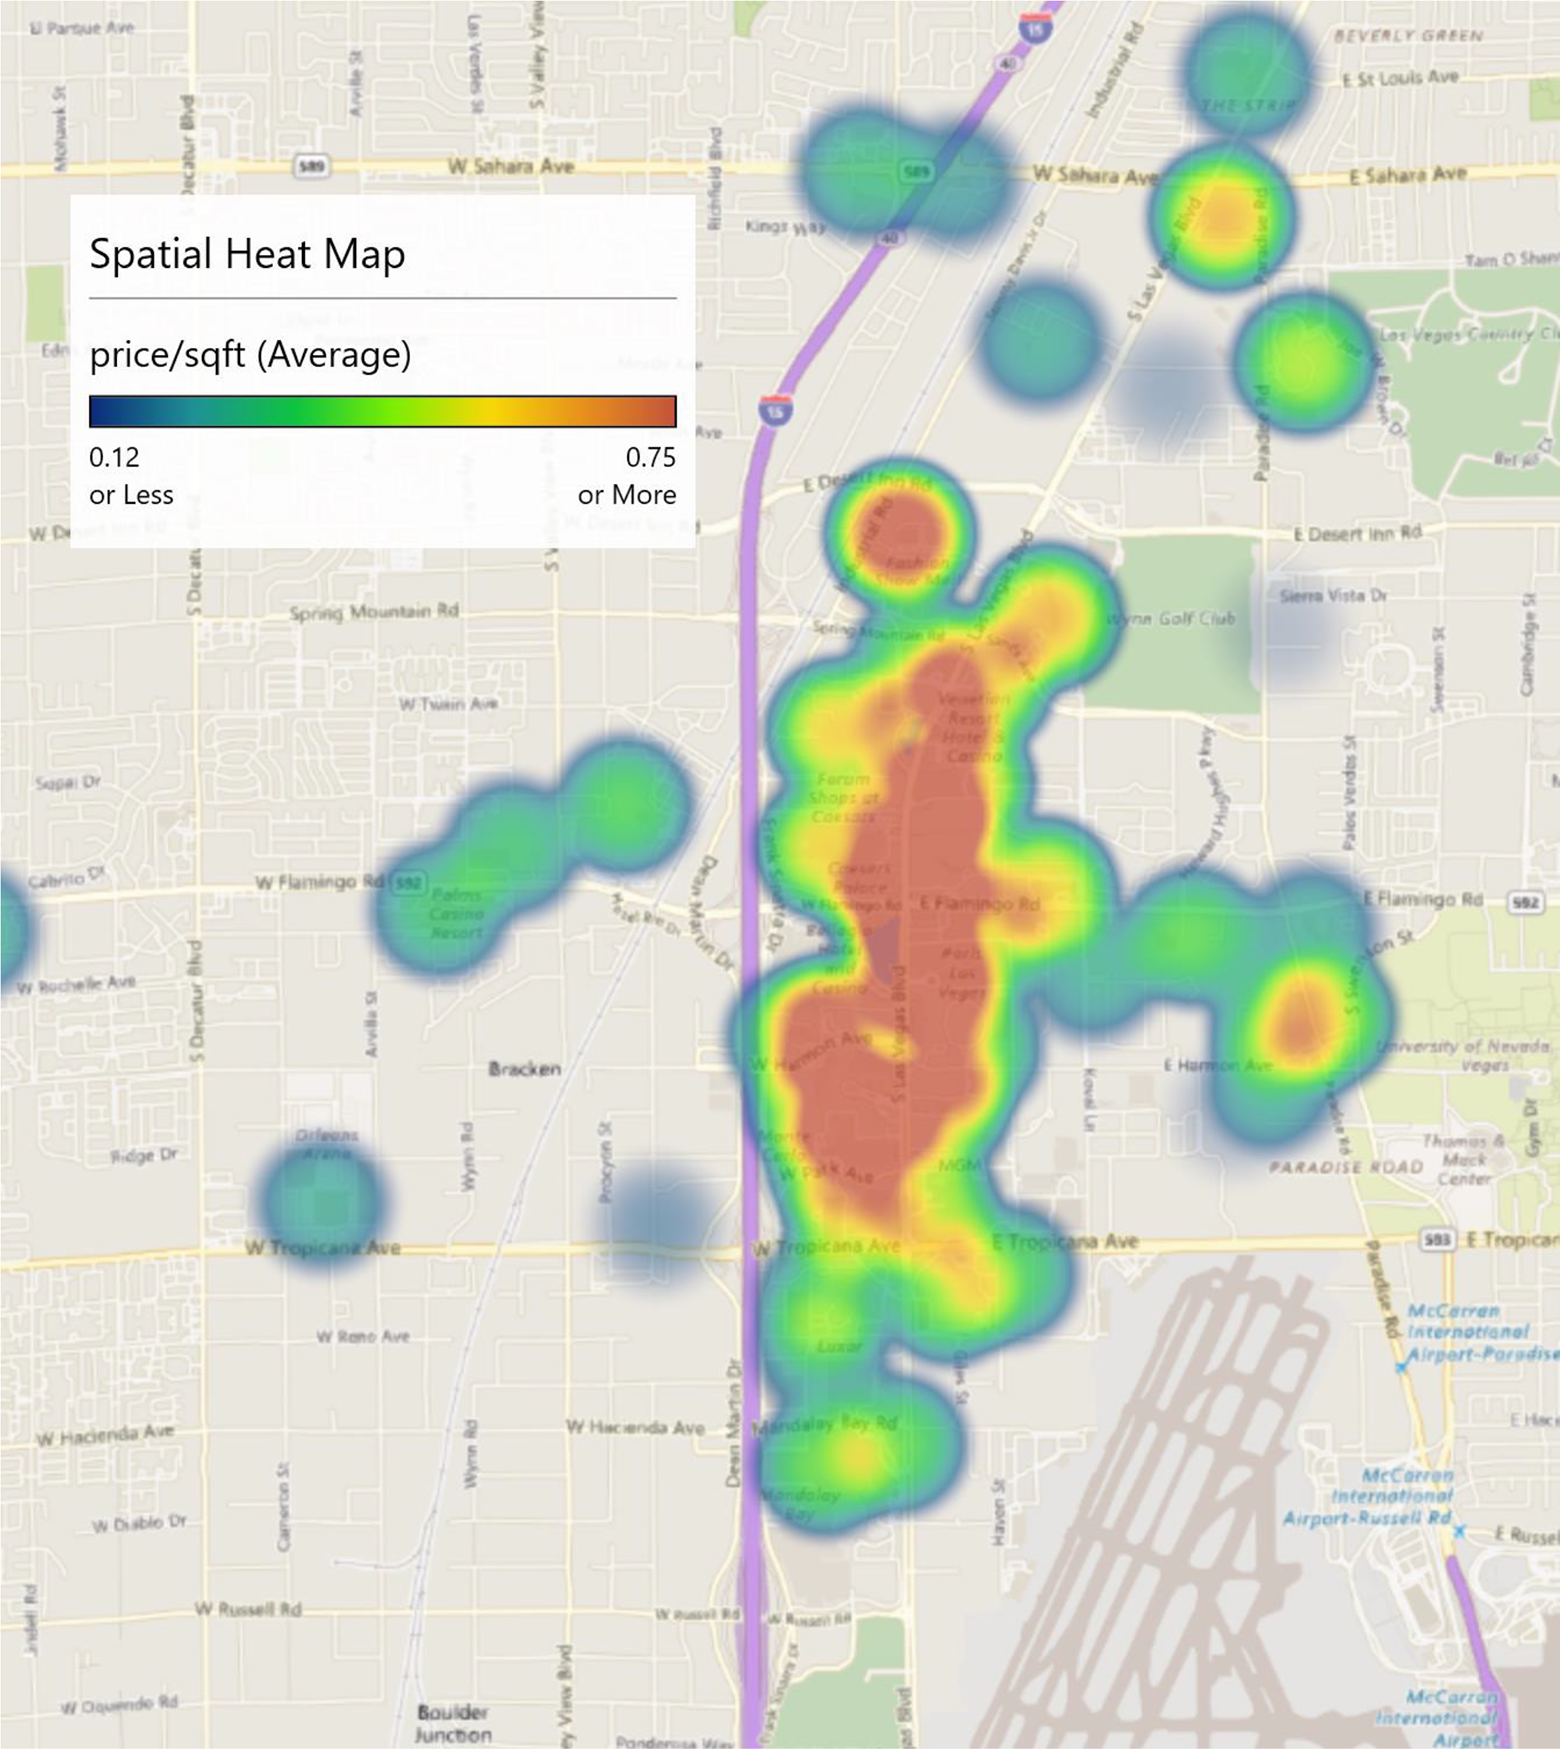
Spatial heat map of average nightly hotel room price ($) per square foot along the Strip.
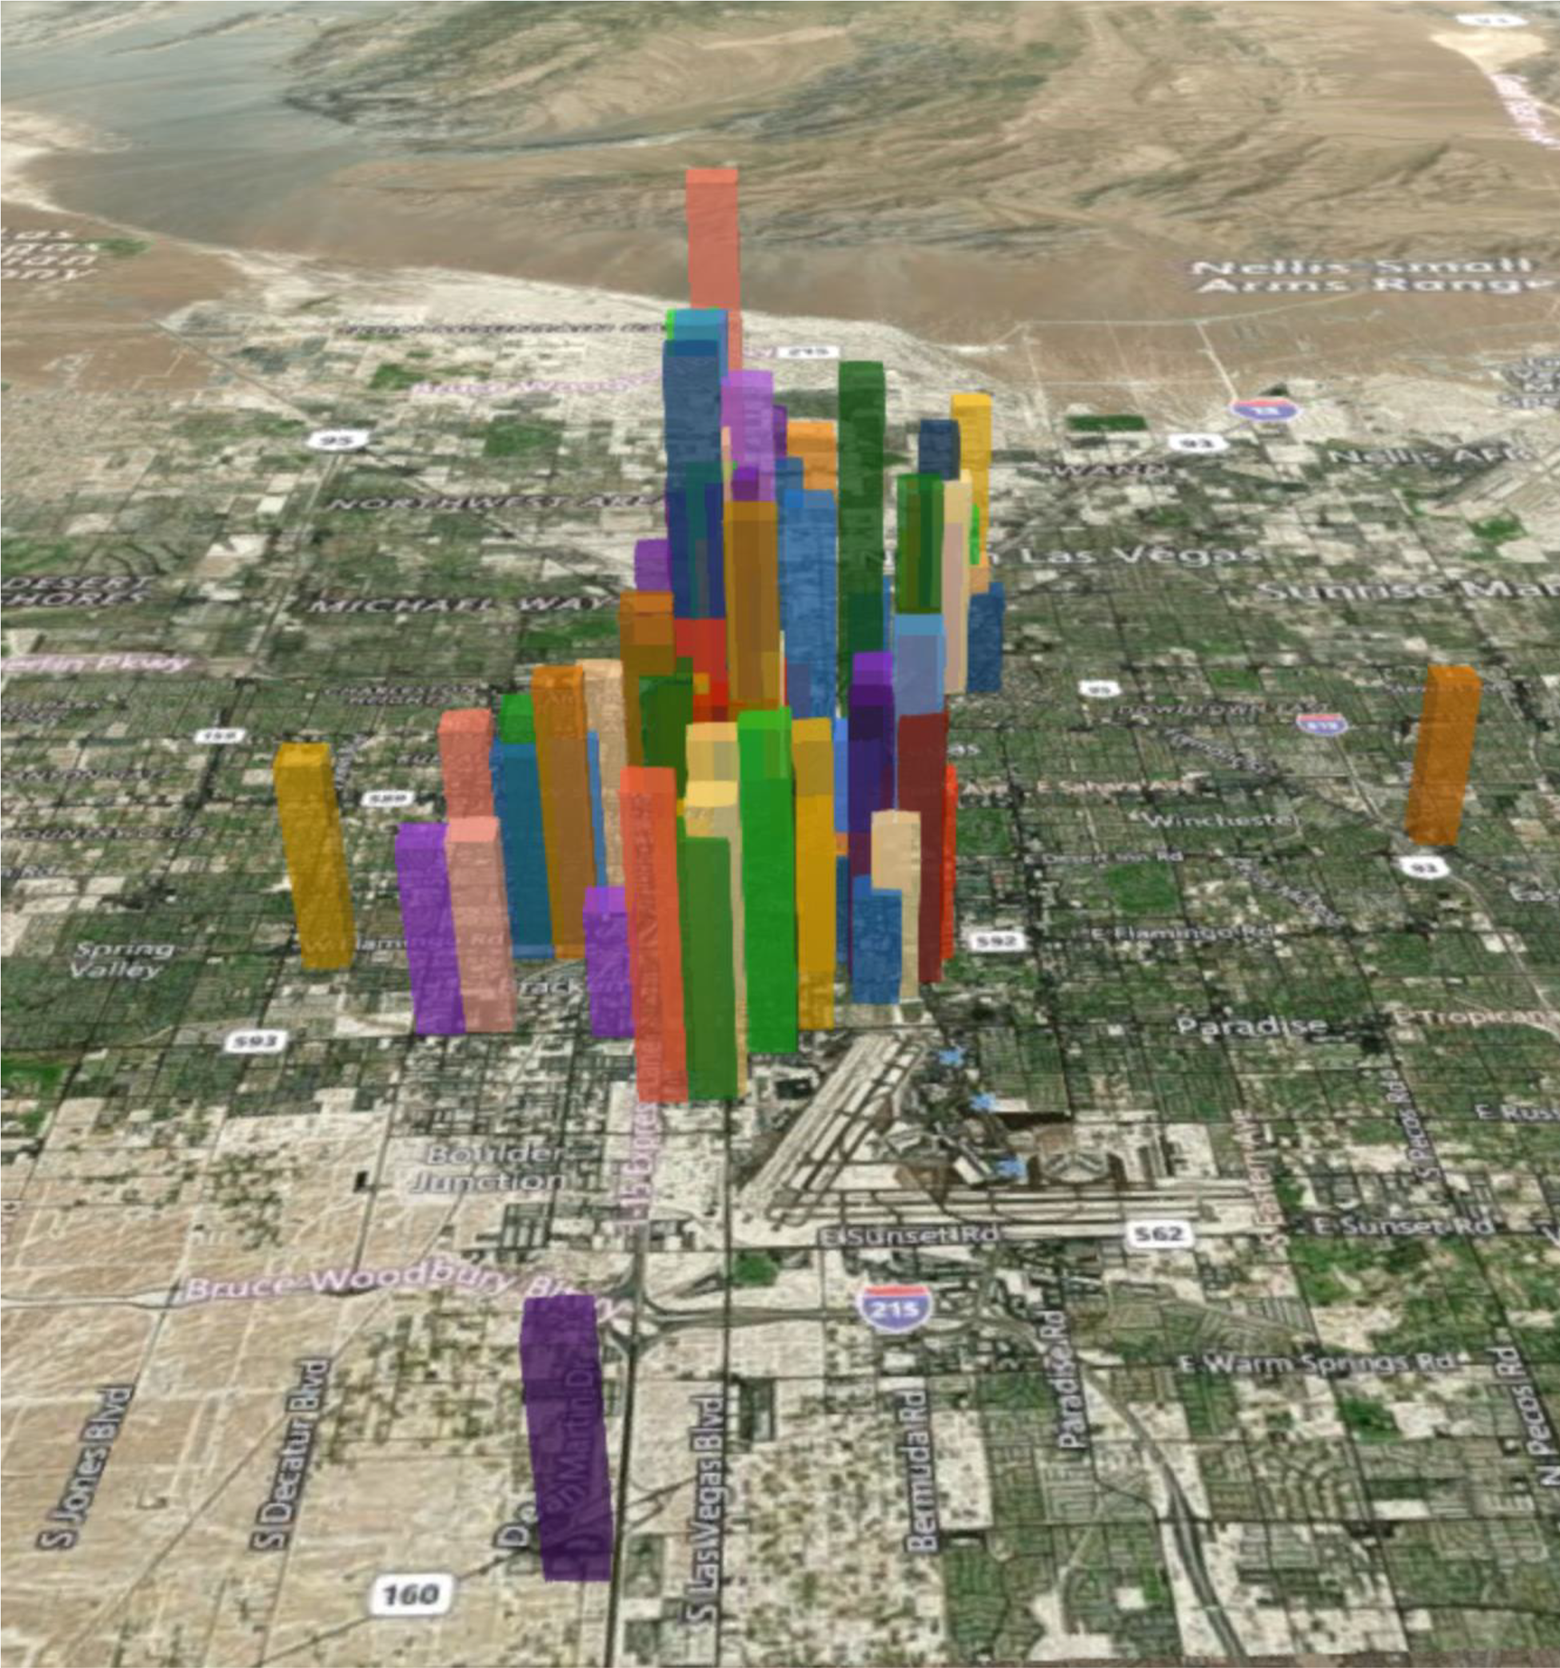
Three-dimensional bar map of average nightly hotel room price ($) per square foot along the Strip.
The results of the estimations of models 1 and 2 (for distance from Strip) and models 3 and 4 (for distance from Center of Strip) are presented in Table 2. Testing for heteroskedasticity using a Breusch–Pagan test, we reject the null hypothesis of no heteroskedasticity and estimate using robust standard errors (which are presented in Table 2). To avoid multicollinearity, we reduced the number of Room Characteristics variables in early estimations to these six variables based on their statistical power. The variance inflation factor for variables estimated in all four models is below 2.0 except for the distance, distance-squared, and distance-cubed variables, as well as the Categorical Distance to Center of Strip variables—which is expected—suggesting no significant multicollinearity among the included regressors. The F-statistic for each of the four models is very significant and the coefficient of determination is approximately 0.72.
Regression results for models 1–4 with natural log of price as dependent variable.
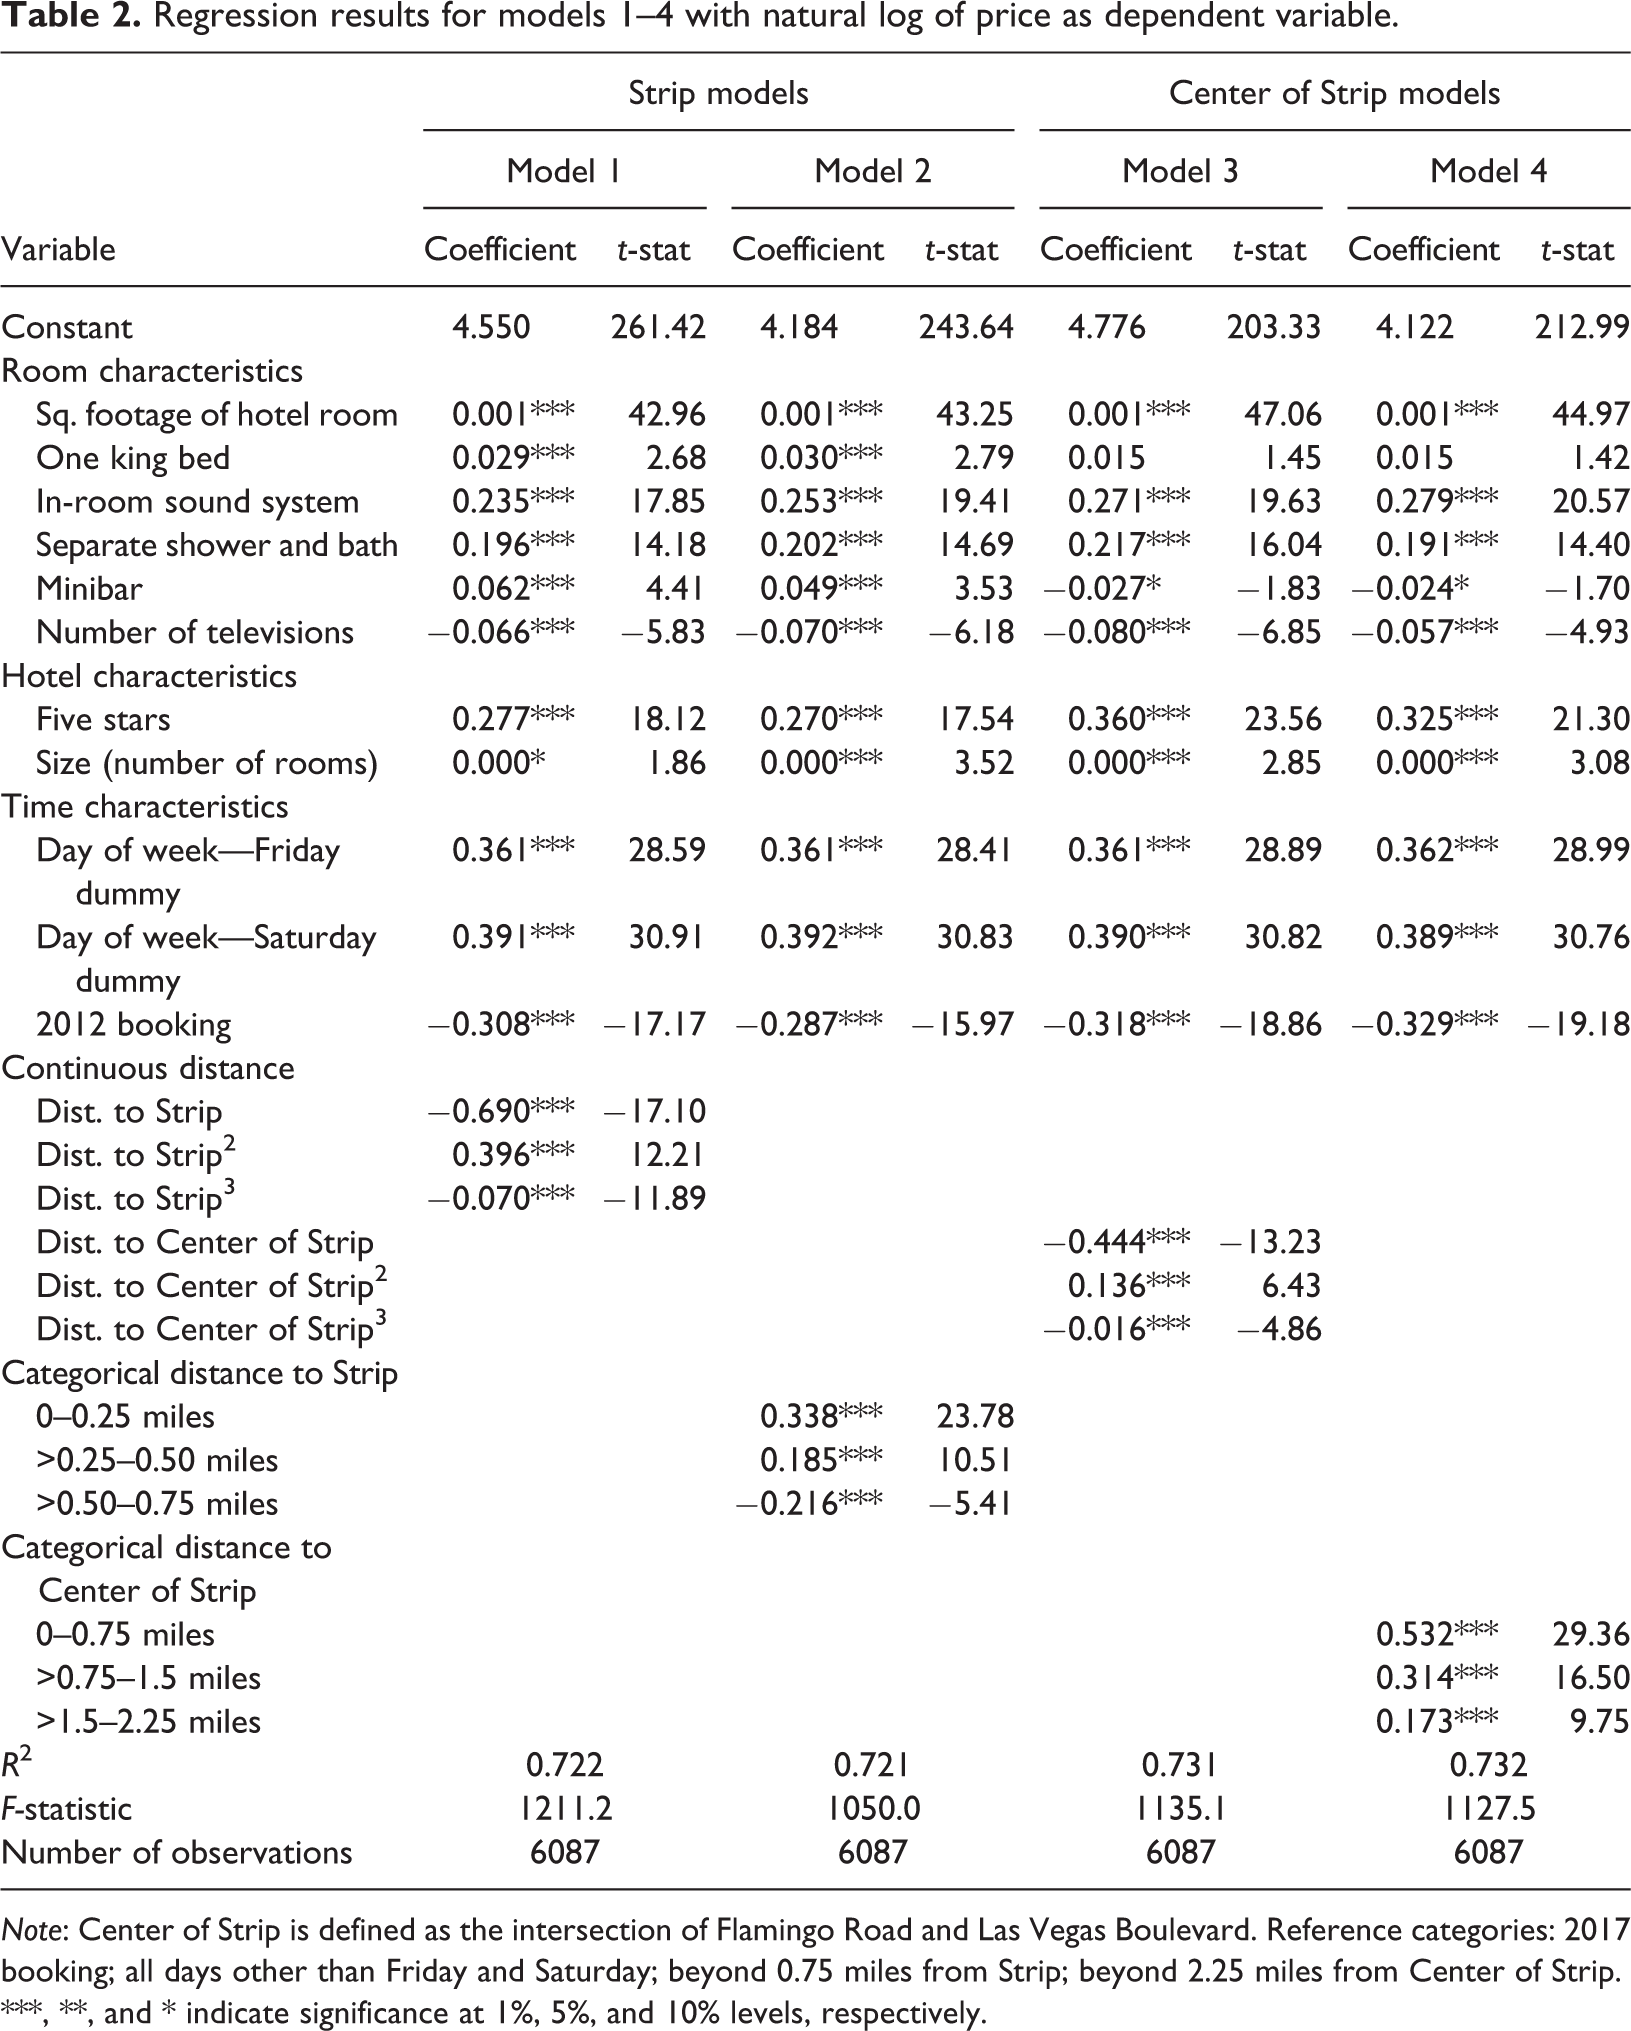
Note: Center of Strip is defined as the intersection of Flamingo Road and Las Vegas Boulevard. Reference categories: 2017 booking; all days other than Friday and Saturday; beyond 0.75 miles from Strip; beyond 2.25 miles from Center of Strip.
***, **, and * indicate significance at 1%, 5%, and 10% levels, respectively.
Each of the coefficients for the Room Characteristics category is as expected except for number of televisions, which is negative. Having in-room sound systems, a separate shower and bath and minibar (for models 1 and 2) and one king-sized bed likely confer additional amenity value and therefore have positive coefficients (see Schamel, 2012). We believe the positive coefficient for the One King Bed variable reflects the likelihood that rooms with One King Bed attract business travelers and couples, rather than families, which may be more price-sensitive. We are unsure why the sign of the coefficient for Minibar flipped in models 3 and 4 (compared to 1 and 2) though the coefficient is only marginally significant.
The five-star dummy, a proxy for hotel quality, is positive and significant. Having a five-star rating is associated with about a 32% higher hotel room rate in model 1. The effect is even higher in models 3 (43.3%) and 4 (38.4%) (see Halvorsen and Palmquist, 1980 for conversion to marginal effects). Similarly, larger hotels are associated with significantly higher room rates, though the effect of one more hotel room (with a mean of 2,343 hotel rooms per hotel) on log price is very small. Perhaps larger hotels contain more amenities not accounted for in the model.
The most significant coefficient in the entire regression is Square Footage of Hotel Room (with a t-stat >40 in each of the four models), which indicates the importance of room size on price. This finding is extremely important and noteworthy given the paucity of previous investigations which have included room size and lack of a consistent result when it has been included (e.g. Chen and Rothschild, 2010, found no effect). However, it should be noted that the overall impact on log price of one more square foot of hotel room space (with a coefficient of 0.001) is small. Perhaps the paucity of studies with its inclusion reflects a lack of data availability in previous studies.
The results for Time Characteristics are consistent across the four models, with Fridays and Saturdays being associated with higher (log) hotel room prices (see Schamel, 2012). Since weekends are generally more convenient for travel and often include a higher percentage of business, rather than leisure, travelers, we are not surprised by this result. The coefficient for the 2012 Booking dummy is negative, indicating that hotel prices, on average, increased from 2012 to 2017. The cause of this is likely due to inflation and the business cycle. The Las Vegas tourist economy is highly sensitive to the business cycle and was still emerging from the Great Recession in 2012. However, we urge caution in interpreting this result since data were only collected in two years and therefore do not necessarily imply a time trend.
The coefficients for Distance to Strip (negative), Distance to Strip Squared (positive), and Distance to Strip Cubed (negative) presented in model 1 indicate a negative cubic relationship between price and distance, thus confirming hypothesis 1. Similar results occurred for Distance to Center of Strip (model 3), confirming hypothesis 2. These results for distance, distance-squared, and distance-cubed are consistent with Valentin and O’Neill (2019). For the Categorical Distance categories, results clearly show a positive effect of locating very close to the Strip (model 2) or Center of Strip (model 4). As expected, the coefficients decline over the distance specified. However, the negative coefficient in model 2 for the 0.50–0.75 mile interval is counterintuitive. One possible explanation for this is that there are two sets of railroad tracks running near the Strip—approximately in this distance range for a large portion of the Strip—which may be both noisy and unsightly. As such, hotel properties located there may be slightly discounted vis-à-vis properties located beyond the 0.75 mile range. Comparing the two frames of reference, the proximity premium declines precipitously for distance from the Strip but more gradually and over a longer distance for distance from the Center of Strip.
In order to illustrate this graphically, we convert the distance spline coefficients to marginal effects (in percent and dollars—using mean hotel price of US$265.70) for each distance category (see Halvorsen and Palmquist, 1980). The effects are in reference to hotels located beyond 0.75 and 2.25 miles for the Strip and Center of Strip, respectively. We present the results in Figure 8 (for model 2) and Figure 9 (for model 4).
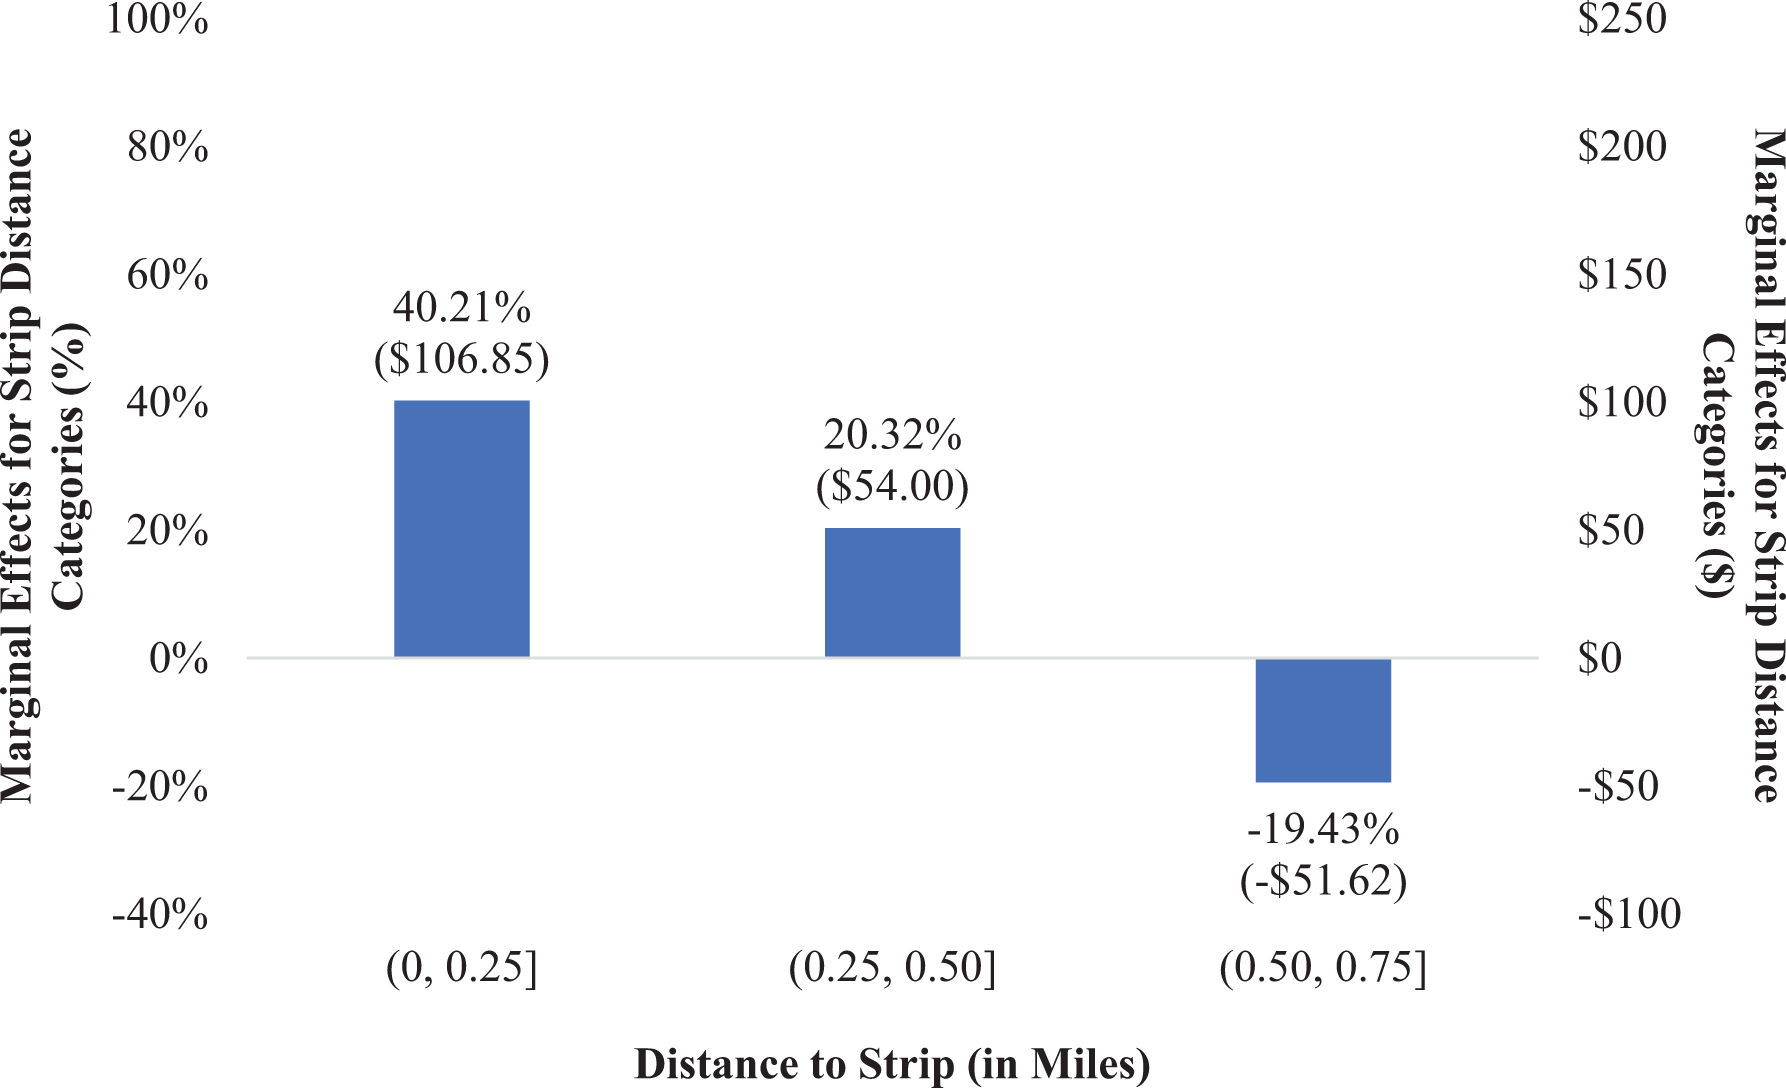
Marginal effects, in percentage of mean hotel price and corresponding dollar amounts, for distance to Strip (model 2) linear spline intervals.
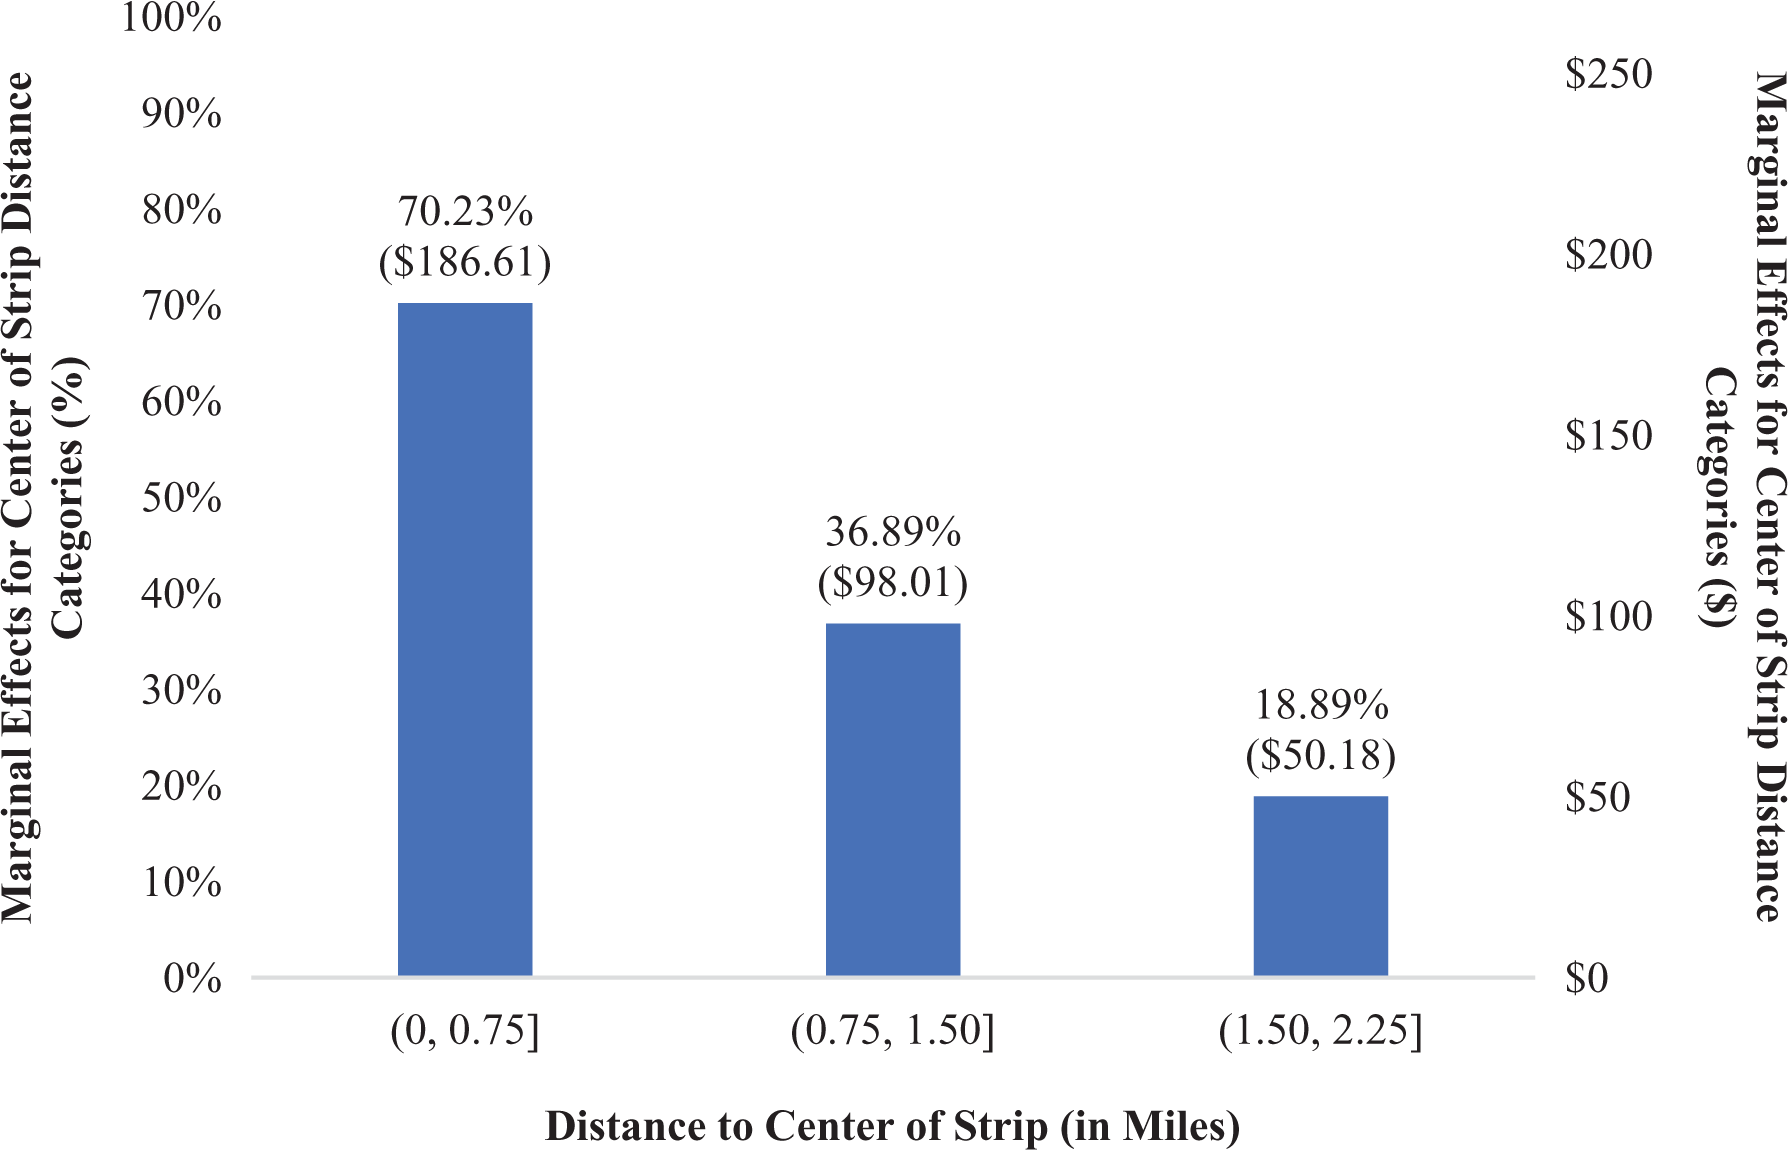
Marginal effects, in percentage of mean hotel price and corresponding dollar amounts, for distance to Center of Strip (model 4) linear spline intervals.
Focusing on the distance from the Strip results in Figure 8, the first quarter of a mile distance from the Strip is associated with a 40.21% (corresponding to US$106.85 for the mean hotel price) higher hotel price than those located beyond 0.75 miles from the Strip. This effect declines to 20.32% and −19.43% for the next two distance increments, respectively. In other words, the Strip premium essentially disappears beyond one-half of a mile all along the Strip.
The proximity premium for the distance from the Center of the Strip is higher, starting at 70.23% (US$186.61 at the mean) in the first 0.75 miles from the Center of the Strip, declining to 36.89% for the next 0.75 miles, then to 18.89% for the next 0.75 miles from the Center of the Strip. These figures are also consistent with the negative, cubic relationship implied (for both frames of reference) by the estimation results for models 1 and 3, but provide more specific detail regarding the incremental effects of distance from the point(s) of reference.
Discussion and conclusions
Previous attempts to investigate hotel price effects have largely used only continuous distance as a control while focusing on other factors such as room-based amenities or hotel characteristics to explain variations in hotel room prices. Lee and Jang (2011; 2012) and Valentin and O’Neill (2019) provide notable exceptions to this, emphasizing the effect of hotel location on hotel prices, with the latter including distance-squared and distance-cubed variables. However, we provide a more specific and intuitive model which isolates the spatial effects in very specific, incremental distance categories (or “splines”). As such, we are able to identify the specific, incremental effect of specific distances on hotel room prices as the hotel room distance increases from the point of reference—that is, the Las Vegas Strip (a linear space traversing essentially the north–south center of the Las Vegas hotel district) or the Center of Strip (a point at the intersection of Flamingo Road and Las Vegas Boulevard). We focus our study on Las Vegas, one of the largest tourist destinations in the world, whose famous Las Vegas Strip is part-hotel row, part-CBD, and part-tourist destination itself. As such, we believe it provides an excellent case study for analysis of the effect of distance on hotel room prices.
We provide a theoretical model which demonstrates the effect of distance on price. The framework includes consumption of hotel goods and all other goods, demonstrating the benefits (in terms of reduced travel costs) from locating near a spatial amenity such as the Las Vegas Strip. Our empirical findings are consistent with the model’s main prediction, namely that individuals would be willing to pay a premium to locate closer to the Strip or Center of Strip in order to reduce travel time costs.
The empirical results presented here are largely consistent with previous investigations. Hotel amenities such as having one king-sized bed, an in-room sound system, a separate shower and bath, and a minibar (for two of the four estimations) are associated with higher hotel room prices. We also find that square footage of hotel rooms—a factor often omitted from prior investigations—is the most statistically significant factor in explaining variation in the dependent variable, though its overall impact on price is small. The highest quality (five-star) hotels are also associated with between 32% and 43% higher room rates. The size of hotel (proxied by number of rooms) is also positive and significant, though the overall effect on price is close to zero. Not surprisingly, hotel rooms reserved for Friday and Saturday night stays are associated with higher prices than those for weekday nights. The 2012 observations are associated with significantly lower hotel prices than those for 2017. We believe this to be due to inflationary and business cycle (i.e. the Great Recession) factors.
In both estimations (i.e. for distance from Strip and Center of Strip), the coefficients for distance, distance-squared, and distance-cubed are negative, positive, and negative, respectively, supporting hypotheses 1 and 2. A major contribution of this study is the inclusion of discrete distance categories or “splines.” We find that the shape of the price gradients presented in Figures 8 and 9 differs slightly, depending on whether we are estimating distance from the Strip (an essentially linear space) or to the Center of the Strip (a point). The marginal effects in Figure 8 imply that hotel prices within 0.25 miles of the Strip experience a 40.21% premium, which disappears after 0.50 miles, becoming negative for the last increment. For the Center-of-Strip estimations, hotels located within 0.75 miles of the Center of Strip are associated with a 70.23% (US$186.61 at the mean hotel price) higher price, on average, controlling for other factors. This effect declines to 36.89% (US$98.01 at the mean) and 18.89% (US$50.18 at the mean), respectively, for the next 0.75 mile increments.
We infer from findings presented here that prospective hotel clients consider more than just room amenities or hotel characteristics when making a hotel purchase. Indeed, revealed preferences demonstrate that proximity to the Strip and Center of Strip matters a great deal for prospective clients in Las Vegas. These results are consistent with prior investigations that have identified positive effects on hotel prices from locating near important locations such as CBDs, beaches, airports, and urban centers, though none of the previous investigations has focused on Las Vegas’ hotel industry or, more generally, on a large transportation artery or central location of a hotel district in this way. We believe our finding for square footage provides a justification for its inclusion in future research of this kind. Further, to the extent that factors included in this analysis play a role in hotel prices and therefore revenue generation for hotels, we believe these specific spatial effects could be used to provide investors, developers, and hotel owners with important information to assist with spatial valuation of hotel properties.
While we are uncertain about the generalizability of these findings beyond this location and the specific time frame included, we believe the land-rent gradients would be similar for other similar situations. We expect that improvements in transportation to the Strip and Center of Strip including greater access to rideshare and rental transportation devices would affect (i.e. flatten) the gradients. While care was taken to avoid any federal holidays or event weeks (per the Las Vegas Visitors Bureau website), we do not know whether the shape of the land-rent gradient implicit in these results might “warp” or even invert at different times of the year or during holidays and events or with seasonality (Lee and Jang, 2012). While these may affect the overall hotel price levels or shape of the gradient, we do not expect these factors to eliminate it completely or to eliminate the contribution of each amenity included in the hedonic regressions, though we leave this for future research.
Footnotes
Declaration of conflicting interests
The author(s) declared no potential conflicts of interest with respect to the research, authorship, and/or publication of this article.
Funding
The author(s) received no financial support for the research, authorship, and/or publication of this article.