
Abstract
Two problems plague the tourism industry: (1) a scheduled group package tour (GPT) can be canceled if the number of reserved passengers does not reach a minimum number and (2) a customer’s request for a scheduled GPT will be denied once the number of reserved passengers has reached its maximum. Neither instance is desirable, because of both results in lost sales. To generate higher profit over the course of a sightseeing season, travel agent managers must schedule GPTs on suitable dates and determine the number of sightseeing buses needed. Viewing this as a portfolio selection problem, this research develops an integer programming model to arrive at an equitable solution. We offer several numerical examples to illustrate the model’s performance and the problem’s characteristics. The results show that the proposed model significantly increases revenues.
Introduction
The source of travel agents’ revenues is mainly from their clients and suppliers. The former’s revenue covers that from selling their proposed tours, the service fees from helping apply for a passport or travel visa, and so on. The latter’s revenue includes commissions from selling airline tickets, hotel rooms, and cruise line tickets. With the development of Internet technology, many suppliers, such as airlines and restaurants, have sold their tickets or room bookings through their own online sales systems or specialized sales websites. As a result, the income of travel agencies from suppliers has significantly dropped. Moreover, the income from agency services is not much, and so most of their revenue depends on setting up their own tours.
The types of tours encompass sightseeing tour, private tour, group package tour (GPT), and various others. Among these tour types, a GPT is a significant revenue source for travel agencies. Statistics show revenue from Package Holidays segment worldwide could reach US$244,933 by 2023, and the market composites an estimated annual growth rate of 6% over 2019–2023 (Statista 1 ). These trending figures provide valuable hints that travel agencies could benefit from this ascending market by selecting suitable GPT departure to attract more potential customers and also arrange the tour buses in advance to reduce the scheduling cost of tour buses to obtain higher profit in such potential Package Holidays market.
A package tour is a traveling product in which a travel agency aggregates a variety of services such as tour guides, sightseeing courses, accommodations, meals, and transportations into a single combined trip at a fixed price. It usually has a fixed travel itinerary, which is usually prearranged. Since it offers a tour guide and a tour bus, a travel agency has a fixed fee for a GPT. Accordingly, a travel agency could incur a loss for a package tour group with insufficient passenger numbers.
To prevent any loss, a package tour contract usually has terms stipulating that tour companies reserve the right to cancel any tour that is underenrolled—that is, a package tour is established when the passengers reach a minimum number preset by the travel agency (How to Organise Package Tours, ACS Distance Education). In addition, since every sightseeing bus has its own seat limit, there is also a limit on the number of passengers depending on the size of the sightseeing bus used. If a tour reaches capacity, then no additional reservations are accepted. Under this situation, those customers who cannot book a reservation or similar tour turn into lost sales.
Travel agencies should carefully choose the departure date of a GPT with a similar itinerary. As most package tours have a peak season, a travel agent can offer as many identical or similar package tours as possible via their website reservation systems with staggered departure dates to generate profit. This strategy enables customers to choose from several package tours according to their personal schedule. However, since similar tours have overlapping customer segments, passengers who sign up for one tour may also be attracted to other tours, and thus competition between similar package tours could arise.
As mentioned previously, a GPT requires a certain number of travelers before going ahead or else it becomes a financial liability. We therefore conjecture that an unsuitable tour portfolio selection may result in lost sales since some tours will be underenrolled and others will be overenrolled. To avoid tour cancellations due to insufficient passengers, travel agencies should consider which package tours to offer to attract customers. This study terms this the tour portfolio selection problem. When tours are scheduled, travel agencies also must determine how many sightseeing buses are needed. If they need more buses than are available, the travel agencies will have to use extra ones from partner companies. A tour will not depart on time if it does not have enough buses. Thus, the selection of a tour portfolio and the number of sightseeing buses should be determined simultaneously.
To design good GPT products, this article sets up a mathematical model to take into account both the GPT selection problem and the bus planning problem. The objective is to maximize total expected sales revenue over a given season. Figure 1 briefly outlines GPT selection and the bus planning process. As shown in Figure 1, we assume that a travel agent initially announces six GPTs. Given that only reserved passengers for GPTs 1, 2, 4, and 5 reach the minimum passenger requirement, GPTs 3 and 6 are canceled and GPTs 1, 2, 4, and 5 will depart as scheduled. At the same time, the travel agent also has to confirm if the company has enough buses to take the passengers and if not needs to rent extra buses from transportation companies.

Framework for the tour selection and sightseeing bus scheduling problem.
The rest of the article is organized as follows. The second section provides the background to package tours. The third section outlines the assumptions made and formulates the problem as a mathematical model. The fourth section describes the solution procedure. The fifth section uses examples to illustrate the proposed model. Lastly, the sixth section presents conclusions.
Literature review
Package tours incorporate several services into a single trip. The European Union Travel Directive, adopted in 1990, describes a package tour as a prearranged combination of at least two of the following: transport, accommodation, and other significant tourist services (Council Directive, 1990). Package tours can be either basic or all-inclusive (Wong and Kwong, 2004), depending on the travel services (Yamamoto and Gill, 1999). Basic tours are usually limited to transportation and accommodation (Mok and Armstrong, 1995). All-inclusive tours consist of a trip paid at a single price in advance, usually covering commercial transportation, accommodation, meals, sightseeing, and sometimes a guide (Morrison, 1989; Sheldon and Mak, 1987). The shortest tours range from a 1-day to a 3-day/2-night short break package, and the longest can be 2-week vacation packages or around-the-world cruises.
Enoch (1996) described package tours as an effective and more cost-effective way to visit travel destinations, but they are not flexible due to their predesigned itineraries. For travel agents and consumers, the advantages of package tours often outweigh their disadvantages. For example, travelers can save money when travel agencies give them a discount from bulk buying. In addition, the travel agencies make all travel, transfer, and lodging arrangements through the tour provider. Instead of separate communications with different service providers, travelers can save much time by making just one call to confirm their package tour. Because of the advantages offered by package tours, many consumers prefer these as their outbound mode of travel. Tour providers target specific customer groups and offer several types of tour, including special-interest, adventure, city or regional, group, and fully escorted tours. People of Asian countries and regions such as Taiwan, Japan, South Korea, Hong Kong, and China commonly utilize GPTs as one of their preferred outbound modes of travel (March, 2000; Nozawa, 1992; Prideaux, 1998; Taiwan Tourism Bureau, 1998; Wang et al., 2000; Wang et al., 2013; Wang and Sheldon, 1995; World Tourism Cities Federation, 2018). These tours have since become important in the global tourism industry as well as for countries’ respective economic development (Seddighi and Theocharous, 2002).
Previous studies of GPT management focus on problems in customer service, consumer behavior, and passenger satisfaction with a large body of literature on GPT services (Wang et al., 2007). Cooper et al. (2008) defined package holiday as “the process of combining aircraft seats and beds in hotels (or other forms of accommodation), in a manner that will make the purchase price attractive to potential holidaymakers.”
Seddighi and Theocharous (2002) proposed a micro-econometric approach to individual travel and provided a framework to analyze the nature, form, and character of holiday decision-making. Theuvsen (2004) studied the issue of vertical integration in Europe’s travel industry. Jin et al. (2012) investigated the impact of selection framework for upgrading and downgrading on consumer choice behavior in identical package tours. Chen et al. (2013) discussed the reasons for poor tourism quality from the perspective of tourism information asymmetry. Alao and Batabyal (2013) indicated that the characteristics associated with the problem of how to sell package tours to tourists include asymmetric information, uncertain demands, and differentiated customers. Taking these three factors into account, they applied the first contract-theoretic analysis so as to provide valuable information between package tour selling firms and buying tourists. Aguiar-Quinatna et al. (2016) analyzed customers’ motivations and perceptions and proposed strategies to improve the competitiveness of traditional travel agencies in Spain.
Modeling customers’ arrival pattern as a stochastic process, Batabyal and Yoo (2010) conducted probabilistic analysis to derive the long-run fraction of lost demand for proposed guided tours during the low season. Davies and Downward (2007) investigated the UK package tour industry, analyzing the dynamics of profitability and market share as well as the role of pricing and non-pricing decisions to elicit the causal process underpinning both pricing and competition. Jørgensen and Solvoll (1996) developed an econometric model to analyze how Norwegian’s income level influences the demand for inclusive tour charters for a particular period of time. Some tour operators are also concerned with providing a single destination inclusive tour or package holidays (Tepelus, 2005).
Several particular studies have also been done on topics related to package tour management, but to the best of our knowledge no studies have looked at tour selection and bus planning. The literature somewhat related to our research is portfolio selection and fleet size models, such as product portfolio management, facility location selection, supplier selection, and investment portfolio selection (e.g. Arabani and Farahani, 2012; Boera et al., 2001; Breaugh, 2009; Chand and Katou, 2012; Cheong et al., 2017; Eichner, 2011; Jiao et al., 2007; Wu and Barnes, 2011).
When evaluating a reward or service for these problems, there is no need to consider whether a predetermined minimum demand or load is reached. For example, in the product portfolio management problem, revenue is counted once a product has been purchased. In the portfolio investment problem, a reward or loss is recognized once an investment is disposed of. In the facility location selection problem, a geographic point’s demand is satisfied if a facility can provide service to the demand point within a specified distance. The personnel assignment problem counts a service by an assigned worker to any customer. From these observations, we can see the difference between GPT selection and other selection issues.
The first difference between the tour portfolio and other portfolio selection problems is that the GPT selection problem has a constraint for the minimum number of passengers, whereas other problems do not. The second difference is that, in most businesses, lost sales are the result of excess demand, while lost sales in the tour industry may arise not only from excess demand but also from insufficient demand—that is, only additional reservations are rejected once the number of reserved customers has reached capacity in other problems. However, all reserved GPT customers are denied the service product if the number of customers for a tour is below the minimum. Since inefficient GPT selection and bus planning may lead to financial losses and a poor corporate image, this problem is of particular importance to the tourism industry. Thus, there exists a research gap in the study of GPT selection and bus planning.
To fill this gap in the literature, our article proposes a mathematical model to investigate the specific problem. Using a mathematical model has the advantages of helping travel agencies make decisions faster and more accurately through cost–benefit analysis of information in the real world. Solutions from the model can offer insights into how travel agencies can employ the selection strategy to schedule their package tours and their sightseeing buses.
Most portfolio selection problems belonging to the group of combinatorial optimization problems and classical mathematical methods often fail to produce optimal or promising solutions, because they are computationally intractable. Meta-heuristics such as genetic algorithms have been successfully utilized to deal with practical combinatorial optimization problems due to their significant computational efficiency (e.g. Cheong et al., 2017; Eihachloufi et al., 2012; Lee, 2018; Luan et al., 2019; Niknamfar and Niaki, 2018). To speed up computation, this article also proposes a hybrid heuristic based on a genetic algorithm to solve the proposed mathematical model.
Methodology
Model formulation
Consider that a travel agency provides GPTs through its traveling booking system throughout a sightseeing season of, say, T periods (days). We consider the number of K trip types of GPTs. GPT type k has travel length Lk
days. For GPT type k, the range of possible departure days over T planning days is from day 1 to day
We assume the potential demand for package tour
When making these decisions, some costs are naturally considered. First, a cost of
Travel agencies should organize sightseeing buses for their tours, which may be their own or partner companies’. The operational cost of a travel agency using its own bus on day t is ut
per bus, and the cost of using a partner company’s bus on day t is vt
per bus with
The model makes several assumptions. First, customers may transfer to other package tours if their preferred tour is not available. Second, package tours cannot be canceled when the number of reserved passengers is greater than the minimum. Third, a tour will be canceled once the number of customers for that tour is below the minimum. Fourth, no customer is allowed to make a reservation once the number of reserved passengers has reached the maximum. Lastly, each bus is used for each tourist activity.
Mathematical model
This study, to maximize the total profit of travel agents over a given season, uses the following model accounting for both the GPT selection problem and the bus planning problem. The profit is the result of marginal profit from selling tour packages minus the processing cost of providing package tours online, and minus the fixed costs of using buses. (A) Marginal profit (B) The processing cost of providing package tours online
A necessary condition for obtaining the revenue of a tour package (i, k) is that it is announced online and it departs on time. If the tour is announced online and the number of reserved passengers,
The binary variable
(C) The fixed costs of using buses
These costs include the fixed costs of using their buses and partners’ buses. By modeling assumption, the number of own buses and partners’ buses used at day t are wt
and zt
, respectively, and the cost of using an own bus and a partners’ bus are ut
and vt
, respectively, thus the costs of using own buses and partners’ buses at day t are

(D) The expected demand for online tour package (i, k)
An online package may absorb customers from other non-online tour packages. Suppose tour package (i, k) is announced online and tour package (j, l) is not online. In this situation, the decision variables of
(E) The number of successfully reserved passengers of the tour package (i, k)
The number of successfully reserved passengers of tour package,

The decision variables are subject to the following constraints:
(F) The determination on whether tour package (i, k) can be successfully departed
We note that the number of passengers for tour package (i, k) departs on time if the expected demand

and

where B is a very large positive number. Equation (3) ensures that
(G) The judgment on whether the partner company’s buses are needed
The number of buses required on day t is the sum of all the tours that cover day t—that is,
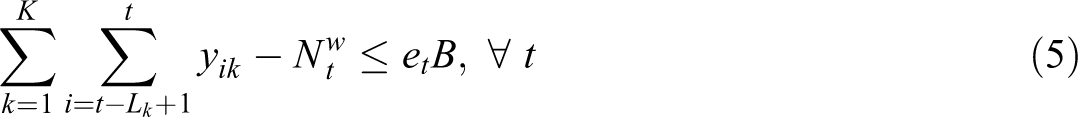
and
where the term
(H) The number of owned buses used
We further note that if the number of one’s buses

(I) The number of partners’ buses used
Partners’ buses are needed if and only if the number of buses on day t,

Equation (8) ensures that
(J) Limitation on available buses provided by partner companies
The number of partner companies’ buses used on day t is defined by zt
. This value cannot exceed the number of available buses provided by partner companies on day t,

The model formulation is to maximize R in (1) subject to constraints (2) to (9). In the formulation, the variables of wt
and zt
are required to be integer decision variables, and et
,
Notation.
Note: GPT: group package tour.
The mathematical model is an integer nonlinear maximization problem. Owing to the computational complexity of the model, optimally solving this problem is computationally prohibitive for large-scale problems. Thus, we develop a heuristic approach based on mathematical programming and genetic algorithm (Michalewicz, 1996). In this study, we use symbol HGA for this approach. The initial population of our solution procedure is described next.
Solution procedure
The concept of a genetic algorithm has been applied to develop solution procedures. Initially, we randomly generate an initial group of M individuals, in which the elements of each individual represent the candidate tour package selection decisions. Here, the mth individual of the population is represented by a binary string
For generating a good initial population, we generate model 2 by replacing variables


Then, we set the initial population of
The solution of an individual is a candidate solution of the original problem. To evaluate the fitness of individual m, the approach determines the decision variables and the fitness value for each individual in the following steps. Step I addresses which tour packages are to be announced. Step II addresses how many own buses and partners’ buses are needed for each individual. Step III addresses how to determine the fitness of an individual. Step IV addresses how to keep and improve the solution quality. The entire calculation process repeats these four steps until a satisfactory solution is obtained or a stop criterion is matched. We refer to these four steps as tour selection, calculation of cars required, fitness calculation, and solution improvement, respectively.
Step I: Tour selection
For individual m, set the temporary value of
Step II: Calculation of buses required
For individual m, after all
Step III: Fitness calculation
For each individual, substitute the obtained decision variables into equation (1) to yield each individual’s fitness.
Step IV: Solution improvement
Solution update: If an individual solution is feasible and is larger than the best objective value found up to now, then we update the best objective value. If the stop criterion is not reached, then the procedure produces the next generation through the four genetic operators of cloning operator, parent selection, crossover operator, and mutation operator (Michalewicz, 1996).
Result
To illustrate the effectiveness of the proposed model for tour portfolio selection and bus fleet planning, we use data provided by travel agent TY, a travel service corporation in Taiwan.
Problem description
TY is formulating a T = 120-day plan to schedule a set of GPTs on its website. There are K = 4 types of GPTs considered in this plan. For the four types of GPTs, the minimum passenger requirements are respectively set at 10, 12, 15, and 15; the maximum passenger limitations are set at 20, 25, 30, and 30; and the trip lengths are set at
In total, there is a large number of possible tour combinations that the company can provide online, but some tours will be underenrolled. For increasing the possibility that scheduled tours can depart on time, the company decides to make its tour portfolio selection decision from among the possible schedulable tours. Table 2 presents the estimated demand for each schedulable tour.
Potential demand dik .

In Table 2, the symbol
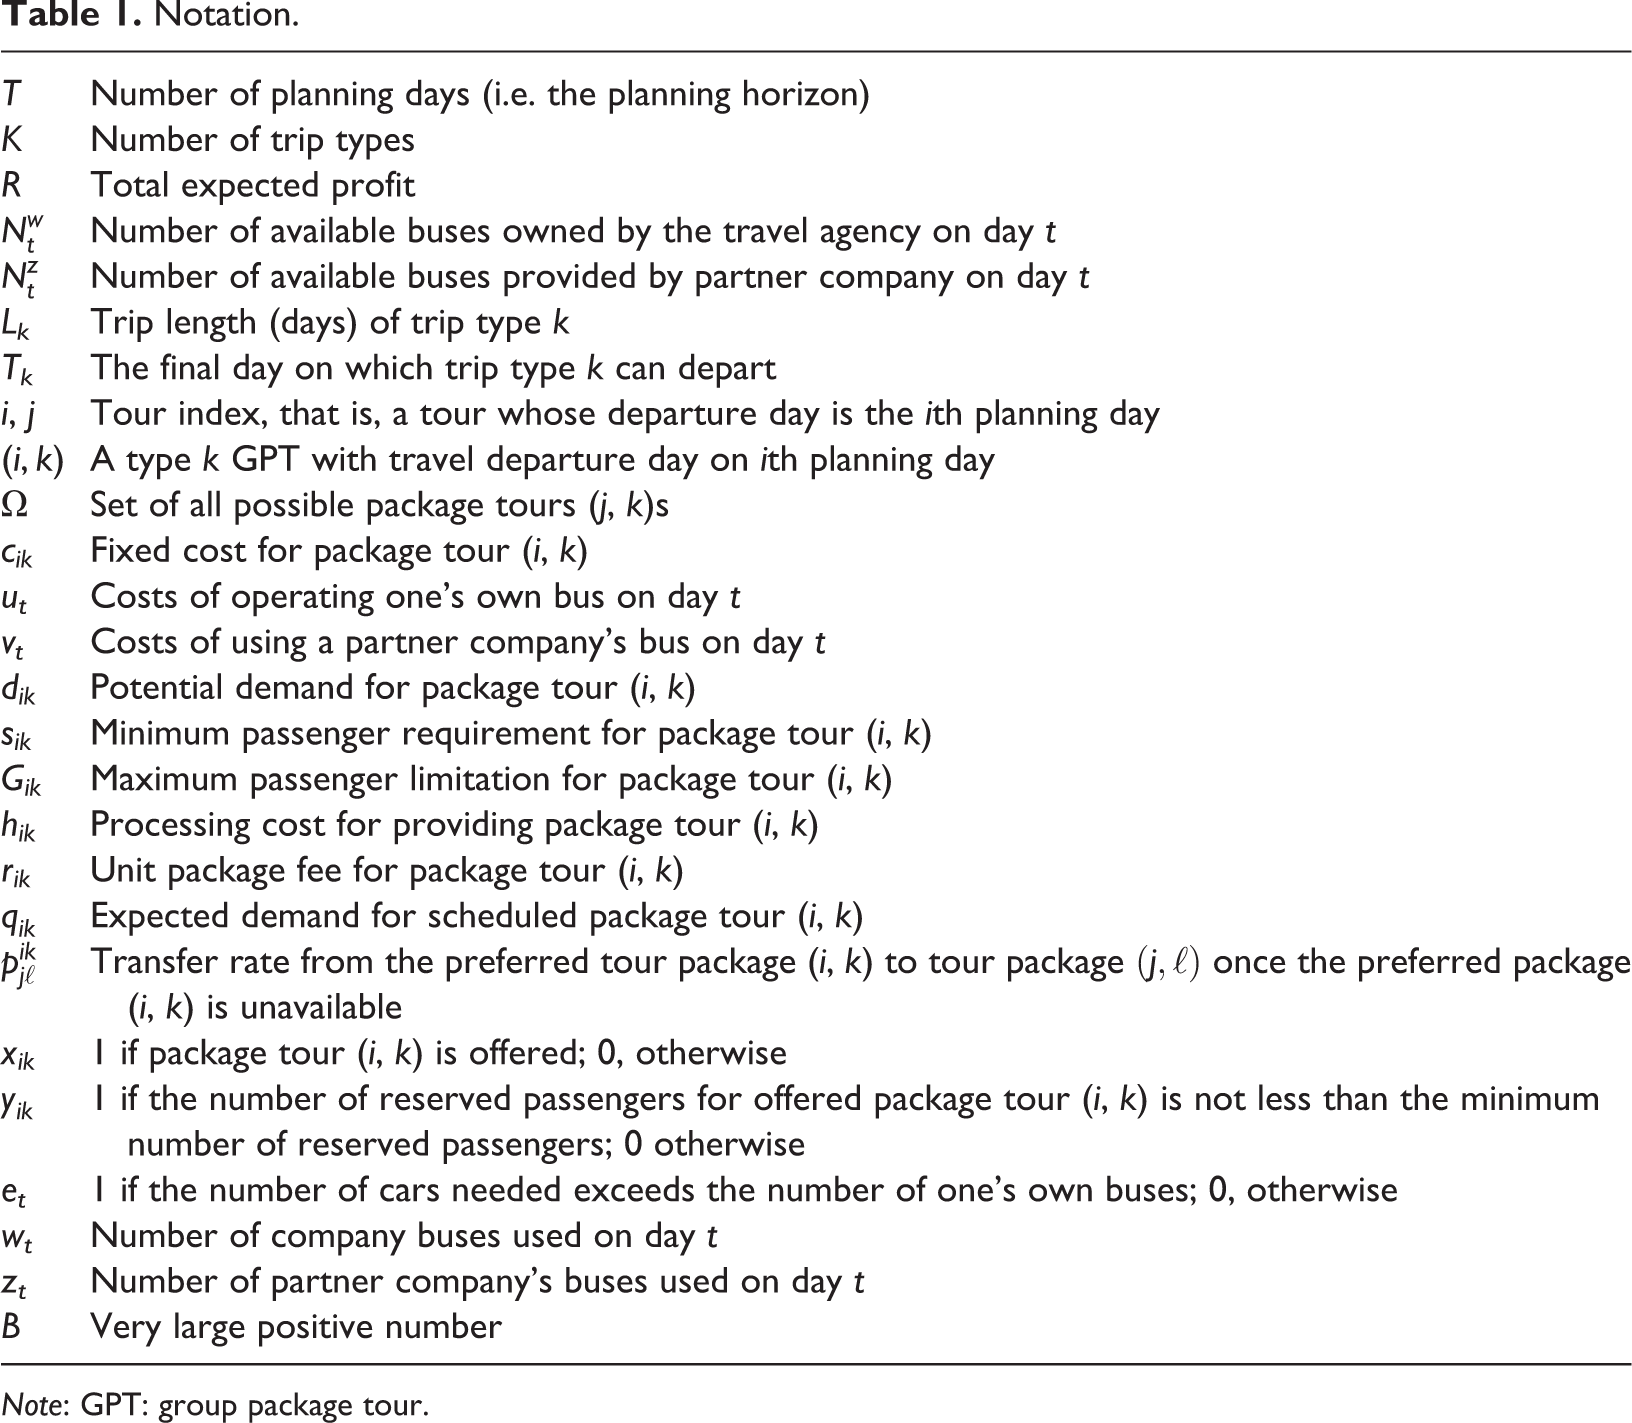
Tour fee rik.
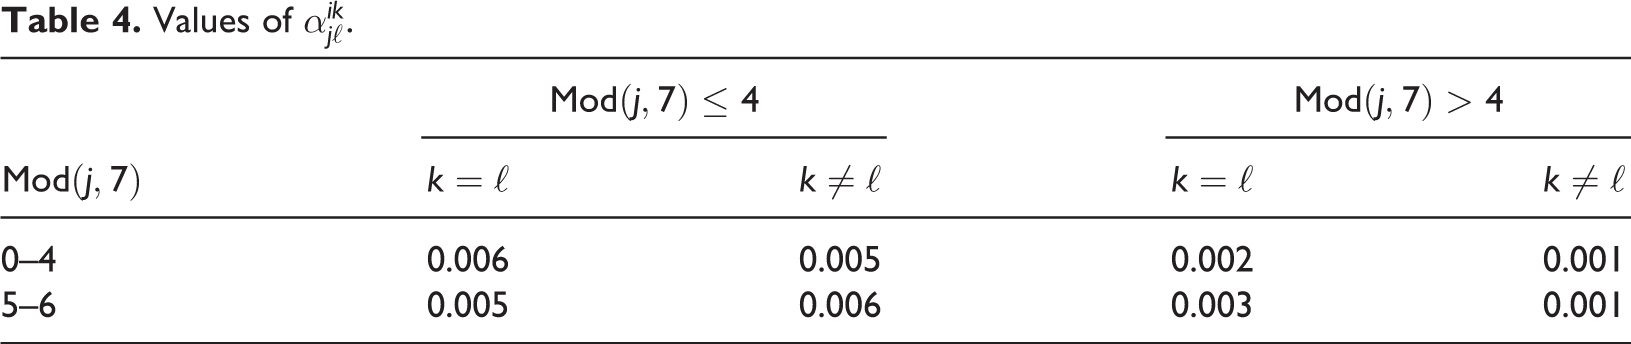
Values of
The operational cost of using one’s own buses on day t is
Design of test problem
We refer to the data described in the previous subsection as our basic data set. The available own buses, the cost for using a partner’s buses, the potential demand for package tours, and the transfer rate from the preferred tour package to alternative tour packages may change over time along with available partners’ buses. For example, the difference in demands between peak season and off-season is 40%. Facing different seasonal demand, travel agencies may want to know how this impacts demand for airline seats and demand for buses. From the basic data set, we generate five problem types, each with seven testing cases, to test the performance of the proposed hybrid heuristic approach and to analyze the impact of various parameters on the decision outcomes.
We set planning day T for the five problem types at 10, 30, 60, 90, and 120, respectively. To analyze the impact of parameters
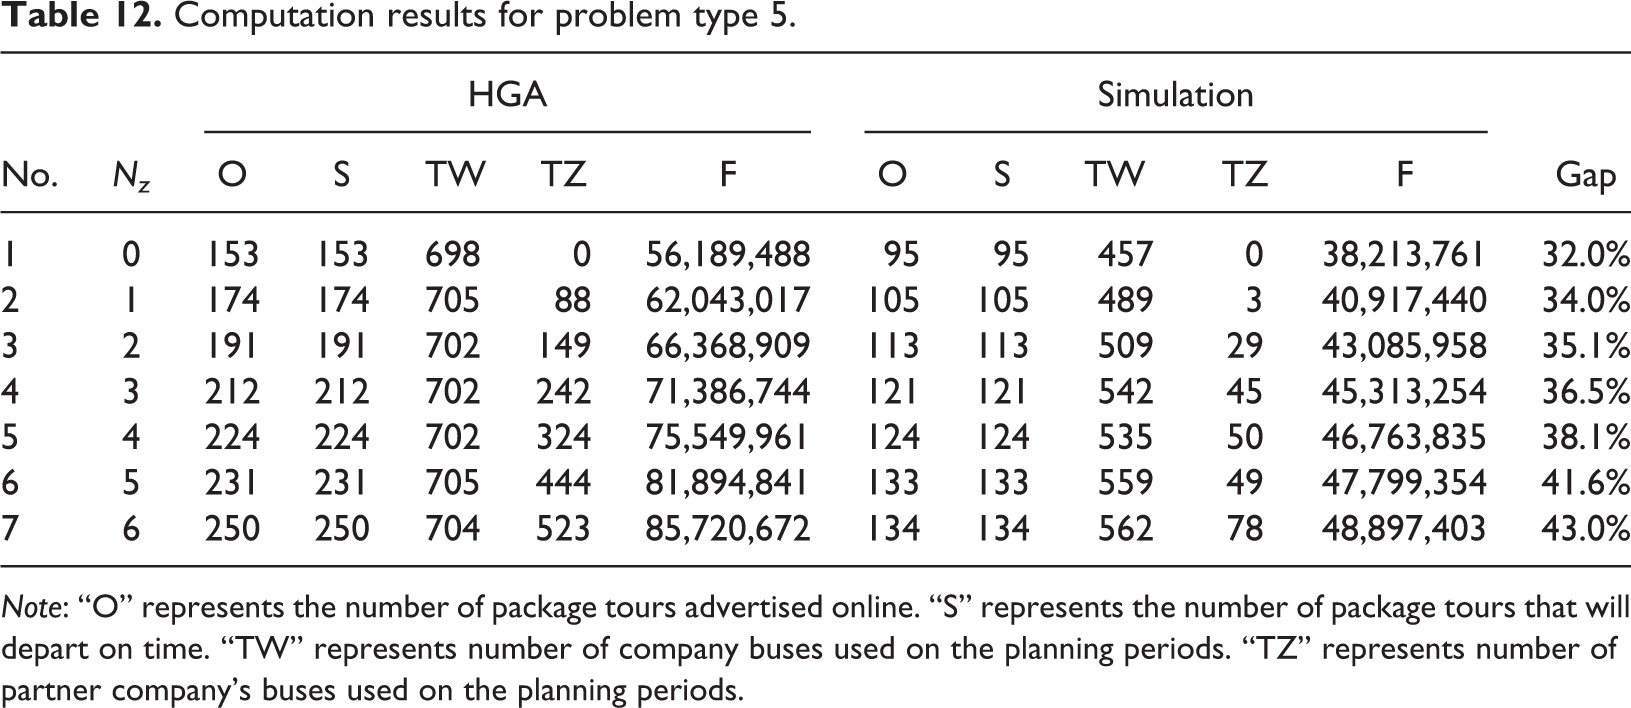
Moreover, to investigate the performance of our proposed portfolio selection approach, we compare the results of problem type 5 of our approach with those by the random portfolio selections. This approach generates tour portfolio and bus schedules by the best feasible solutions from the one million simulation experiences. We refer to it as the simulation approach.
Performance of the proposed method
To evaluate the performance of the proposed approach, we also use Lingo solver 12 on the test problems. Lingo solver is an optimization modeling software and has the ability to identify whether a feasible solution is a global optimum. Below, we abbreviate HGA and LS respectively for the proposed heuristic and Lingo solutions, employ the symbol LH to express the percentage gap between HGA and LS, and express the formula of LH by
Solution quality
The proposed heuristic can find feasible solutions for all test cases in all problem types, but Lingo can only find feasible solutions for all testing cases in problem types 1–4 and cannot find feasible solutions for all test cases in problem type 5 in 3 h. Table 5 presents the computational results of problem type 1 for HGA and LS. The computational results are confirmed to be optimum by Lingo solver. We see that HGA can also find the optimal solution for problem type 1, indicating that it has the ability to find global solutions.
Computation results for problem type 1.
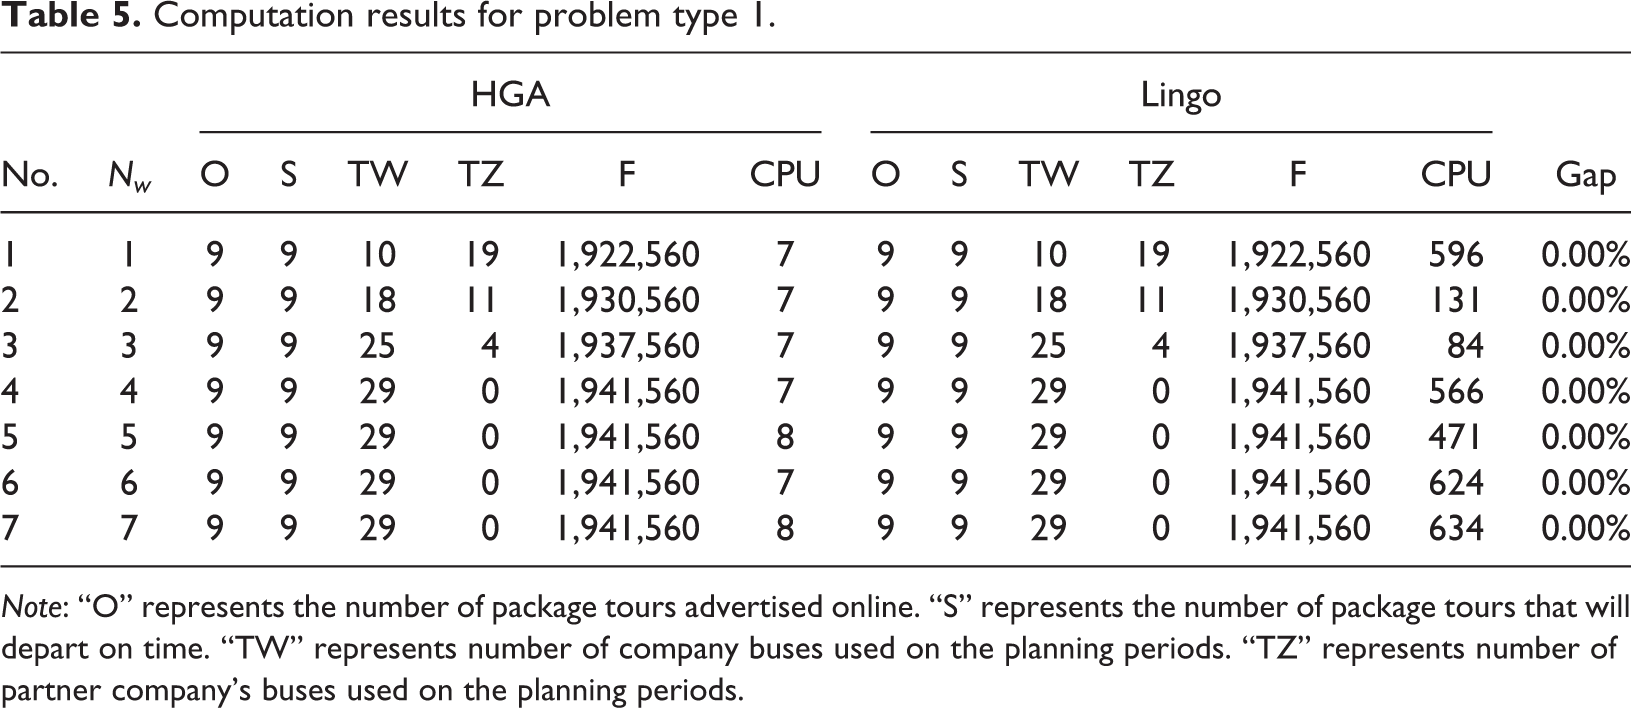
Note: “O” represents the number of package tours advertised online. “S” represents the number of package tours that will depart on time. “TW” represents number of company buses used on the planning periods. “TZ” represents number of partner company’s buses used on the planning periods.
For test cases of problem type 2, Table 6 shows that the solutions obtained by HGA are better than or on par with the solutions of LS. For the test cases of problem type 3, Table 7 also shows that the solutions obtained by HGA are all better than the solutions of LS. The test cases in problem type 4 are larger-scale problems than those of problem types 2 and 3. For solving problem types 2 and 3, the degree to which solutions of HGA are better than those of LS is not significant. However, for solving problem type 4, the degree to which solutions of HGA are better than those of LS becomes much more significant.
Computation results for problem type 2.

Note: “O” represents the number of package tours advertised online. “S” represents the number of package tours that will depart on time. “TW” represents number of company buses used on the planning periods. “TZ” represents number of partner company’s buses used on the planning periods.
Computation results for problem type 3.
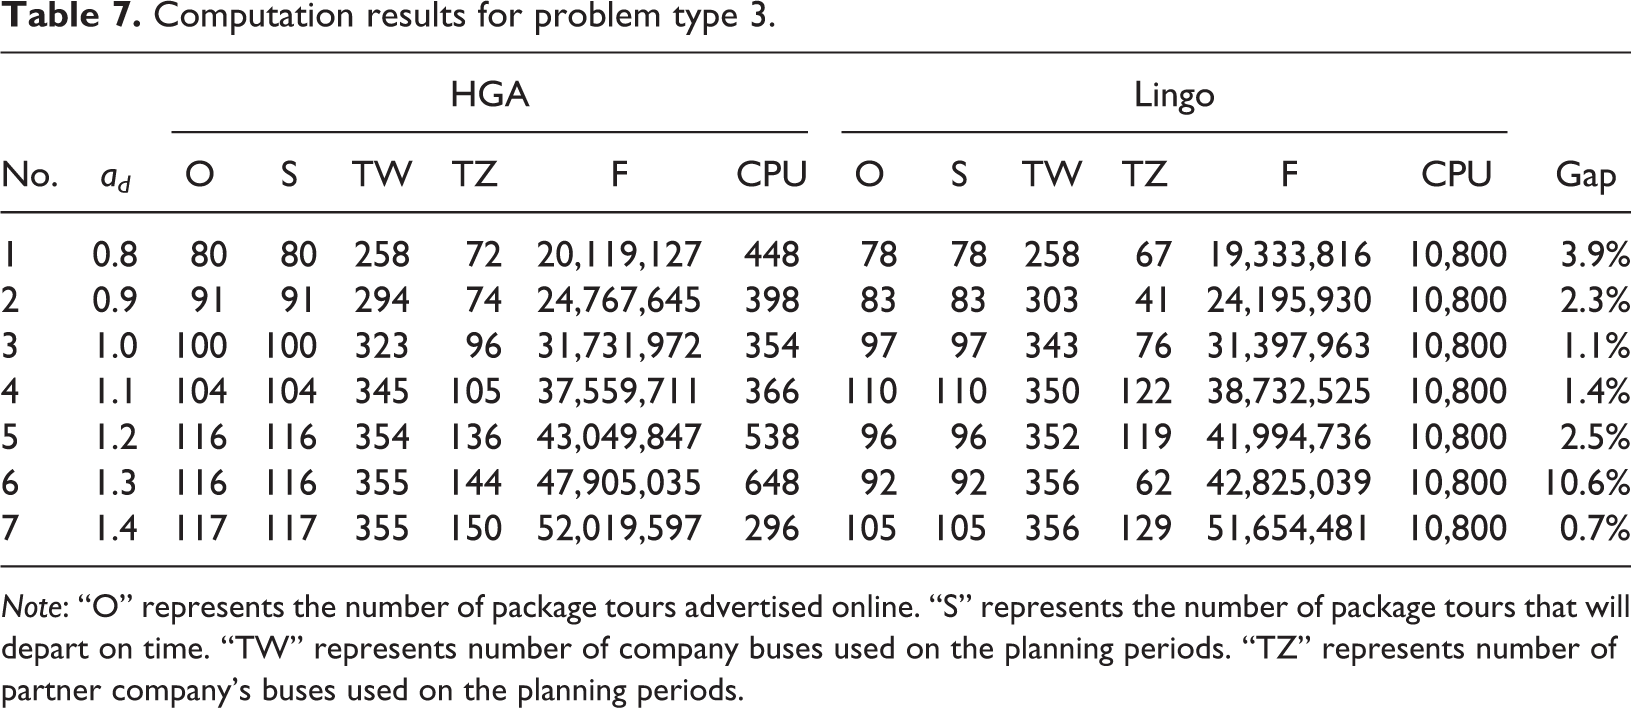
Note: “O” represents the number of package tours advertised online. “S” represents the number of package tours that will depart on time. “TW” represents number of company buses used on the planning periods. “TZ” represents number of partner company’s buses used on the planning periods.
Computational time
The computational results show that the computational time required by HGA increases slowly as the size of the problem enlarges. However, the computational time required by LS increases rapidly with the size of the problem. According to the above results, we conclude that HGA solutions are superior to Lingo solutions in terms of solution quality and computational times. Therefore, we state that the HGA approach is a viable compromise for other types of problems.
An illustrative example
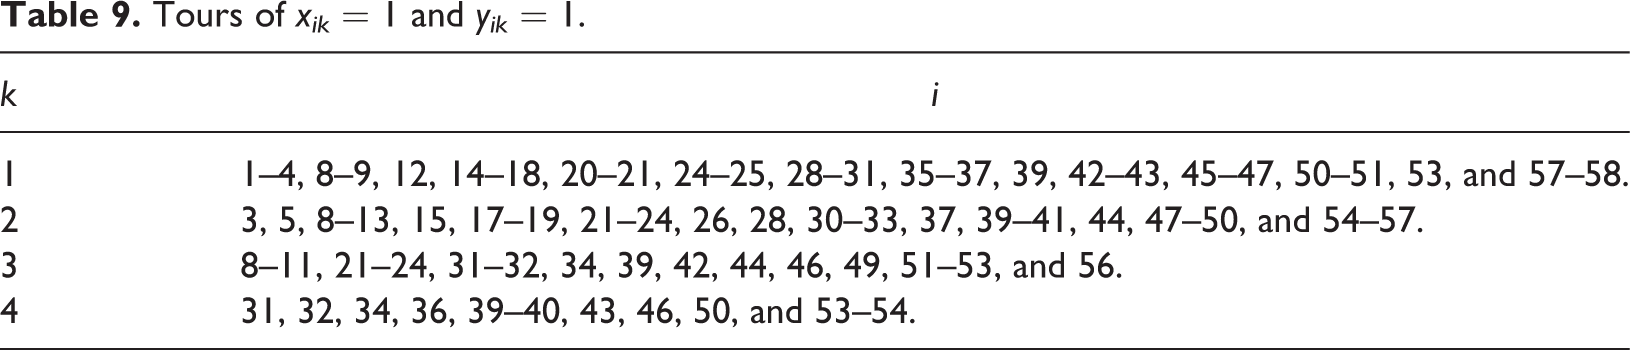
We take the computational result of case 3 in problem type 3 to illustrate the application of the proposed model. The total expected profit is NT$31,731,972 (just over US$1 million). In this case, 100 out of 225 available tours are advertised online. Table 8 shows the online proposed tour schedules and the expected realized tour schedules at various times for days 1–40. We can find that the advertised tours on this table are expected to depart on time. Table 9 summarizes the values of the proposed tours
Time schedule for departure tours on days 1–40 of case 3 of problem 3.
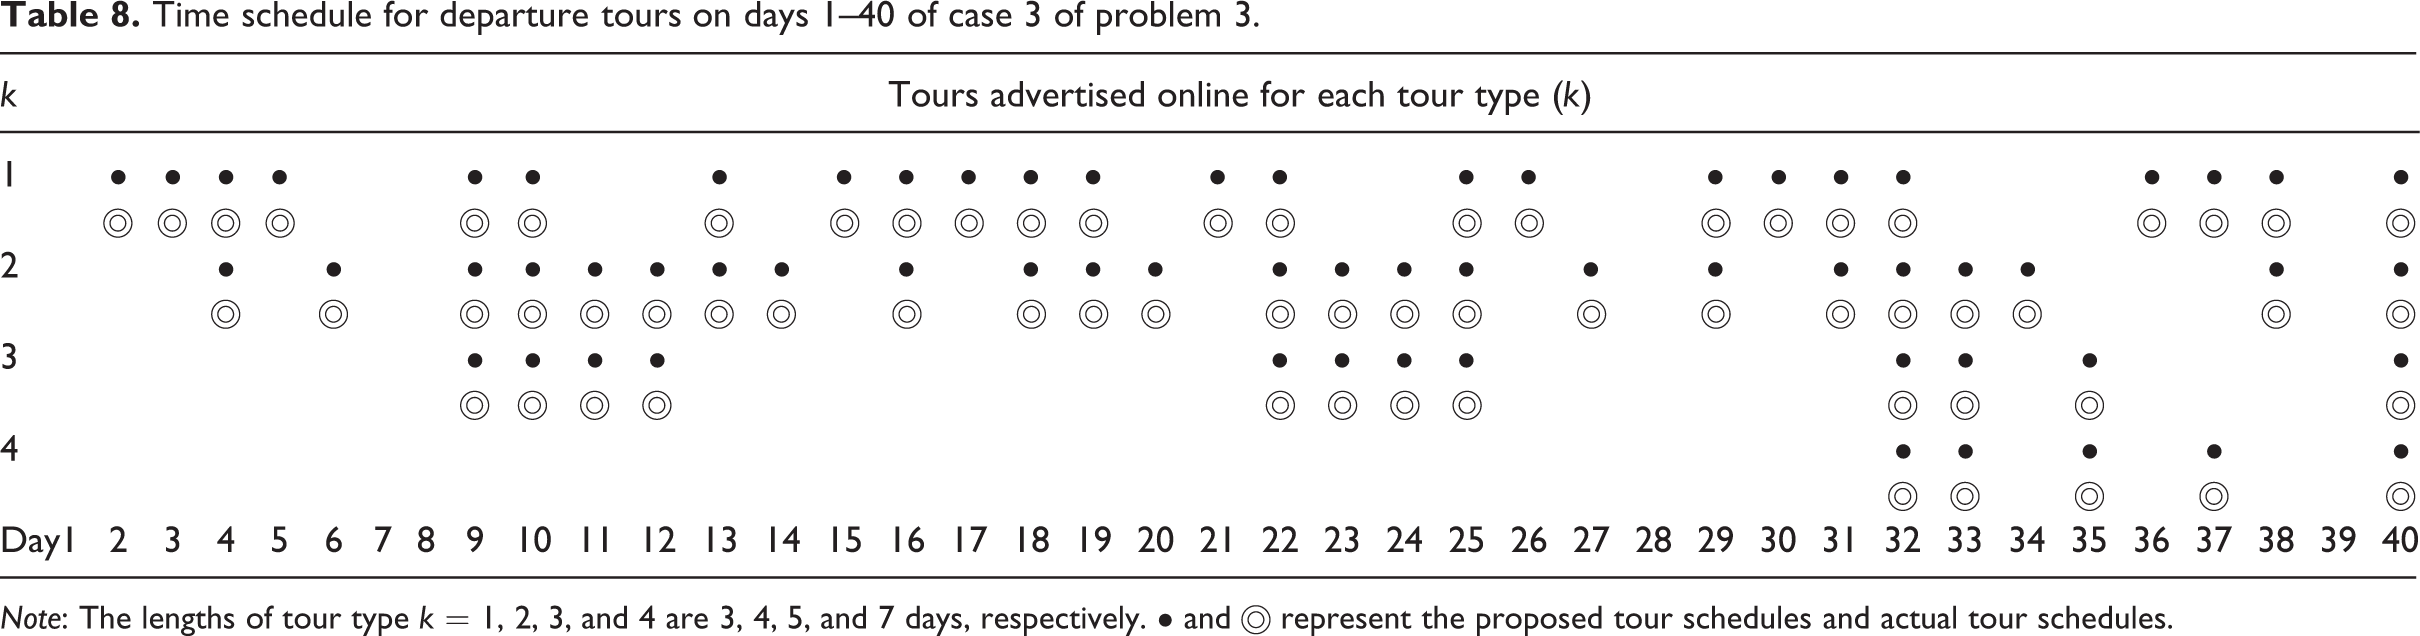
Note: The lengths of tour type k = 1, 2, 3, and 4 are 3, 4, 5, and 7 days, respectively. • and  represent the proposed tour schedules and actual tour schedules.
Tours of xik = 1 and yik = 1.
The total number of buses needed on day t, Ht
, is the number of owned buses used on day t,
Values of Ht , wt , and zt for case 3 in problem type 3.

Basically, the company prefers to use its own buses and will use its partners’ buses when its buses are insufficient. According to this table, we find that the number of cumulative frequencies of tour buses used over the 60 planning days is 414 times, among which 323 times are from its own cars and 96 times are from partners’.
Discussion
Sensitivity analysis
This subsection reports the impacts of parameters
Computation results for problem type 4.
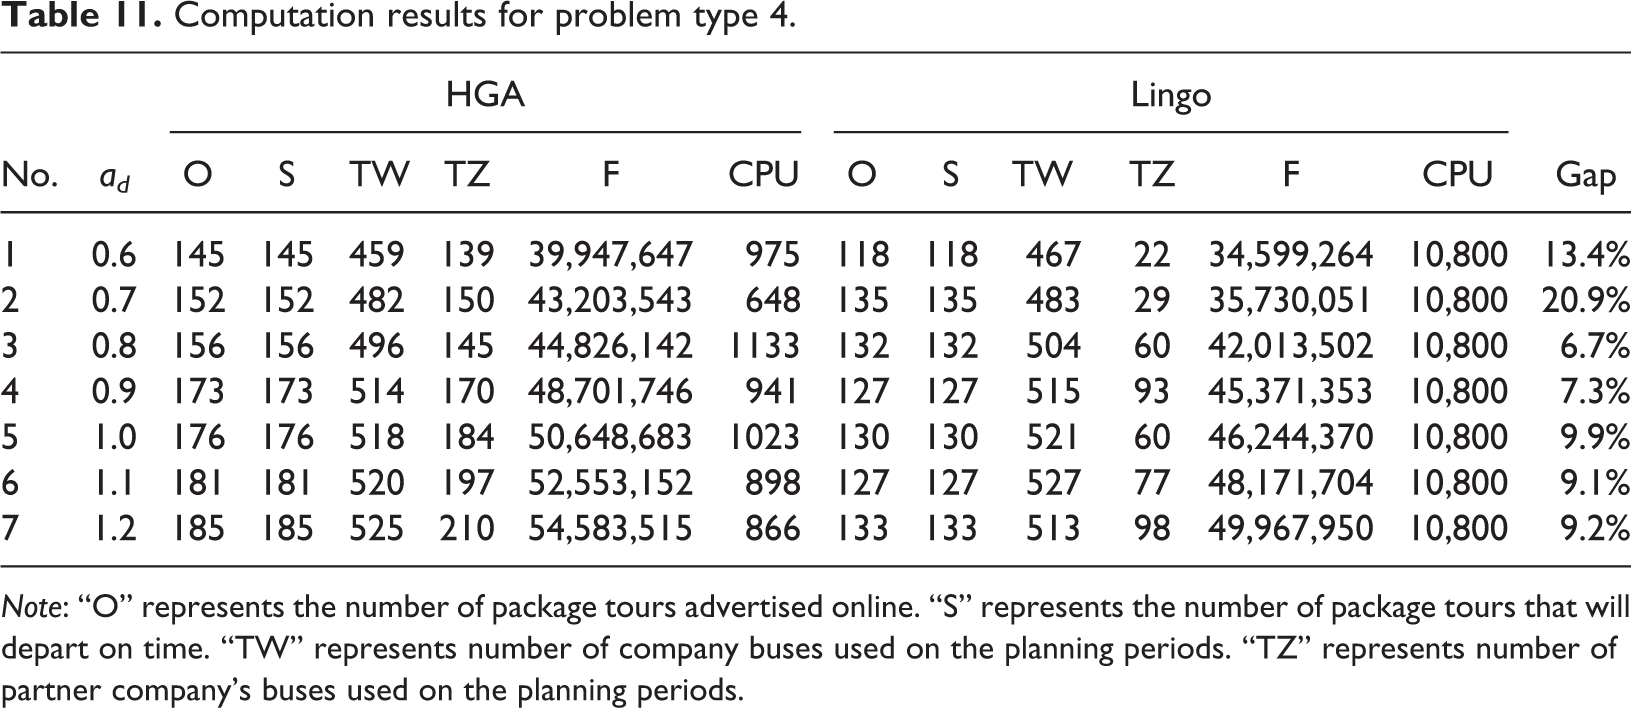
Note: “O” represents the number of package tours advertised online. “S” represents the number of package tours that will depart on time. “TW” represents number of company buses used on the planning periods. “TZ” represents number of partner company’s buses used on the planning periods.
Computation results for problem type 5.
Note: “O” represents the number of package tours advertised online. “S” represents the number of package tours that will depart on time. “TW” represents number of company buses used on the planning periods. “TZ” represents number of partner company’s buses used on the planning periods.
There is an impact of available own cars on the results. From Table 5, we see that the number of package tours advertised online (O) and the number of package tours that will depart on time (S) are not influenced by the number of own cars. The reason is that the company can use not only its own buses but also partners’ buses to support its scheduled tours. For example, the company can use 11 partner buses when it has only 2 own buses to support the 9 scheduled tours. Columns 5 and 6 show that the frequencies of its own buses used increase, and that the frequencies of partners’ buses used decrease with a rise in the number of its own buses. The table also shows as long as there are three cars that this is sufficient to supply the number of buses required for a 10-day plan, and the rest of the buses can be provided by partner companies for use.
Table 6 lists the impacts from the cost of using partners’ buses on the computational results. Theoretically, the number of partners’ buses used does not increase with the cost of partners’ buses. From column 12, we see that Lingo’s results are consistent with logic. However, results from HGA show that the number of partners’ buses used remains unchanged even if the cost of using a partner’s bus increases from NT$3000 to NT$9000. The reason is that using partners’ additional buses can still generate profits over the unit cost range from NT$3000 to NT$9000.
Table 7 presents the impact from demand on the computational results. The values of the computational results from the HGA approach are in columns 3–8 of Table 6. From column 7 of Table 7, with potential demand increasing from
Table 11 shows the impacts of transfer probabilities on the computational results. From column 7 of Table 11, with the transfer probabilities increasing from
In addition, we see from column 4 that all scheduled tours are also expected to depart on schedule. From the computational results, we conclude that the tour portfolio selection and bus planning decisions should be adjusted when transfer probabilities fluctuate. From column 7 of Table 11, with the transfer probability increasing from
Table 11 lists the impacts from available partners’ buses on the computational results. From column 7 of Table 12, with available partners’ buses increasing from 0 to 6, we find that the total expected profit increases significantly from NT$56,189,488 to NT$85,720,672, the number of scheduled tours increases from 153 to 250, and the cumulative frequency of using one’s own buses remains nearly unchanged. However, the partners’ buses used increases from 0 to 523 as the number of available partners’ buses increases from 1 to 6 per day. From the computational results, we conclude that seeking partner companies for support in regard to the resources of tour buses can increase a company’s profit.
We also find that bus usage in the simulation method is much less than in the proposed mathematical method, and that the expected profits obtained by the simulation approach are all less than those from our proposed method. From the last column, we see that the expected profit of the proposed method is on average 30% higher than the profit of the simulation approach. These results reveal that the simulation approach is obviously not as good as the proposed method in terms of the usage of bus resources and tour selections. Thus, we conclude that the tour portfolio selection and bus schedule decisions by the proposed model herein are superior to those of the simulation approach.
Conclusion and practical implications
This article examines the tour portfolio selection and sightseeing bus planning problem for the travel service industry, in which travel agencies apply the minimum passenger requirement and maximum passenger capacity. Portfolio selections have been applied in areas such as investments, projects, bioprocesses, facility design, capacity sourcing, and research and development portfolio. However, the minimum passenger requirement and maximum passenger capacity have not yet been considered in the literature. These requirements are applied in GPTs.
The problems faced by travel agents include what package tours should be announced online, how many of the company’s own sightseeing buses are needed each day, and how many of partner companies’ sightseeing buses are needed each day. A simple approach to design the tour portfolio selection is let all possible tours schedule online. However, this strategy may cause a problem whereby the available buses cannot support the GPTs with sufficient passengers. To avoid this situation, a travel agent should simultaneously plan the tour portfolio selection and bus fleet size decisions to improve its profits. A GPT usually is composed of trips over several days. GPTs with overlapping dates will compete for limited bus resources, making it difficult for travel agent managers to control fluctuating demand and complex production characteristics when developing tour selections and bus schedules. As shown in problem type 5, the best profits obtained by performing one million simulations are unable to achieve the 70% effect of the mathematical programming solutions. It is reasonable to conclude that the decision-making results based on experience will be difficult to achieve good performance.
Taking both factors into account, this article has simultaneously explored tour portfolio selection and bus fleet size problems, presenting both an integer nonlinear programming model and a hybrid heuristic solution. Decisions include what package tours should be announced online, how many of the company’s own sightseeing buses are needed each day, and how many of partner companies’ sightseeing buses are needed each day. In addition, the travel agencies are able to calculate how many buses they can provide each day for partner companies’ use.
We design herein a series of experiments whose data come from a travel service corporation in Taiwan to test the model. The computational results show that the proposed approach arrives at satisfactory solutions, which are better than those by the well-known commercial software, Lingo solver. In addition, the expected profit obtained from our model outperforms the simulation methods by a wide margin of profit improvement. Sensitive analysis also shows that the proposed model has the following abilities: (1) the decisions produced by this model give priority to the use of self-vehicles; (2) for the use of partners’ buses, it can adjust the tour portfolio selection and bus planning decisions according to fluctuations in demand; and (3) the proposed model can efficiently use bus resources which helps obtain remarkable profit improvement versus any arbitrary planning. These advantages can assist travel agents in planning a good tour and bus schedule.
Limitations and future research
This article has the following limitations. For example, there is only one type of tour bus in the GPT planning problem. In practice, a travel agent may have different types of buses for tours of different sizes. Cooperation among travel agents from different companies is not considered herein. Moreover, we assume in this article that a tour will be canceled when the number of reserved passengers for that tour is below the minimum. In practice, travel agents may cooperate with others by merging their passengers onto a single tour. For a model with several types of buses, the proposed approach has to be modified.
As mentioned beforehand, the numerical example in this study is based on data from a single travel agent, TY, instead of multiple travel agents. One major reason is that the information provided by travel agents is considered to be confidential, which is usually only available for internal use and hence rarely open to the public. We contacted many travel agents and only TY was willing to help provide data, because we have used its services several times in the past 10 years and promised that all data obtained from it would only be used for research purposes and not for commercial use. However, it is worth noting that the model proposed and the numerical example performed in our study can help both Taiwanese travel agents and travel agents in different countries when making decisions over tour selection and sightseeing bus schedule for GPT planning.
Footnotes
Declaration of conflicting interests
The author(s) declared no potential conflicts of interest with respect to the research, authorship, and/or publication of this article.
Funding
The author(s) received no financial support for the research, authorship, and/or publication of this article.