




Abstract
Turkey, an emerging economy, ranked 8th among the most visited countries in the world in 2017. Given the importance of the tourism sector in Turkey, it is of utmost importance to identify the dynamics of tourism demand to achieve sustainable tourism. The aim of this article is, therefore, to explore the demand-side factors that affect the number of international tourist arrivals to Turkey. To this end, an augmented gravity model has been employed to analyze the factors affecting the number of international tourists visiting Turkey from the top 25 originating countries from 1998 to 2017. The results show that the gravity model is very effective in explaining the tourist arrivals to Turkey. Empirical findings suggest that per capita income of both origin country and Turkey, relative exchange rate, and globalization positively affect the demand for tourism, while it is negatively affected by consumer price index, violence/terrorism, household debt level, and bilateral distance between Turkey and the origin country.
Introduction
There is a consensus that tourism may play a vital role in the achievement of sustainable development goals through economic and environmental benefits (Davidson and Sahli, 2015; Kapera, 2018; Lee and Jan, 2019; Saarinen et al., 2011; Suriñach and Wöber, 2017). The tourism sector helps to create foreign exchange incomes, provides job opportunities, and stimulates service sector investments in developing countries (Xu et al., 2018). In this direction, the role of tourism in the long-run economic growth equilibrium and its contribution to the growth transition are explicitly revealed by Fossati and Panella (2000) and Brau et al. (2008) in the context of sustainable development. Moreover, Brau et al. (2008) analytically indicate that specialization in the tourism sector creates higher growth performance along the transition path and helps to close the technological gap between countries. This view is compatible with the tourism-led growth hypothesis that has been empirically investigated and verified by various studies (Balaguer and Cantavella-Jordá, 2002; Fonseca and Sánchez-Rivero, 2020; Perles-Ribes et al., 2017; Sokhanvar et al., 2018; Tang and Tan, 2013).
Considering sustainable development targets, it should be underlined that tourism contributes to decreasing environmental degradations as well, as long as it is well managed (Hall, 2019; Higgins-Desbiolles, 2010; UNWTO, 2017). Composition effect, one of the theoretical underpinnings of environmental Kuznets curve (EKC) hypothesis introduced by Grossman and Krueger (1991, 1995), stresses that pollution will decrease as the share of service sector increases due to the fact that less CO2 emissions and wastes are produced in this sector than manufacturing’s (Liobikienė and Butkus, 2019; Ulucak and Bilgili, 2018). On the other hand, there is a growing environmental awareness especially in rich countries whose citizens are potential visitors of tourism destinations since they are expected to spend more currency (Baysan, 2001; Chan and Wong, 2006; Itsubo et al., 2018). Thus, one might claim that tourism is one of the most critical sectors for countries that are potential attraction centers in terms of tourism activities to achieve sustainable growth.
Tourism sector developments can be an alternative tool for policy authorities to monitor economic situations since it enables them to see important backward and forward linkages in an economy (Narayan, 2004). It also increases international connectivity and is used to measure social and interpersonal globalization (Gygli et al., 2019). In this sense, interactions between different cultures and societies spread over the world and this may create a feedback effect on the demand toward tourism destinations in visited countries (Cohen, 2012; Song et al., 2018). These global improvements in socioeconomic and cultural dynamics get people to tend to visit developing countries and increase international tourist arrivals (Song et al., 2019).
On the other hand, various fluctuations and cycles that have considerable influences on economies may occur in this sector due to internal and external developments, and they steer the sector and economic development (Erkuş-Öztürk and Terhorst, 2018). Therefore, observing the changes in determinants of tourism demand and putting required actions into practice are of importance for policymakers especially in countries with high tourist arrivals. To this end, tourism demand forecasts have become prominent, and many studies have focused on investigating tourism demand function of destinations (Adeola and Evans, 2019; Bassil et al., 2019; Dogru et al., 2017; Narayan, 2004; Song et al., 2019). Number of international tourist arrivals, tourism receipts, and number of nights in accommodation are the main measurements of international tourism demand which are primarily determined by per capita income, exchange rate, consumer price index (CPI), cost of transportation, and travel distance (Song et al., 2019). Terror attacks also lead to considerable deviations in international tourism demand (Drakos and Kutan, 2003; Samitas et al., 2018). In this respect, one should take such social threats into consideration in the investigations of tourism demand determinants.
This study aims to estimate the determinants of tourism demand in Turkey, which is in the top 10 most visited countries in the world since it has experienced substantial changes in terms of its tourism indicators. According to current statistics of the World Tourism Organization (WTO), international tourist arrivals have reached 37.6 million by increasing 7% in 2017, which has been the highest growth rate in 7 years since 2010 (UNWTO, 2018). This process does, however, not have a stable trend in each country nor profitability, either. For instance, this process has been more volatile in Turkey. It experienced the most substantial change in tourist arrivals in 2017 with an increase of 24% that is the highest rate of increase in the top 10 most visited destinations, and it moved up two steps from 10th to 8th place among the top in arrivals. Turkey often enters the list of top 10 visited countries, but interestingly it cannot find itself a place among the top in receipts (UNWTO, 2018). Even so, it is a leading country with 13th highest receipts in 2017 for the global tourism sector and worth studying. Turkey is a good case to study the effects of terror attacks in empirical investigations of tourism demand since it has been under the threats of various terrorist organizations. There has been a dramatical increase in terror attacks since 2010, and hundreds of bombings and armed assaults occurred in Turkey during the years 2010–2017 (see Global Terrorism Database).
This study is expected to contribute to the existing literature in several ways. First, we investigate the impacts of terrorism within an augmented gravity model. The second contribution is the employment of globalization indicator to observe how interactions of societies influence tourism development in Turkey. For this purpose, the KOF globalization index originally developed by Dreher (2006), Dreher et al. (2008) and recently revised by Gygli et al. (2019) is used. Understanding the role of globalization on tourism demand for the case of Turkey is also important since the globalization trend of Turkey has been over the world’s globalization trend since the 1970s. As a third contribution, the study controls the debt level of consumers and money supply since income level alone may not be enough to understand consumer behavior for tourism demand. So, the study draws a more comprehensive perspective by including new variables into the traditional gravity approach. A fourth contribution is that cross-correlations between countries are taken into account in empirical estimations by using second-generation panel data techniques so that more robust estimations can be revealed (Baltagi, 2015). Otherwise, efficiency loss occurs in panel estimations, and it invalidates t and F statistics based on standard variance-covariance estimators (Baltagi et al., 2012).
Different from the current literature widely discussed in the second section, this study sheds light on the determinants of tourism demand by employing annual data of 25 top visiting countries (Russia, Germany, Iran, Georgia, Bulgaria, United Kingdom, Ukraine, Iraq, Netherlands, Azerbaijan, Saudi Arabia, Greece, France, Romania, Belgium, Syria, Kazakhstan, Israel, United States, Poland, Sweden, Austria, Jordan, Denmark, and Kuwait), meaning that determinants for destination chose of 25 countries’ citizens are considered through macro-level data. In this respect, this study provides useful implications in understanding tourism demand from a broader perspective not only for Turkey but also for other tourism destinations as well as extending the current literature. The remainder of the study is organized as follows: The literature on tourism demand is reviewed in the second section. Subsequently, model, data, and econometric techniques are introduced in the third section. Estimation results are tabulated and discussed in the fourth section. Finally, the study is concluded.
Literature review
Tourism demand is an important research subject that is related to economic, cultural, political, and social aspects. The interest in determining and classifying tourism demand components has been increasing over the past few decades. In recent studies, the gravity model has been used for modeling and describing international tourism demand to determine its main components and features by illustrating tourism flows as trade of service (Adeola and Evans, 2019; Algieri, 2006; Eilat and Einav, 2004; Fourie et al., 2019; Lorde et al., 2015; Pintassilgo et al., 2016; Saayman et al., 2016; Seetanah et al., 2010; Xu et al., 2018). Other studies mostly estimate the determinants of tourism demand through linear or nonlinear models (Akis, 1998; Dogru et al., 2017; Dritsakis, 2004; Samitas et al., 2018; Santos and Cincera, 2018). Empirical findings vary in the literature depending on the selection of the sample, time period, tourism demand variables, and estimation techniques.
International tourist arrivals are usually used as a proxy for international tourism demand (De Vita, 2014; Eryiğit et al., 2010; Khalid et al., 2019; Lorde et al., 2015; Massidda and Etzo, 2012; Pintassilgo et al., 2016; Saayman et al., 2016; Santana-Gallego et al., 2016; Velasquez and Oh, 2013) and frequently selected as a dependent variable in these kinds of research articles. On the other hand, the standard factors which influence tourist arrivals or tourist receipts are generally chosen as GDP per capita, CPI, nominal or real exchange rates, and geographical distance (Dritsakis, 2004; Khadaroo and Seetanah, 2008; Santos and Cincera, 2018; Xu et al., 2018). Other selected independent variables can be listed as cost of transportation, population, colonial relationship, sharing a common language, sharing a border, risk index, climate index, tourism infrastructure, political instability, and bilateral trade flows (Eryiğit et al., 2010; Fourie et al., 2019; Saayman et al., 2016; Santana-Gallego et al., 2016).
Studies aiming to explain the influence of terrorism on tourism demand are generally motivated on observing the fall in tourist arrivals, the following decrease on tourism receipts, and the structure of the time-varying effects (Corbet et al., 2019; Feridun, 2011; Raza and Jawaid, 2013; Samitas et al., 2018). While these studies employ different terrorism variables (homicide ratio, number of total causalities, number of terror attacks), the overall conclusion can be stated that terrorism is certainly harmful on tourism demand (Araña and León, 2008; Pizam and Smith, 2000; Samitas et al., 2018). On the other hand, recent studies claim that there is mutual interaction between globalization and tourism demand. According to Song et al. (2018), tourism has been accepted as an essential force shaping globalization, while in turn, the dynamics of tourism demand are under the influences of globalization. Whereas globalization as a research area has already reached a rich body of literature. However, the interaction between globalization and tourism demand is less extensively investigated (Song et al., 2018). The relationship between globalization and tourism demand has been tested by using globalization proxies such as cross-border marketing collaborations, free movement of labor, and the volume of bilateral trade. Again the overall conclusion can be specified that globalization and tourism demand are positively related (Chung et al., 2019; Hjalager, 2007; Song et al., 2018; Sugiyarto et al., 2003).
In some studies, researchers focus on a single country to determine the components of tourism demand (Akis, 1998; Algieri, 2006; Lorde et al., 2015; Pintassilgo et al., 2016; Samitas et al., 2018; Velasquez and Oh, 2013), while some other researchers center upon country groups or country states (Bento, 2014; Dogru et al., 2017; Eilat and Einav, 2004; Petit and Seetaram, 2018; Shafiullah et al., 2018). In these studies, the researchers who focus on single country follow time series analysis methods such as cointegration, vector autoregression model, autoregressive distributed lag model, and Granger causality (Dritsakis, 2004; Santos and Cincera, 2018; Shafiullah et al., 2018). In other studies, researchers who study country groups use panel data methodologies. (a) The first group employs traditional panel data methods such as panel least squares (ordinary least squares (OLS)), first-generation panel unit root, cointegration and causality analysis, and generalized method of moments (Balli et al., 2016; De Vita, 2014; Khadaroo and Seetanah, 2008; Lorde et al., 2015; Massidda and Etzo, 2012; Petit and Seetaram, 2018; Shafiullah et al., 2018). (b) The second group employs second-generation panel data analysis methods and multinomial logit estimation (Eilat and Einav, 2004; Shafiullah et al., 2018).
Table 1 summarizes the literature examining the determinants of tourism demand.
Summary of literature.
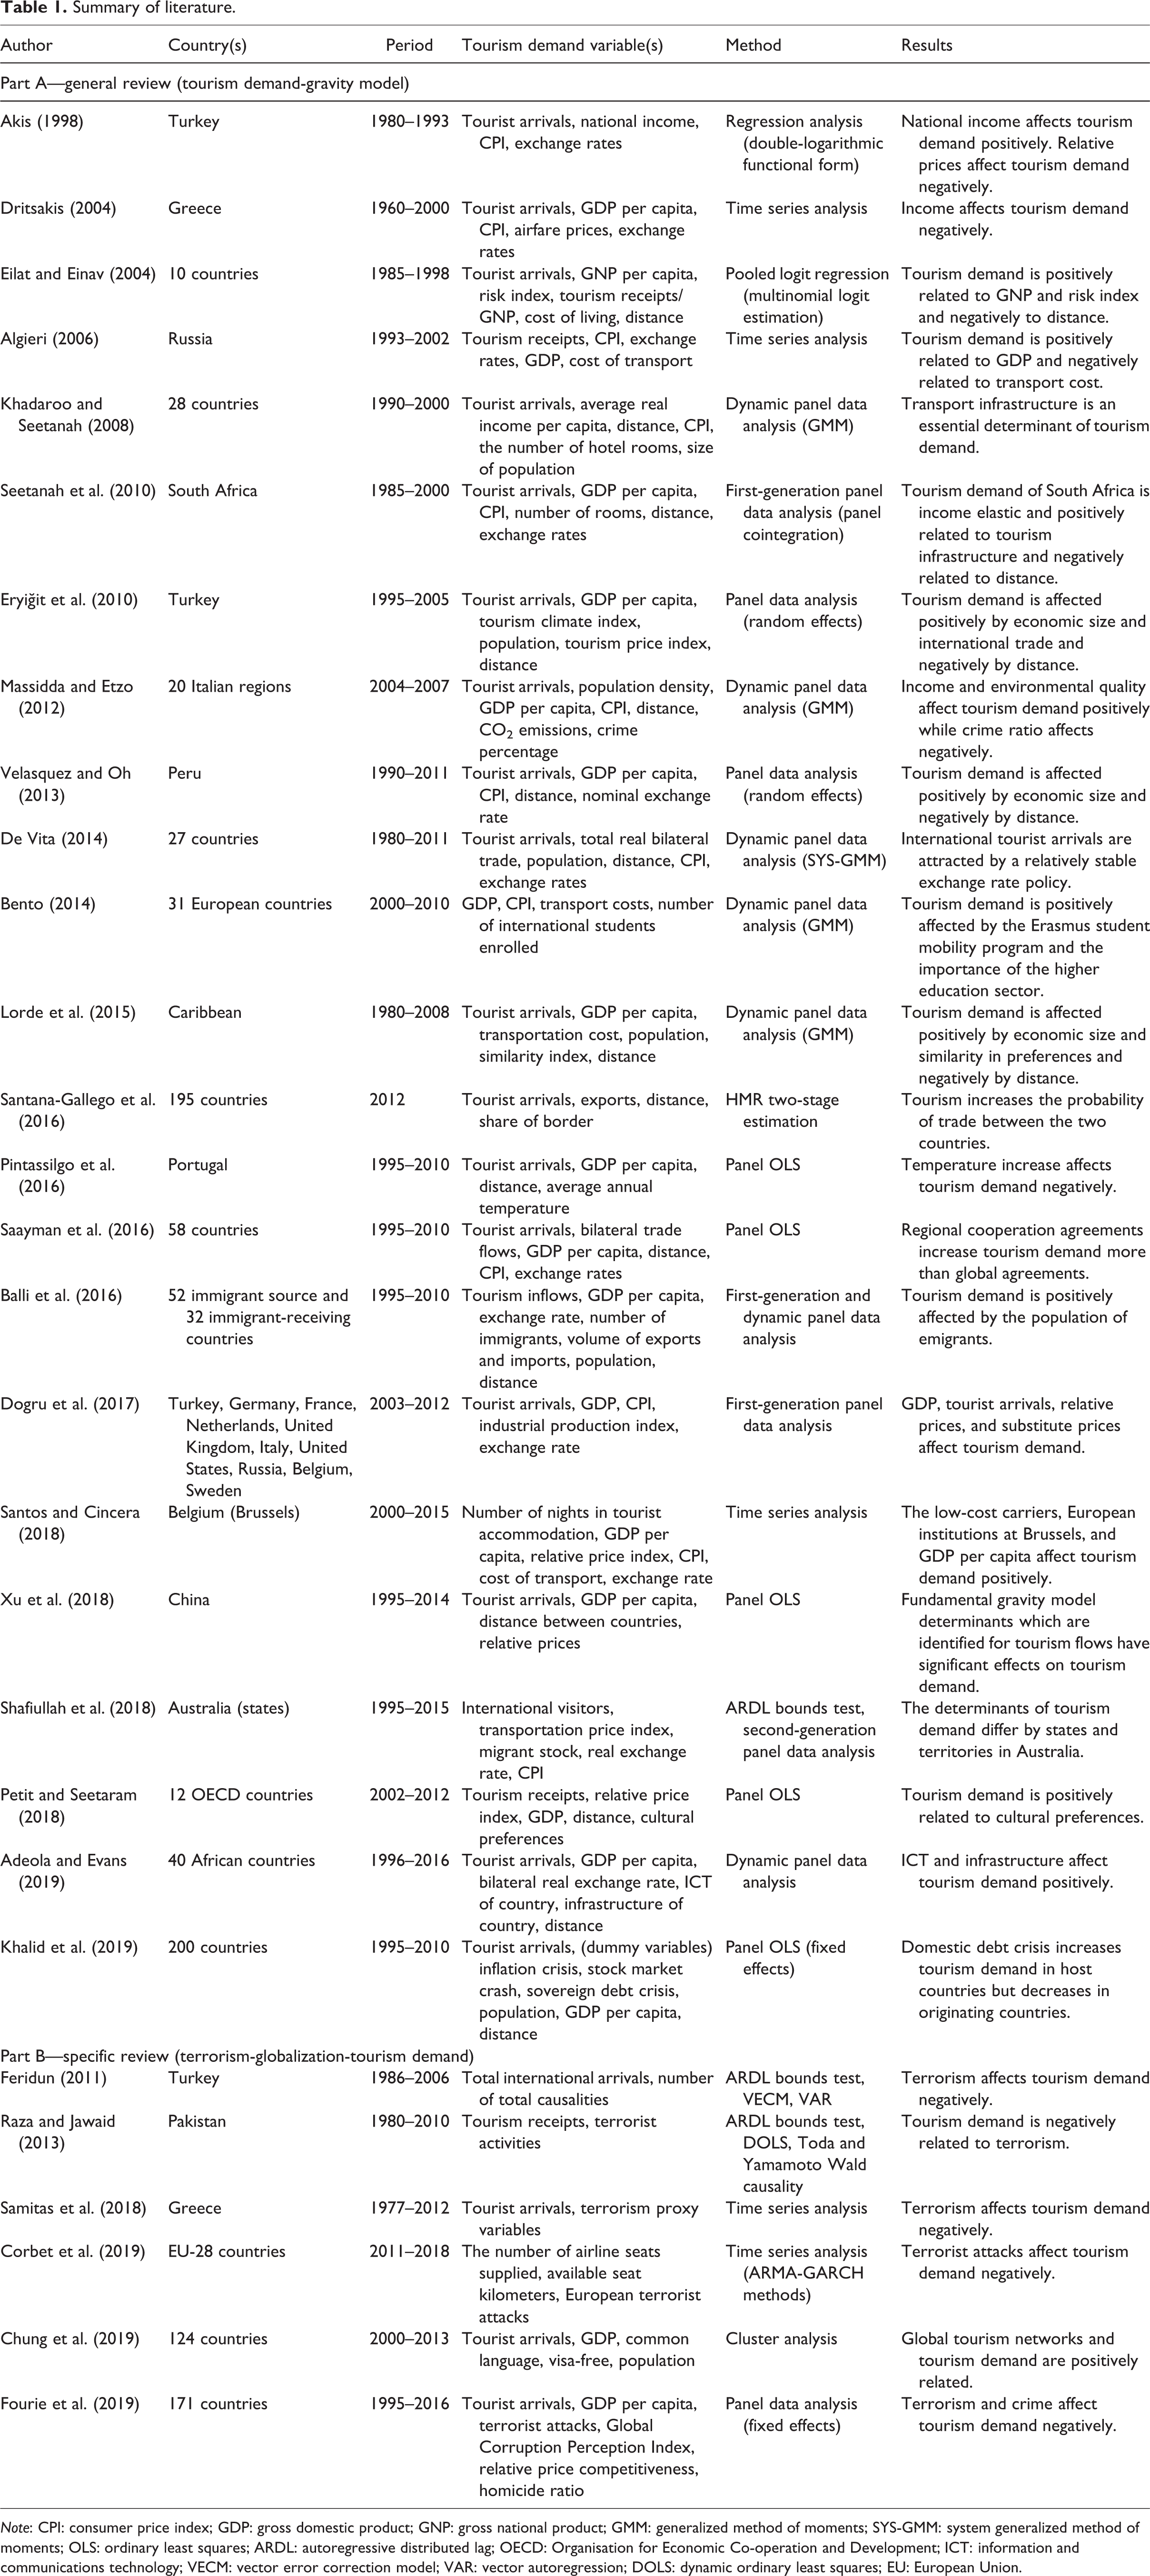
Note: CPI: consumer price index; GDP: gross domestic product; GNP: gross national product; GMM: generalized method of moments; SYS-GMM: system generalized method of moments; OLS: ordinary least squares; ARDL: autoregressive distributed lag; OECD: Organisation for Economic Co-operation and Development; ICT: information and communications technology; VECM: vector error correction model; VAR: vector autoregression; DOLS: dynamic ordinary least squares; EU: European Union.
Following the literature review summarized in this article, one might obtain the generalized conclusions listed below. In almost all studies, the empirical findings are consistent with the general framework of the gravity model. Tourism demand is positively related to economic size, environmental quality, information and communication technologies, transport infrastructure, trade openness, and cultural similarity. Tourism demand is negatively related to distance, terrorism, transportation cost, and temperature increase. Tourism demand differs by states and territories.
Model, data, and methodologies
In order to investigate the tourism demand function, the gravity approach provides a plausible way to consider bilateral flows based on distance and economic conditions (Czaika and Neumayer, 2019; Morley et al., 2014; Park and Pan, 2018; Vietze, 2012). It is an old strategy that explains various international economic affairs related to the flow of goods and services as well as factor movements (Anderson, 2011; Mátyás, 1998). This procedure is an analogy that is associated with Newton’s law of gravitation and explains how the flows between countries (i and j) react to each other as their sizes increase while they are negatively affected as the distance between i and j gets longer. Distance is accepted as an important factor of gravity analogy since it is a proper representative for all of the various costs associated with travel (Park and Jang, 2014). Using economic sizes of two countries as a determinant factor to explain international flows, a simple form of gravity approach can be stated through equation (1)

where Fijt represents bilateral tourism flows between origin i and visiting j countries at time t, and GDP is gross domestic product. Dist, a time-invariant variable, stands for the distance between country i and j, and eijt is the error term with normally distributed, zero mean, serially uncorrelated and homoscedastic variance. This transformation of the gravity model to a log–log form is often preferred due to easiness for the interpretation of the parameters as elasticities (Kulendran, 1996). By this way, a 1% change in the explanatory variable increases/decreases the dependent variable by the corresponding positive/negative value of the related variable. On the other hand, this simple transformation of gravity model can also be augmented by including other variables which might have direct and indirect influences on the flows and augmented models are widely analyzed in the literature (Khadaroo and Seetanah, 2008; Lorde et al., 2015; Okafor et al., 2018; Park and Jang, 2014). We extend the basic gravity approach by including relative exchange rate, relative CPI, 1 absence of violence/terrorism, globalization, household debt, and money supply as in equation (2) below

Following Song et al. (2003) and Song et al. (2010), the augmented gravity model can be estimated through power function, as stated in equation (3)

where TA, Y V, Y D, D, R, P, T, G, HD, and MS represent tourist arrivals, per capita income of visiting country, per capita income of destination country, distance, relative exchange rate, relative prices, absence of violence/terrorism and KOF globalization index, per capita household debt, and money supply, respectively. The recent global financial crisis has shown that per capita income may not be enough as a determinant of tourism demand, as the debt level of consumers may influence the effectiveness of this indicator. For this reason, we included per capita household debt in our analysis. To extend the literature, we also investigated the effects of money supply on tourism demand. The rationale behind adding this variable to the model is that the higher the quantity of money available in a country, the more disposable income households have. Tourism is one of the leading sectors through which households spend their excess money. Also, it is worth noting that distance is a time-invariant variable, while Y Dit is a cross-sectional invariant variable; t indicates the time period of 1998–2017 and i indicates cross-sections of panel data, consisting of the top 25 countries visiting Turkey. Ranked by the number of tourist arrivals, these countries are Russia, Germany, Iran, Georgia, Bulgaria, United Kingdom, Ukraine, Iraq, Netherlands, Azerbaijan, Saudi Arabia, Greece, France, Romania, Belgium, Syria, Kazakhstan, Israel, United States, Poland, Sweden, Austria, Jordan, Denmark, and Kuwait. The number of tourist arrivals coming from these countries approximately represent 80% of the total tourist arrivals Turkey hosts. The definition of the variables and data sources are given in Table 2.
Description of variables.
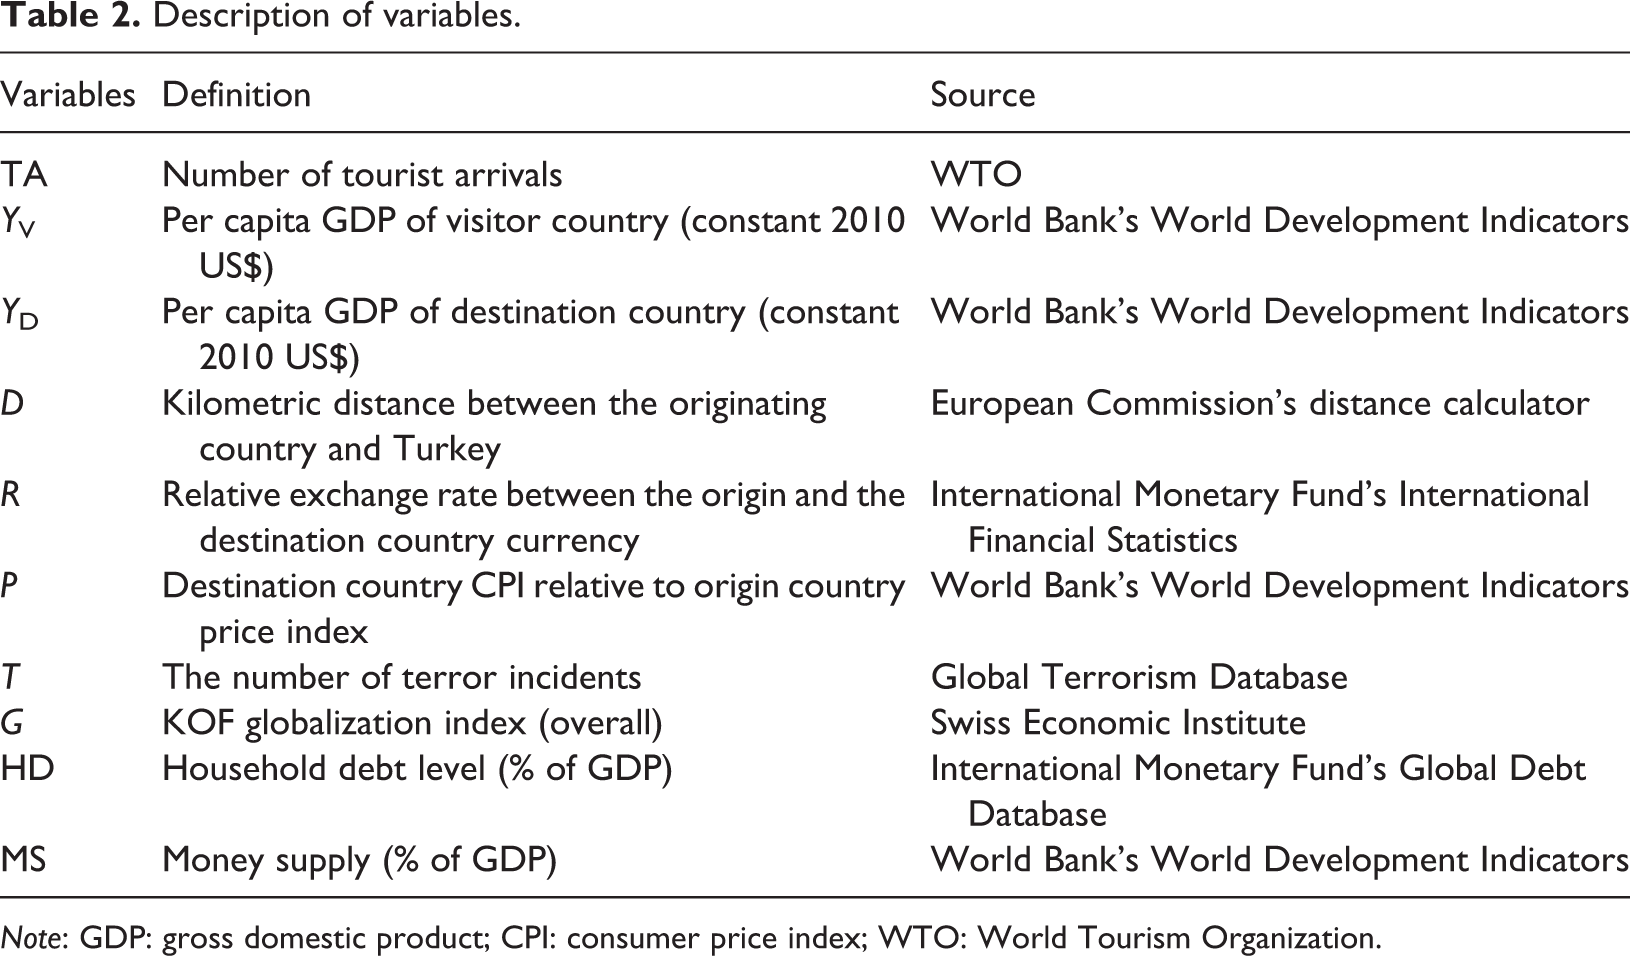
Note: GDP: gross domestic product; CPI: consumer price index; WTO: World Tourism Organization.
Our panel sample has a sufficient time dimension which requires to check stationarity properties of the variables due to avoiding spurious regression estimation as remarked by Granger and Newbold (1974). Also, cross-correlations between the panel units might lead to unreliable results in estimations (Sarafidis and Wansbeek, 2012). Therefore, cross-sectional dependence among variables needs to be first checked and after that, depending on the result, appropriate panel data techniques should be employed. Breusch and Pagan (1980), Pesaran (2004), and Pesaran et al. (2008) propose alternative tests for the cross-sectional dependence based on Lagrange multiplier (LM) procedure by using pairwise correlations of the residuals. In order to take cross-sectional dependence into account, Pesaran (2007) proposes a simple panel unit root procedure (CADF) by extending the ADF unit root strategy with the cross-sectional averages of lagged levels and first differences of the individual series. The issue has also given inspiration for the adaptation of cointegration analyses that reveal the long-run relationship between nonstationary variables. Following this purpose, Westerlund (2008) developed two statistics by adjusting the Durbin–Hausman principle. Due to estimation bias under cross-sectional dependence, Bai et al. (2009) updated Phillips and Hansen’s (1990) fully modified OLS (FMOLS) approach by considering unobserved factors as in equations below

where

Bai et al. (2009) also focus on biases in the estimation and systematically correct them in convergence stages that are continuously updated. This conformation produces continuously updated bias-corrected (CupBC) coefficients.
Results and discussion
Cross-sectional dependence test results
Accounting for cross-sectional dependence in panel data is essential and affects inference. Hence, we begin the analysis by checking the cross-sectional dependency among the variables. We employed LM test proposed by Breusch and Pagan (1980), CD and CDLM tests proposed by Pesaran (2004), and LMadj test proposed by Pesaran et al. (2008). The results presented in Table 3 show strong existence of cross-sectional dependence in all variables.
Cross-sectional dependency test results.

Note: LM: Lagrange multiplier. The values in parentheses are p values. Y D, T, and D are not included in calculations as the first two are cross-sectional invariant, while the third one is time-invariant.
*1% statistical significance.
**5% statistical significance.
Cross-sectional dependence can be caused by a global shock or as a result of a spillover effect between countries or regions. The existence of cross-sectional dependence among the variables in panel data analysis provides two important inferences: (i) Economically speaking, cross-sectional dependence among the variables means that a shock that will occur in any of the variables will spread to other countries over time. This is a natural consequence of the globalization and integration of the economies. Indeed, the financial crisis that broke out in the housing markets of the United States in 2007 rapidly turned into a financial crisis and affected other countries. (ii) Econometrically speaking, one needs to employ econometric techniques that consider cross-sectional dependency. Otherwise, as Hsiao (2014) points out, the estimates would be biased.
Panel unit root test results
Baltagi and Pesaran (2007: 229) argue that the first-generation panel unit root and cointegration tests are inadequate and could lead to significant size distortions in the presence of neglected cross-sectional dependence. For this reason, we investigate the order of integration of the variables using cross-sectionally augmented IPS (CIPS) suggested by Pesaran (2007).
As shown in Table 4, the null hypothesis of unit root cannot be rejected for the variables TA, Y V, P, and G at levels, while the null hypothesis of unit root is rejected for the variable R.
CIPS panel unit root test results.
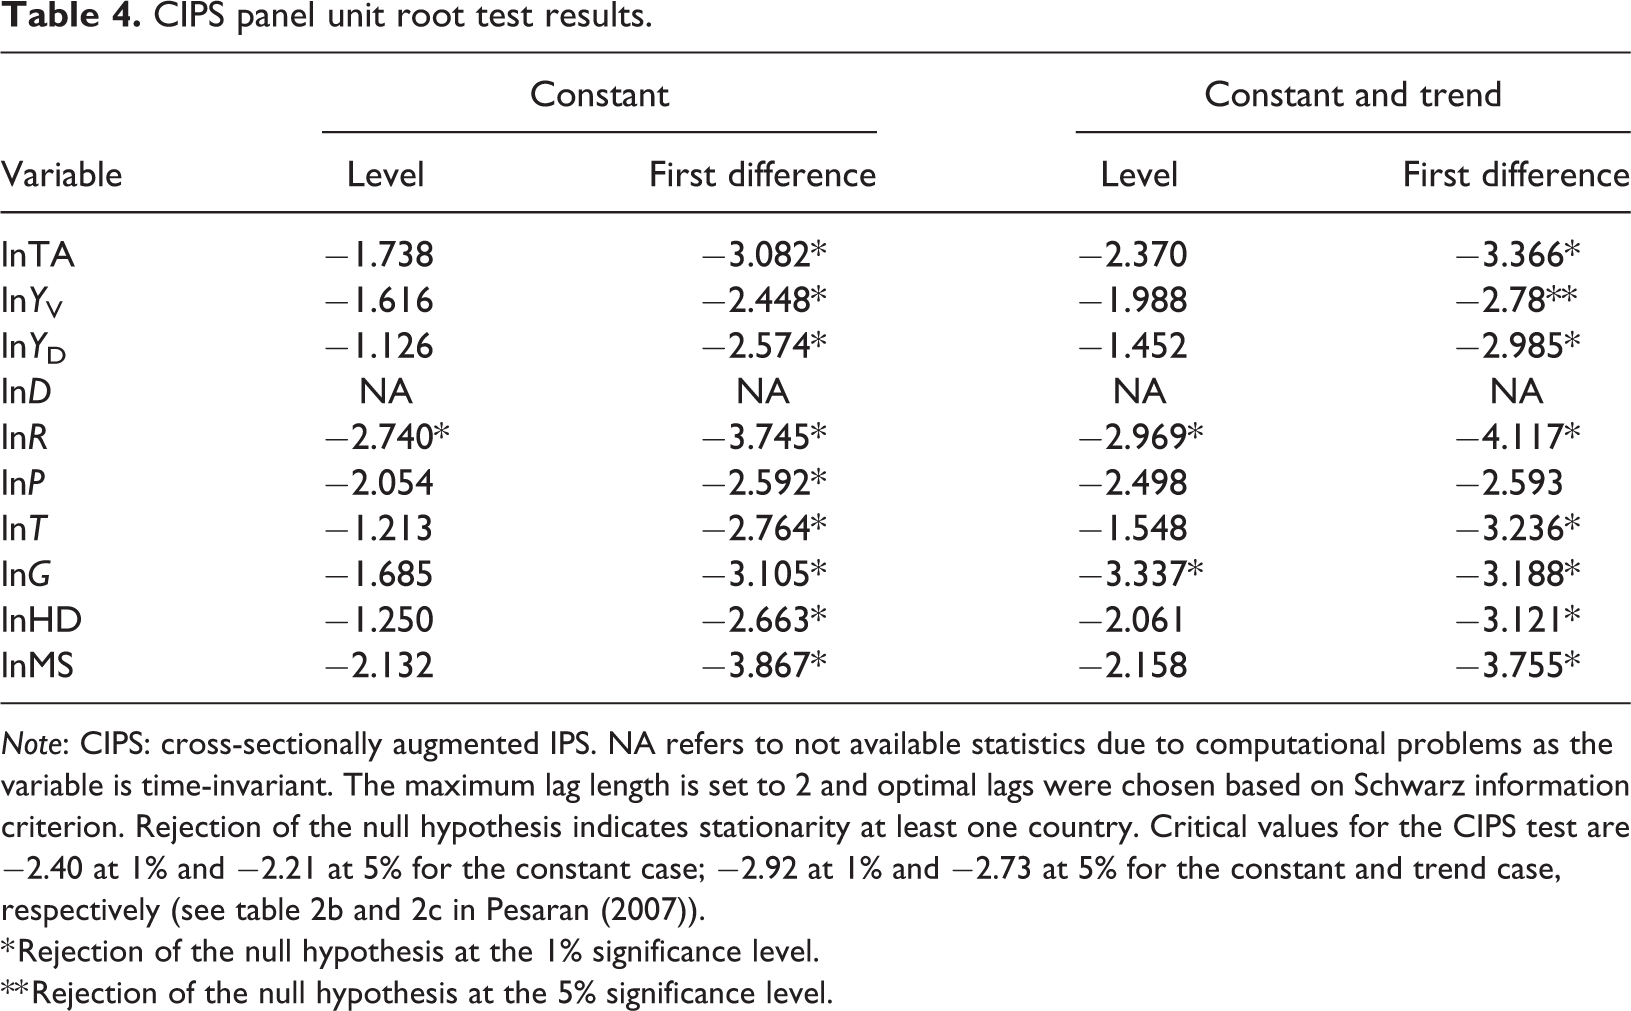
Note: CIPS: cross-sectionally augmented IPS. NA refers to not available statistics due to computational problems as the variable is time-invariant. The maximum lag length is set to 2 and optimal lags were chosen based on Schwarz information criterion. Rejection of the null hypothesis indicates stationarity at least one country. Critical values for the CIPS test are −2.40 at 1% and −2.21 at 5% for the constant case; −2.92 at 1% and −2.73 at 5% for the constant and trend case, respectively (see table 2b and 2c in Pesaran (2007)).
* Rejection of the null hypothesis at the 1% significance level.
** Rejection of the null hypothesis at the 5% significance level.
Panel cointegration results
Having concluded that all of the variables integrated of order one, we employ the Durbin–Hausman cointegration test proposed by Westerlund (2008) to observe the existence of long-run equilibrium among the variables. The Durbin–Hausman test has several advantages over other cointegration tests: (i) contrary to conventional panel cointegration tests, cross-sectional dependence is taken into account in this test; (ii) as the asymptotic distribution of the test is normal, it is easily applicable in models with many explanatory variables; (iii) Monte Carlo simulations reveal that the size distortion of the Durbin–Hausman test is very low and the power of the test is greater than other cointegration tests; (iv) the most attractive feature of the test is that it can be applied even when variables are integrated at different levels.
Westerlund (2008) developed two tests, Durbin–Hausman group and panel statistics (DHg and DHp). The former test is constructed under slope homogeneity, while the latter assumes slope heterogeneity. The results presented in Table 5 clearly indicate that the null hypothesis of no cointegration is rejected at the 1% significance levels for both tests. This finding suggests that there is a long-run cointegration relationship among tourist arrivals, per capita income, distance, relative exchange rate, relative prices, number of terrorist incidents, and globalization.
Cointegration test results.
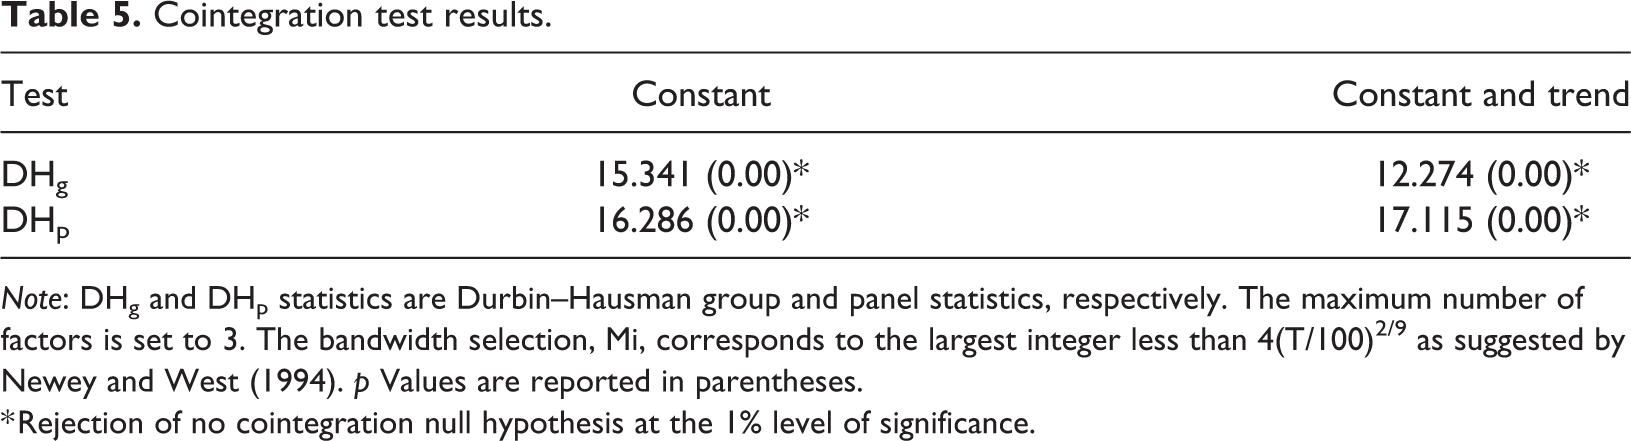
Note: DHg and DHp statistics are Durbin–Hausman group and panel statistics, respectively. The maximum number of factors is set to 3. The bandwidth selection, Mi, corresponds to the largest integer less than 4(T/100)2/9 as suggested by Newey and West (1994). p Values are reported in parentheses.
* Rejection of no cointegration null hypothesis at the 1% level of significance.
CupFM and CupBC estimation results
As the panel cointegration results suggest the presence of a long-run relationship among the variables, we proceed with the estimation of the long-run coefficients. The results of the cross-sectional dependence test require the use of second-generation panel cointegration test. In order to obtain long-term cointegration estimators, we employed CupFM and CupBC estimators developed by Bai et al. (2009). These estimators control the unobserved nonlinearity as well as effectively deal with cross-country heterogeneity and endogeneity biases (Islam and Madsen, 2018: 270). The CupFM and CupBC estimation results are reported in Table 6.
Cointegration parameters.
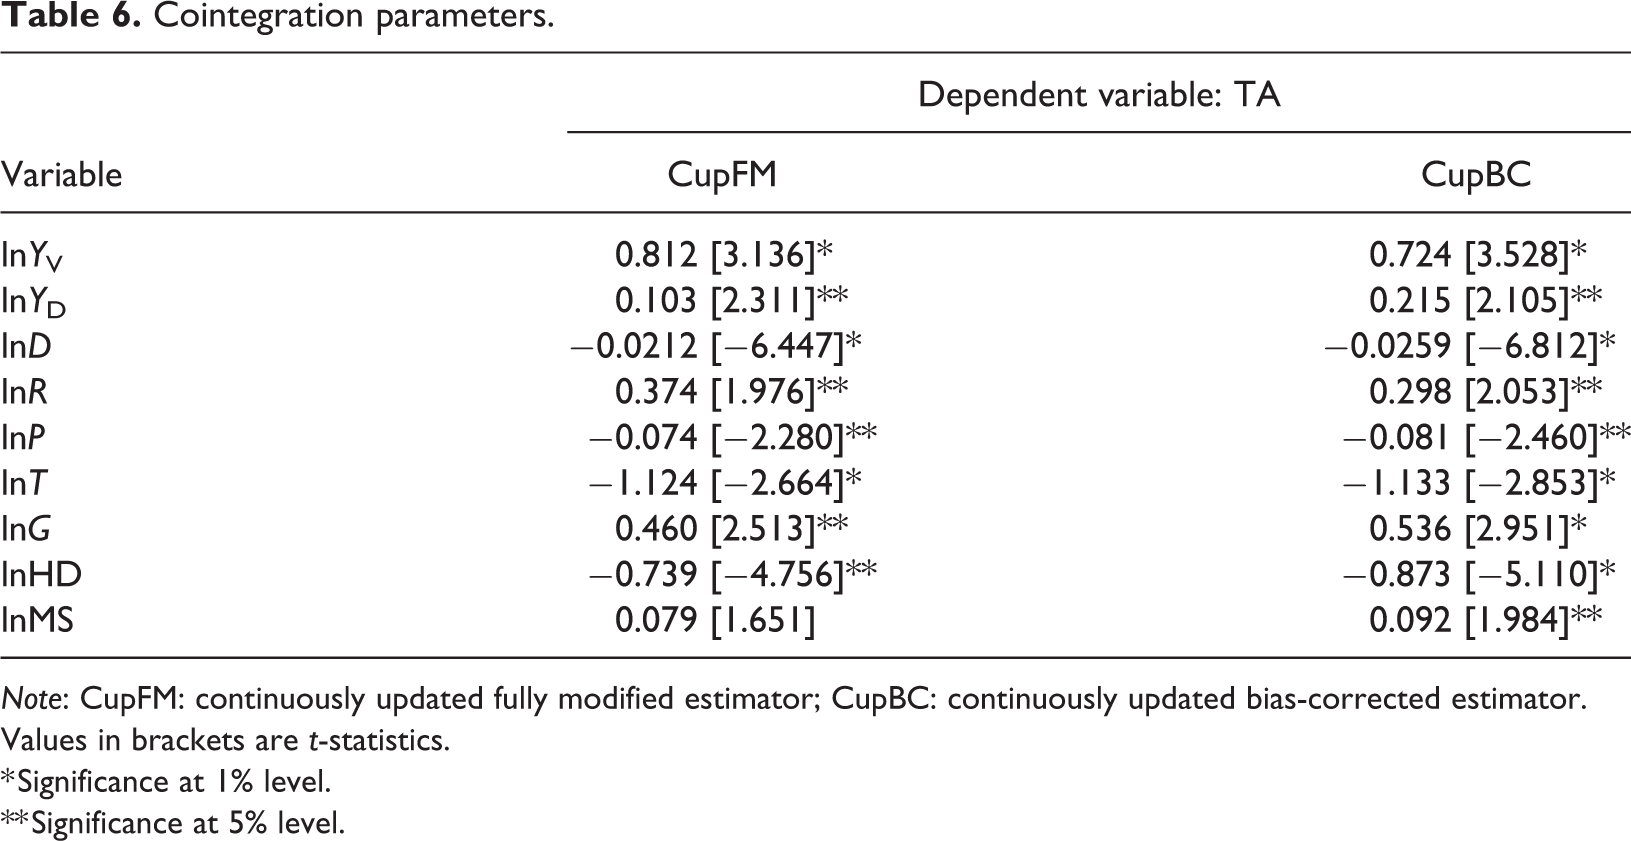
Note: CupFM: continuously updated fully modified estimator; CupBC: continuously updated bias-corrected estimator. Values in brackets are t-statistics.
* Significance at 1% level.
** Significance at 5% level.
As can be seen in Table 6, CupFM and CupBC estimators provide similar results. All estimated coefficients have a statistically significant impact on tourist arrivals to Turkey and have expected signs, except for MS which is significant in CupBC estimation but insignificant in CupFM estimation.
According to Table 6, Turkey’s tourism sector is positively affected by the per capita income (Y V) of origin countries. More specifically, a 1% increase in real per capita income of the origin country would increase tourist arrivals by 0.812–0.7245%. As the elasticity of tourist arrivals with respect to per capita income is greater than unity, tourism demand for Turkey can be regarded as a luxury good. This finding implies that in case of a decrease in the origin countries’ income due to a financial crisis, tourist arrivals in Turkey will be severely affected. It is noteworthy to mention that tourism demand being a luxury good might be regarded as a risk in countries where there is a high concentration ratio in terms of originating countries. As of 2018, the share of the top 5 countries in the total number of arrivals accounts for 53%, while the top 10 account for 73%. Turkey has recently suffered as a result of a high degree of concentration of arrivals, though not income-related, when a Russian plane was downed by Turkey in 2016. From 2015 to 2016, the number of Russian visitors dropped from 3.64 million to 866,000, which corresponds to a massive decrease of 76%.
It can be seen from Table 6 that an increase in destination country’s GDP (Y D) will also influence the tourism flows to the destination country. More specifically, a 1% increase in Turkey’s per capita GDP will lead to an increase of 0.103–0.215% in the number of tourists visiting Turkey. This indirect effect can be explained with the view that as the GDP of destination country increases, more investment will be pumped into the tourism sector. Thus, improvement in tourism infrastructure will attract more visitors.
The coefficient associated with distance (D) shows that a 1% increase in the kilometric distance between the origin country and Turkey would decrease tourist arrivals by 0.0212–0.0259%. Even though the impact of distance on tourist arrivals is not substantial, it is still an important factor in tourism inflows in Turkey. The most basic explanation of this finding is that the distance increases transportation cost and the level of discomfort. In order to reduce the negative effects of distance on tourism, policymakers should aim to reduce transportation costs for visitors coming from overseas. As for the neighboring countries, geographical closeness should be used to attract more tourists.
Changes in exchange rate (R) between the origin country and Turkey’s currency in favor of origin countries will decrease the cost of living in Turkey. According to the results presented in Table 6, tourist arrivals increase by about 0.374–0.298% in the case of a 1% higher exchange rate between Turkey and the origin country in favor of the origin country. This is in line with the theoretical expectations as an appreciation in the currency of origin country will encourage more visitors due to a rise in the purchasing power of the tourists.
Another proxy of cost of living, CPI (P), which is calculated as the ratio of the CPIs of Turkey to the origin country has a negative and statistically significant effect on tourist arrivals. The logarithm of relative prices indicates the difference between the logarithm of the price level in Turkey and origin countries. Therefore, a 1% increase in the difference between the logarithmic price level in Turkey and the origin country will yield a 0.074–0.081% decrease in tourist arrivals to Turkey.
Among all the variables included in the model, the number of terror incidents (T) is the most dominant variable, with a coefficient of −1.124% for CupFM estimator and −1.133% for CupBC estimator. This empirical finding is important in that the acts of terrorism seem to be the biggest obstacle in front of Turkey’s tourism sector.
Globalization (G) has a moderate positive impact on tourist arrivals. Holding all other variables constant, a 1% increase in the globalization index will yield to the number of tourist arrivals increase of 0.460–0.536%.
The household debt of the visiting countries has a decreasing effect on tourism demand for Turkey. Quantitatively, a 1% increase in household debt will lead to a 0.739–0.873% decrease in the number of tourist arrivals. This finding is important in that when modeling the dynamics of tourism demand, per capita income itself is not effective. In other words, per capita income does not fully reflect tourists’ disposable income as the disposable income is highly dependent on the debt level of households.
Finally, CupFM and CupBC estimators yield inconclusive results for money supply (MS). As for the CupFM estimator, the money supply has no statistically significant effect on tourism demand, while CupBC estimator has a statistically significant effect. However, both estimators provide positive signs for the impact.
Conclusions
The gravity approach has been widely used to reveal the impacts of various factors on tourism demand. This study follows an augmented version of the gravity model that includes relative exchange rate, price level, terrorism, globalization, household debt level, and money supply as well as per capita income of origin countries and distance that reflects all the various costs associated with travel. The study econometrically analyzes the constructed model by conducting second-generation panel data estimation techniques for Turkey as one of the most visited top 10 countries in the world. CupFM and CupBC estimators produce statistically significant coefficients that have expected signs for all factors employed in the gravity equation.
Empirical results show that terror attacks are the most dominant factor for tourism demand in Turkey, causing significant decreases in the number of tourist arrivals. For this reason, tourism receipts fall behind potential although cheap tourism opportunities exist in the country. Therefore, special attention should be paid to prevent terror attacks and required actions should be put into practice. On the other hand, foreign visitors as well may suffer from terror incidents such as being a victim or devoid of cheap vacations. In this respect, terror attacks negatively affect the welfare of foreign citizens. So, the global struggle with terrorism becomes in favor of all countries and their citizens. Empirical results also show that globalization, defined as the interaction and integration among people who live anywhere in the world, has a positive influence on tourist arrivals. This finding implies that economic, social, and political integration policies of a country to global systems will enable the country to gain more foreign currency and will help decrease its current deficit problem. Different from the current literature, this study also observes the impacts of changes in money supply and household debt level on tourism demand. The findings for household debt level strongly support the view that as the debt level of households increases, demand for tourism decreases. This result provides important conclusions to be drawn as income level itself is not enough as a determinant of tourism demand as the effectiveness of this indicator is influenced by the debt level of consumers.
Other variables used in the gravity model also have expected influences on tourist arrivals consistent with the literature findings. Income level and relative exchange rate positively affect tourism demand while price level and distance variables have a negative impact. Overall, findings of this study have been reached by employing annual data of top 25 visiting countries (Russia, Germany, Iran, Georgia, Bulgaria, United Kingdom, Ukraine, Iraq, Netherlands, Azerbaijan, Saudi Arabia, Greece, France, Romania, Belgium, Syria, Kazakhstan, Israel, United States, Poland, Sweden, Austria, Jordan, Denmark, and Kuwait) and they have the potential to be able to reflect destination chose of 25 countries’ citizens through macro-level data covering the period of 1998–2017, resulting in 500 observations. In this respect, this study provides more robust results and useful implications in the understanding of tourism demand from a broader perspective not only for Turkey but also for other tourism destinations.
Possible contributions of the study to the related literature are threefold: two possible contributions are the inclusion of terrorism, globalization, money supply, and debt level variables into the gravity equation to investigate their effects on tourism demand. The third one is the use of advanced panel data estimation techniques that produce robust results by considering serial correlation, heteroscedasticity, and cross-sectional dependence problems. To the best of our knowledge, this is the first study that considers terrorism, globalization, money supply, and debt level in an augmented gravity approach by using CupFM and CupBC estimators.
Lastly, there are also some limitations as well that we encountered during our research: (i) The study employs annual data covering from 1998 to 2017. Due to the unavailability of daily or monthly data for other variables, we could not consider the effects of seasonality which is important for carrying out short-term analyses (see Andrawis et al., 2011; Ridderstaat et al., 2014). (ii) The study does not account for regime switches that may reveal different responses for each variable in different regimes since the annual time dimension is not large enough. (iii) Data for each variable employed in the study are collected from various databases such as World Bank, WTO, Swiss Economic Institute, Global Terrorism Databases, and International Monetary Fund, and some measurement errors may exist due to their calculation methods. (iv) Despite their superior statistical power and robust estimation ability of CupFM and CupBC estimators, alternative methodologies can be conducted, regime switches can be considered, and seasonal variables can be employed by future researchers for different samples with a larger data set. Furthermore, considering the negative impacts of terror attacks on tourism demand, security policies become prominent to improve the tourism sector. This finding recalls how security expenditures may help to improve the tourism sector as an indicator of preventive actions of terror attacks. Future research also may employ security expenditure in addition to terrorism to reveal their simultaneous impacts on tourism demand.
Footnotes
Acknowledgements
The authors would like to thank Frank Agbola, guest editor, and two anonymous referees for their constructive comments and suggestions, which improved the quality of this article. The authors also thank Halil Yücel for reading an earlier version of this manuscript. All the remaining errors are solely the authors’ responsibility.
Declaration of conflicting interests
The author(s) declared no potential conflicts of interest with respect to the research, authorship, and/or publication of this article.
Funding
The author(s) received no financial support for the research, authorship, and/or publication of this article.
