



Abstract
Few studies on the economic impact of active sport tourism have been conducted, and these are limited to one sport. Multipliers, moreover, relate only to sport activities and not to sport tourist typologies. This article examines the economic impact of four activities (golf, windsurfing, horse riding and scuba diving) on income and employment generation in Messinia, a region in south-western Greece. Since no input–output tables are available at this local level, the ad hoc model was employed. Golf generated higher income and more employment units than the other activities, displaying all of the characteristics of a propulsive activity, a concept derived from the growth pole theory. Regarding typologies, primary sports tourists exhibit higher multipliers than tourists interested in sport in every case. The article, also, partially validates the general consensus that small tourism firms have higher total multipliers than their larger counterparts. Implications stemming from the results are discussed.
Keywords
Introduction
There is ample potential for economic development in outdoor sport activities, particularly for non-urbanised areas that may not have the facilities to host big sport events. Nevertheless, active sport tourism comprises only a small part of the literature on the economic impact of sport tourism, which tends to be heavy on events. This is evidenced in earlier reviews of sport, as well as surf, tourism research (Hinch et al., 2014; Martin and Assenov, 2012; Weed, 2009) and is also reported by Dixon et al. (2014) and Hritz and Franzidis (2018). Relevant studies have been conducted on a local, regional and state level, though these are limited to one sport (Bowker et al., 2007; Ditton et al., 2002; Haydu and Hodges, 2002; Kim et al., 2008; Maples and Bradley, 2017; Murphy and Bernal, 2008; Ritchie and Hall, 1999; Stoeckl et al., 2010; Stynes and Sun, 2001; Stynes et al., 2000; Upneja et al., 2001). Moreover, multipliers relate only to sport activities and not to sport tourist typologies.
This article investigates the economic impact of four sport tourism activities (golf, windsurfing, horse riding and scuba diving) in terms of income and employment generation and further examines their relative – rather than individual – impact on the local economy of the south-western Greek region of Messinia. It also investigates whether any of these activities display the features of a propulsive activity, a concept derived from regional science’s growth pole theory. Secondly, it seeks to examine the relative contribution of sport tourist typologies, and particularly between sport tourists for whom the activity was the primary purpose of their trip or not (primary sports tourists or tourists interested in sport). Although such typologies have been presented in conceptual frameworks/models (Gammon and Robinson, 1997; Robinson and Gammon, 2004; Sofield, 2003; Standeven and De Knop, 1999), it is not yet evidenced which exhibits higher tourist multipliers and is therefore more effective in income and employment generation.
The article is structured as follows. The next section presents the main models for estimating the multiplier effects of tourism as well as the growth pole theory and propulsive activity concept. The second section contains a description of the four sport tourism activities under study. The third outlines the method used for estimating the effects, while the fourth describes the data collection and analysis method. The fifth section presents the main results, with discussion and conclusions following.
Literature review
Models for estimating multiplier effects of tourism
Four basic models have been used in the literature to estimate the multiplier effects of tourism: economic base, Keynesian, input–output and ad hoc (Fletcher and Archer, 1991; Frechtling, 1994; Klijs et al., 2012; Lagos, 2018). Beyond these, we also find other more advanced models, such as that based on the social accounting matrix (e.g. Akkemik, 2012; Daniels et al., 2004) or the computable general equilibrium model (e.g. Narayan, 2004; Zhou et al., 1997).
The economic base model, though prevalent, is limited in the case of tourism (Frechtling, 1994; Lagos, 2009). This is because the model and its multipliers estimate total effects on the entire economy, without allowing analysis on a sectoral level or of types of effects: direct, indirect and induced (Eadington and Redman, 1991; Hodur and Leistritz, 2006). Other disadvantages are as follows: (a) the subjective separation of economic activities/sectors between basic and non-basic; (b) the assumption that all types of exports have the same multiplier effect irrespective of sector; and (c) the assumption that economic growth relies mainly or exclusively on exports (Archer, 1977; Frechtling, 1994; Lagos, 2009; Schaffer, 1999). The Keynesian multipliers, in turn, are restricted by the fact that they do not account for sectoral interactions. This model further adopts an aggregate approach, by assuming that all economic sectors are subject to the same marginal propensity to consume, import and so on regardless of the structure of final demand (Archer, 1976; Fletcher and Archer, 1991; Lagos, 2009).
The input–output model has certain advantages over the previous models. Among others, it allows analysis on a sectoral level as it focuses on inter-sectoral linkages, and the estimation of types of effects separately (Fletcher, 1989; Lagos, 2009). Input–output tables, however, require a great amount of data, making them time-consuming and costly to produce. Furthermore, the model is based on certain restrictive assumptions, key among which is that each sector has a linear homogeneous production function (constant input coefficients), thus excluding economies or diseconomies of scale, and input substitution (Frechtling, 1994; West and Bayne, 2002). The model’s limitations can be addressed by constructing more sophisticated input–output models (e.g. Fletcher, 1989; Wanhill, 1988; West and Gamage, 2001), though even more data are needed.
The ad hoc or Archer model allows us to derive tourist multipliers for different typologies and sectoral multipliers, as per the input–output model, and, more importantly, multipliers on a firm level (see Liu and Var, 1982; Milne, 1987). Also, it permits analysis of different types of effects, at different geographical levels, and of direct effects on income and employment. On the other hand, it is very difficult on a practical level to include all sectors of an economy in an ad hoc model, while the selection of the sectors to be included depends on the model builder (Fletcher, 1989) but also on the funding available. Furthermore, as it is based on input–output analysis, it adopts the same restrictive assumptions (Diniz, 1999; Slee et al., 1997). Use of this model is recommended on a regional or local level, where there are usually no input–output tables available and the cost of their construction is prohibitive.
The social accounting matrix provides more statistical information (income distribution, tax structure, sources of savings, etc.) than the input–output table and, therefore, the required data increase the cost of construction and restrict the analysis to a smaller number of sectors. Another disadvantage is that the models resulting from this matrix adopt the same restrictive assumptions as the input–output analysis (Loveridge, 2004). Lastly, the computable general equilibrium model uses more realistic assumptions (e.g. production functions are not linear, there are no unlimited resources, prices can vary) in relation to the basic input–output model and examines the effects of a shift in final demand on all the aspects of an economy by accounting for feedback effects (Dwyer et al., 2004). However, the need for a large amount of data greatly increases the cost of the model’s construction and limits the analysis to an even smaller number of sectors than the social accounting matrix (Loveridge, 2004).
Growth pole theory and propulsive activity
The growth pole theory was introduced to regional science by Perroux (1955). He described the growth pole as a propulsive activity or an agglomeration of propulsive activities that has a stimulative effect on its local/regional economy. Such activities (a) induce large impacts through linkages in terms of revenues, output, income and employment; (b) concentrate other businesses in their pole or surrounding region; and (c) generate economies of scale and external economies for other relative activities. According to Perroux’s theory, growth poles are not necessarily confined to urban centres but can be developed in abstract economic space (Parr, 1999).
While it is industries that are usually regarded as propulsive activities, financial services, R&D, arts and culture – as well as tourism, according to Weaver (2004) – can also act as such. However, this theory has not been substantially applied in tourism studies. Maitland (1997) suggests that tourism (and leisure activities) can play a propulsive role in the economic regeneration of cities. Christofakis (2010), meanwhile, based on the study results of ESPON (2010), presents the cases of Suceava County in Romania and Troodos in Cyprus in which tourism is seen as constituting a propulsive activity, being integral to their local productive systems and creating strong inter-sectoral linkages. The propulsive activity concept has been applied in the sport tourism context by Drakakis and Papadaskalopoulos (2014), though it did not extend to inter-sectoral linkages and the impacts on income and employment. As such, this article aims to investigate whether any of the sport tourism activities entail all of the characteristics of a propulsive activity.
Sport tourism activities under study
Golf
Two of Greece's eight golf courses are in Messinia, both operated by the Costa Navarino (CN) resort. This is a major Greek-owned enterprise employing more than 1200 when at full capacity and contributing 18–20% and 30–41% to the region’s total hotel beds and person-nights, respectively. The first, located on the grounds of the resort in Romanos (see Figure 1), opened in May 2010, while the second, in Pylos, was launched in October of the following year, constituting the country's first signature golf courses. The two courses have generated interest from Greek and foreign air carriers in the region, boosting arrivals at the local airport, which only handled a small number of flights – mainly charters – previously. Today the airport operates regular (seasonal) flights from major European golf markets such as Germany, Sweden, the United Kingdom and France, thus contributing to the significant extension of the tourism season for the resort and the region alike. According to airport data, overall arrivals increased each year since 2010, except for 2015. 1 The sport activity, moreover, has contributed to the establishment of new tourism businesses and the upgrade of existing ones in the broader vicinity, as stressed by respondents in a business survey conducted by the field researcher (see below for this survey). The resort has developed ties with local development agencies and social entities for the promotion and further development of this activity. For example, it works with municipal authorities and the Messinian Hotelier’s Association when they invite sport, as well as tourism, journalists in the region. It has also built relationships with local sport bodies for co-organising events or holding tours at its sport facilities and reaches out to local schools granting golf scholarships to students. Two new signature golf courses are being planned by CN, with a view to establishing the region as a prime golf destination in the Mediterranean.

Region of Messinia and location of activities under study.
Windsurfing
Messinia’s 120 km of beaches offer plenty of spots for windurfing, with the seaside villages of Finikounda and Gialova emerging as the most popular. These locations are regarded as ideal by both novices and more experienced windsurfers, owing to the prevailing weather conditions and their geographical characteristics. The majority of windsurfers stay at three beachside campsites in Finikounda and one in Gialova, while the former also has a water sports centre that has been in the business since 1991. Most of Messinia's windsurfers have become attached to the region and are return visitors (some have been coming regularly for two or even three decades), mainly from Germany, Austria, Switzerland and The Netherlands. Apart from the veterans in their 50s and 60s, one will also encounter avid young windsurfers and children initiated to the sport by their parents.
Horse riding
Equestrian tourism is quite underdeveloped in Messinia. Furthermore, even though all the riding centres are open year-round, business from tourists (mainly Greeks) is limited to the summer. The centre in Kalamata, however, also does business with riders from neighbouring regions who use it for training once or twice a week throught the year. The region has four riding centres that are at disparate locations (Kalamata, Hrani, Almyros and Ano Kalo Nero) and offer different types of equestrianism. As a result, they have not built partnerships with one another, nor with local authorities, but they often refer visitors to other centres when they cannot provide the type requested.
Scuba diving
Similar to horse riding, the potential for diving tourism remains largely untapped. There are five dive centres in the region (in Kalamata, Marathopoli, Kardamyli, Pylos and Finikounda) but no major attractions like dive parks or underwater museums. Business activity relies mainly on simple holidaymakers rather than tourists whose primary motive is scuba diving, except for members of a diving club in Belgium who have been regulars at the Marathopoli centre for some years. Likewise, no synergies have been formed with local authorities or between the dive centres themselves for the further development of this activity. One initiative on the local authority level, though, that is expected to attract more divers to the area – once completed – is the creation of two underwater archaelogical parks by the Municipality of Pylos-Nestor.
Visitation data and expenditures
Visitor expenditure surveys were conducted for the above activities. The examination of more than one activity necessitated the surveys to be carried out in different years: 2011 for golf, 2012 for windsurfing and horse riding and 2013 for scuba diving (see Drakakis and Papadaskalopoulos, 2014 for more detail). Some results from these surveys, using both approaches for calculating visitor expenditures, 2 are presented in Table 1. Most total expenditures came from golf due to higher per capita spending. Windsurfing comes in second place, as tourists who engaged in this activity may have had more visitor nights than golfers but spent considerably less on a day-to-day basis. Horse riding follows, with scuba diving coming in last place as a result of the small number of visitors/overnight stays. 3 With regard to typologies, tourists interested in sport generated more tourism revenues in the region in three of the four activities – golf, horse riding and scuba diving – with primary windsurfers forming the exception. Using the importance scale, total expenditures remained highest in golf and lowest in scuba diving, with windsurfing outperforming horse riding.
Visitation data, and average and total expenditures (€).
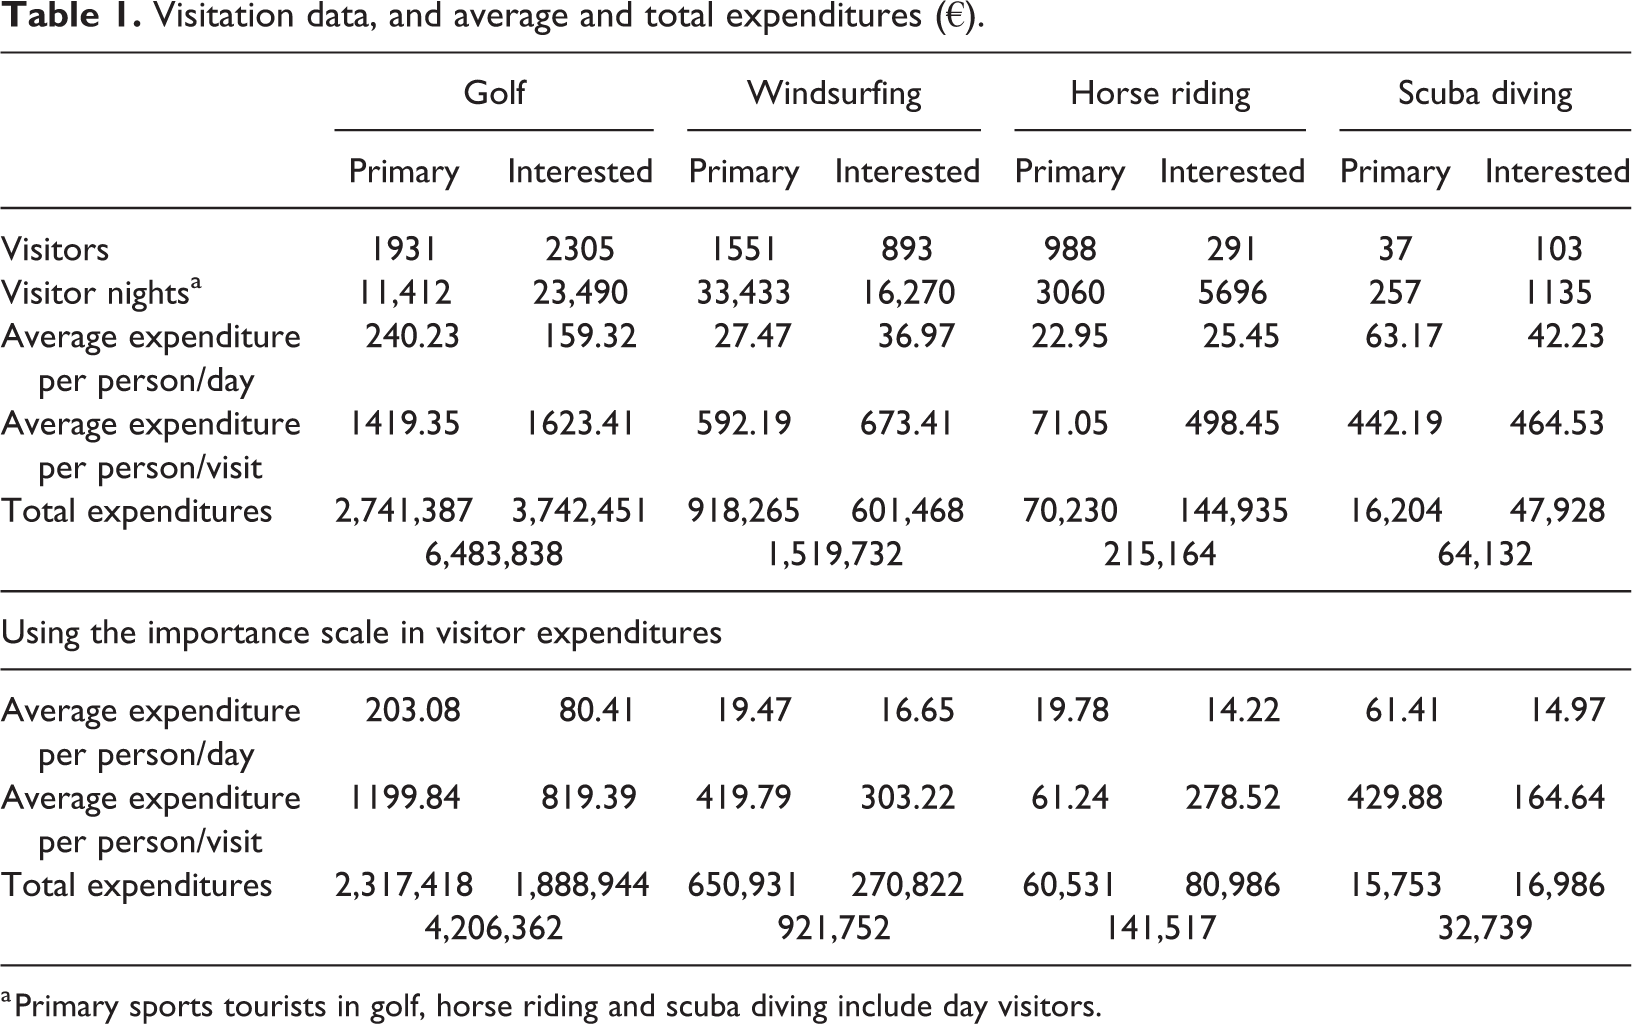
a Primary sports tourists in golf, horse riding and scuba diving include day visitors.
Applied method for estimating multiplier effects
The advantages offered by the input–output and ad hoc models, in conjunction with (a) the lack of secondary data at the desired sectoral and local level of analysis in the case of the Keynesian and economic base models, and (b) the drawbacks (cost of construction, analysis in a small number of sectors) of the social accounting matrix and the computable general equilibrium model, dictate the choice of a model between the first two.
Input–output tables, unfortunately, are not available at the local level in Greece. National tables published by the Greek and European statistical authorities (ELSTAT, EUROSTAT) can be regionalised using location quotients (see McCann, 2013), but the conversion of national to local coefficients requires statistical data (output, employment) that are not available at the desired level of analysis. As a result, a business survey was conducted to collect all the necessary data for those sectors that are directly or indirectly affected by the four sport tourism activities, in order to construct the input coefficient matrix. This matrix enabled, at the first stage, the export of direct and indirect coefficients (or partial multipliers) through input–output analysis (Leontief inversion matrix). The estimation of total coefficients/multipliers necessitated the model to be closed with respect to households. However, this is a challenging process, as the column vector of private consumption is not available, and it is necessary to derive the income used for household consumption in each sector. Moreover, the aggregate income in the household row should equal total consumption expenditures. It was thus preferable to estimate induced effects through the ad hoc model. 4
The applied method, therefore, is based on input–output analysis and the ad hoc model, and essentially constitutes a methodological approach of the latter. This method contains a partial input–output procedure, since the analysis does not include all of the sectors of an economy but only those affected by the tourism activities under study. However, the collection of primary business data, though a time-consuming and costly process, assures a more reliable estimation of local income generation in relation to the secondary data of input–output tables, where convenient assumptions can be made regarding the factor payments to non-residents (see Var and Quayson, 1985).
Tourism income multiplier
The tourism income multiplier results from the following expression (Archer, 1976)

where j indicates category (typology) of tourist, j = 1, 2, 3,…, N; i indicates business category (economic activity), i = 1, 2, 3,…, n; Qj indicates the proportion of total (or per-unit) tourist expenditure spent by the jth category of tourist; Kji indicates the proportion spent by the jth category of tourist in each ith business category; Yi indicates the direct and indirect income generated per unit (€) of turnover by the ith business category of the region (direct and indirect income coefficient); c indicates propensity (average or marginal) to consume; Xi indicates the proportion of total consumer spending by residents in the ith business category; and Zi indicates the proportion of consumer spending by residents in the ith business category within the region.
The direct and indirect income coefficient is calculated with the following formula (Archer and Jones, 1977)

where W indicates gross wages and salaries paid to residents in the region; h indicates deductions made from wages and salaries for social security payments and so on; tw indicates tax rate on wages and salaries; P indicates profits accruing to residents in the region; tp indicates tax rate on profits; F indicates rent payments to residents in the region; tf indicates tax rate on rent; Mia indicates cost payments for goods and services made by the ith business category to the ath business category in the region; Ya indicates direct and indirect income coefficient for business category a; and Di indicates total turnover of the ith business category.
Values of Yi for all business categories (economic activities) can be derived by the simultaneous resolution of all formulae in equation (2) that are included in the model. However, this process may be tricky, especially when there are a large number of business categories. Alternatively, the solution for such a system of equations can be achieved using simple matrix algebra. More specifically, equation (2) for every i business category can be expressed as follows

where y indicates the column vector (n × 1) of direct and indirect income coefficients; v indicates the column vector (n × 1) of direct income coefficients 5 ; and AT indicates the transposed matrix (n × n) of technical coefficients.
From equation (3)

and thus

which is the same as the solution for direct and indirect income coefficients (partial income multipliers) in the basic input–output model.
Tourism employment multiplier
The tourism employment multiplier results from the following expression (Archer, 1976)

where Ei indicates the direct and indirect employment generated per unit (€) of turnover by the ith business category of the region (direct and indirect employment coefficient); and the other symbols are as defined in equation (1).
The direct and indirect employment coefficient is calculated with the following formula (Archer and Jones, 1977)

where Si indicates the number of employees in the ith business category; Ea indicates direct and indirect employment coefficient for business category a; and the other symbols are as denoted in equation (2). Likewise with income, values of Ei for all business categories (economic activities) can be derived through the basic input–output model solution, and in particular

where e indicates the column vector (n × 1) of direct and indirect employment coefficients; and s indicates the column vector (n × 1) of direct employment coefficients. 6
Data collection and analysis method
Data collection
Business data were collected from a business survey conducted in December 2011, April–December 2012 and September 2013 by the field researcher via personal interviews. The survey began with businesses that satisfy tourist demand directly and are located in the areas mentioned in the diaries/questionnaires of the visitor expenditure surveys. The businesses were asked – among others – to name their local suppliers and their locations. These suppliers were surveyed in turn and asked to report their local suppliers and so on. Greater emphasis in the selection of suppliers was put on those establishments and business categories that received the most mentions. Lastly, towards the end months of the survey, data were collected from those businesses that meet local demand. These were mainly chosen from locations where the majority of employees at businesses directly or indirectly affected by tourist demand was residing.
In total, 443 businesses 7 agreed to complete the questionnaire and 98 refused, giving a response rate of 81.89%. Similar surveys in other studies have produced response rates of 55%, 61% and 64% (Archer and Jones, 1977), 89% (Slee et al., 1997) and 92% (Milne, 1987) using the personal interview method, 61% (Stoeckl, 2007) using self-administered questionnaires to businesses, and 52% (Crabtree et al., 1994) where the data collection method is not specified. The completed questionnaires cover 46 locations, with most coming from the city of Kalamata (regional capital). Furthermore, as given in Online Appendix, Table A1, most pertain to sole proprietor businesses (63.66%), were answered by the owners (89.16%) and completed based on informal records and estimates (87.58%). The latter was the case in the majority of the low-revenue businesses where formal records were kept by external accountants. As such, information was extracted from their ledgers and computer files as well as from their estimations where data were unavailable. In contrast, tax-accounting documents and financial statements were used in high-revenue businesses. In both cases, the personal interview method ensured that all questions were thoroughly answered, and a sense of confidentiality was created between the field researcher and the respondent.
The estimation of induced effects was based on two surveys. Firstly, secondary data on households’ expenditure pattern were used from ELSTAT’s 2011 Household Budget Survey (HBS). Secondly, an expenditure pattern survey (EPS) was conducted on tourism business employees who lived in the region only for the duration of their employment. These employees tend to spend a smaller part of their income in the local economy, so that their expenditures towards local businesses differ (are smaller) than those of permanent residents. Not taking the above parameter into account can lead to a larger estimate of induced effects and, by extension, of total multipliers (Stynes, 1999). To save resources (time and money) and avoid the practical difficulties of such a survey, it was decided that the relevant questionnaire be distributed to the CN resort’s tourism businesses, which employ a good number of non-residents. The survey was conducted over the course of 2012 and was carried out in cooperation with the CN Human Resources Department, which distributed the questionnaire 8 only to those employees who were not local residents and worked at the resort’s businesses in 2011. From a total of 132 employees, 126 questionnaires were returned by the department, of which 112 were properly completed and subsequently used. The overall usable response rate (84.85%) implies that the sample is representative. More specifically, 62.89% of the sample were male, 55.08% between 20 years and 29 years old, and 47.24% employed for 3–6 months, with the corresponding percentages for all 132 employees being 62.50%, 56.25% and 48.21%, respectively.
Analysis
Businesses directly or indirectly affected by the four sport tourism activities were distributed among 36 economic activities, largely based on ELSTAT’s statistical classification (NACE Rev. 2), to construct the intermediate demand and primary input matrices. Cost payments for non-local goods and services, as well as factor payments to individuals and businesses outside the region, were treated as imports in the primary input matrix. The other leakages of equation (2) (Wh, Wtw, Ptp and Ftf) were calculated based on the amounts reported by the respondents and the existing rates to derive net wages and salaries, net profits and net rents. Furthermore, net wages and salaries were separated between those earned by (a) permanent residents and (b) non-residents who lived in the region during their employment. The above two matrices led to the production of the input coefficient matrix, and consequently the Leontief inversion matrix, from which the economic activities’ direct and indirect coefficients of income and employment were derived.
Regarding induced effects, it was necessary to compute the values of (a) c, (b) Zi and (c) Yi and Ei for the 12 HBS expenditure categories. The average propensity to consume was calculated using secondary data from the 2011 HBS and was c = 0.837. The Zi values were, by necessity, estimated by the researchers based on their judgement and knowledge gleaned from the business survey, since data are not available on this subject. Admittedly, this is a subjective process, posing a limitation to the study. To tackle this subjectivity, a sensitivity test for different values of Zi was carried out. The test revealed that the variations in the resultant tourism multipliers were not great (see Table A5 in the Online Appendix), and as such, the estimated values of Zi were adopted in our analysis. Lastly, Yi and Ei were computed by incorporating data from all businesses that met local demand in equations (2) and (7). 9
The induced income and employment coefficients, and subsequently the total multipliers, for all economic activities were then derived based on expressions (1) and (6). However, for those economic activities where a part of the generated income went to non-residents, a different approach was utilised to calculate total income multipliers. More specifically, the part of Yi that went to permanent residents was multiplied by the expression

where Yir indicates the part of Yi that went to permanent residents; and Yinr indicates the part of Yi that went to non-residents.
By utilising this approach, a more conservative estimation of total income multipliers can be achieved in those economic activities where non-residents are also employed (see Table 2).
Induced effects and total income multipliers in tourism-related economic activities employing non-residents.
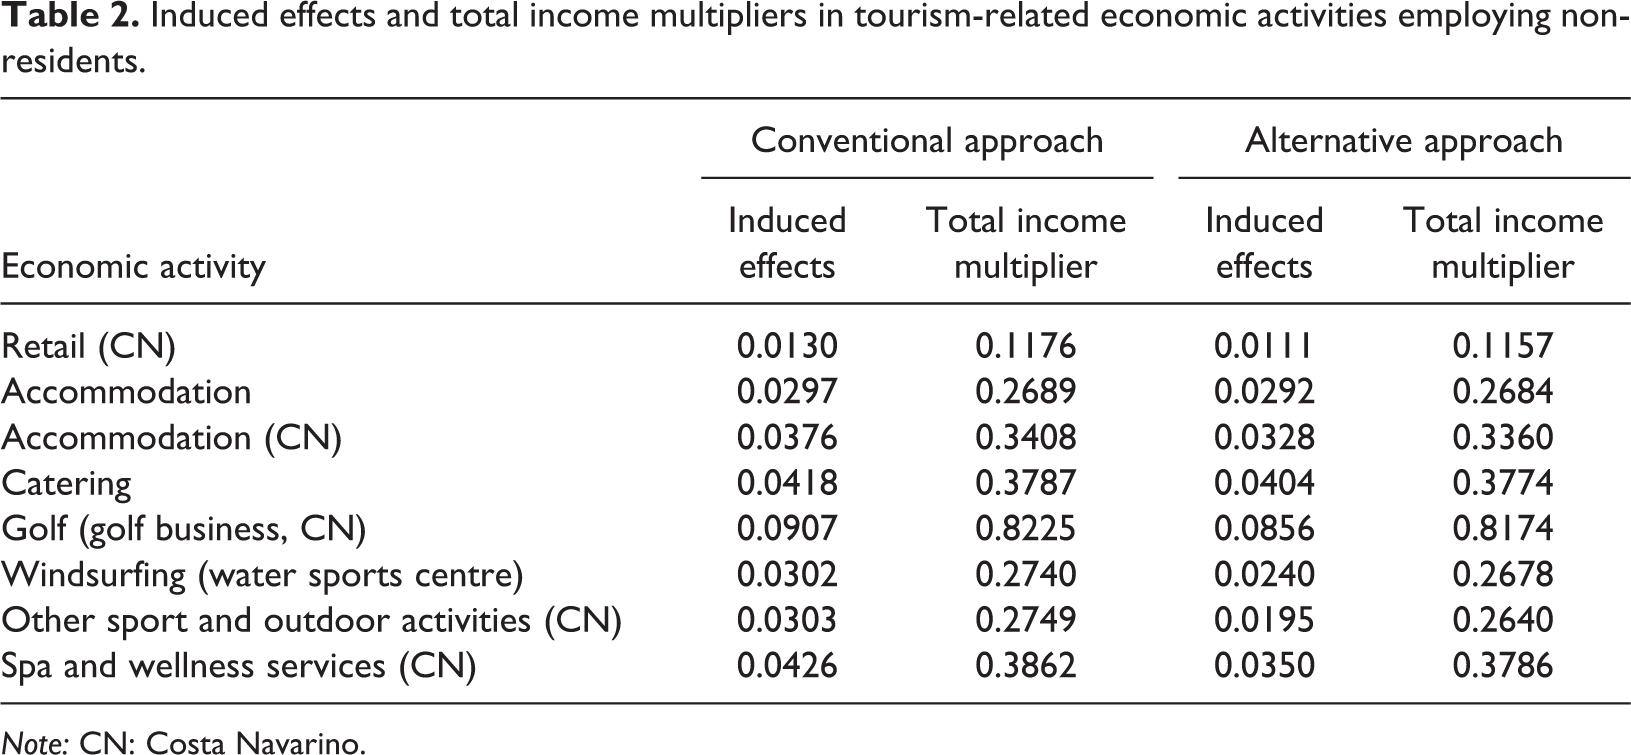
Note: CN: Costa Navarino.
Results
Total income and employment (unstandardised and standardised 10 ) multipliers for each of the 36 economic activities are presented in the Online Appendix (see Tables A2 to A4). The visitor expenditures that resulted from the four sport tourism activities (see Drakakis and Papadaskalopoulos, 2014) were therefore multiplied by the corresponding total multipliers to assess overall income and employment (unstandardised/standardised) generation in the local economy.
Table 3 clearly presents that golf had the biggest effect on income by far, followed by windsurfing, horse riding and scuba diving. However, when we look at the generated income per visitor and per person-night, we see that scuba diving replaces horse riding in third place and windsurfing in second, respectively (in both approaches for calculating visitor expenditures). The above indices were used to address the limitation arising from the fact that the number of total visitors and total person-nights refer to different years (2011 for golf, 2012 for windsurfing and horse riding and 2013 for scuba diving). Using these indices, we isolate the impact of that number on the results and apply a more suitable criterion for a direct comparison of the above activities.
Effects on income by the four sport tourism activities.
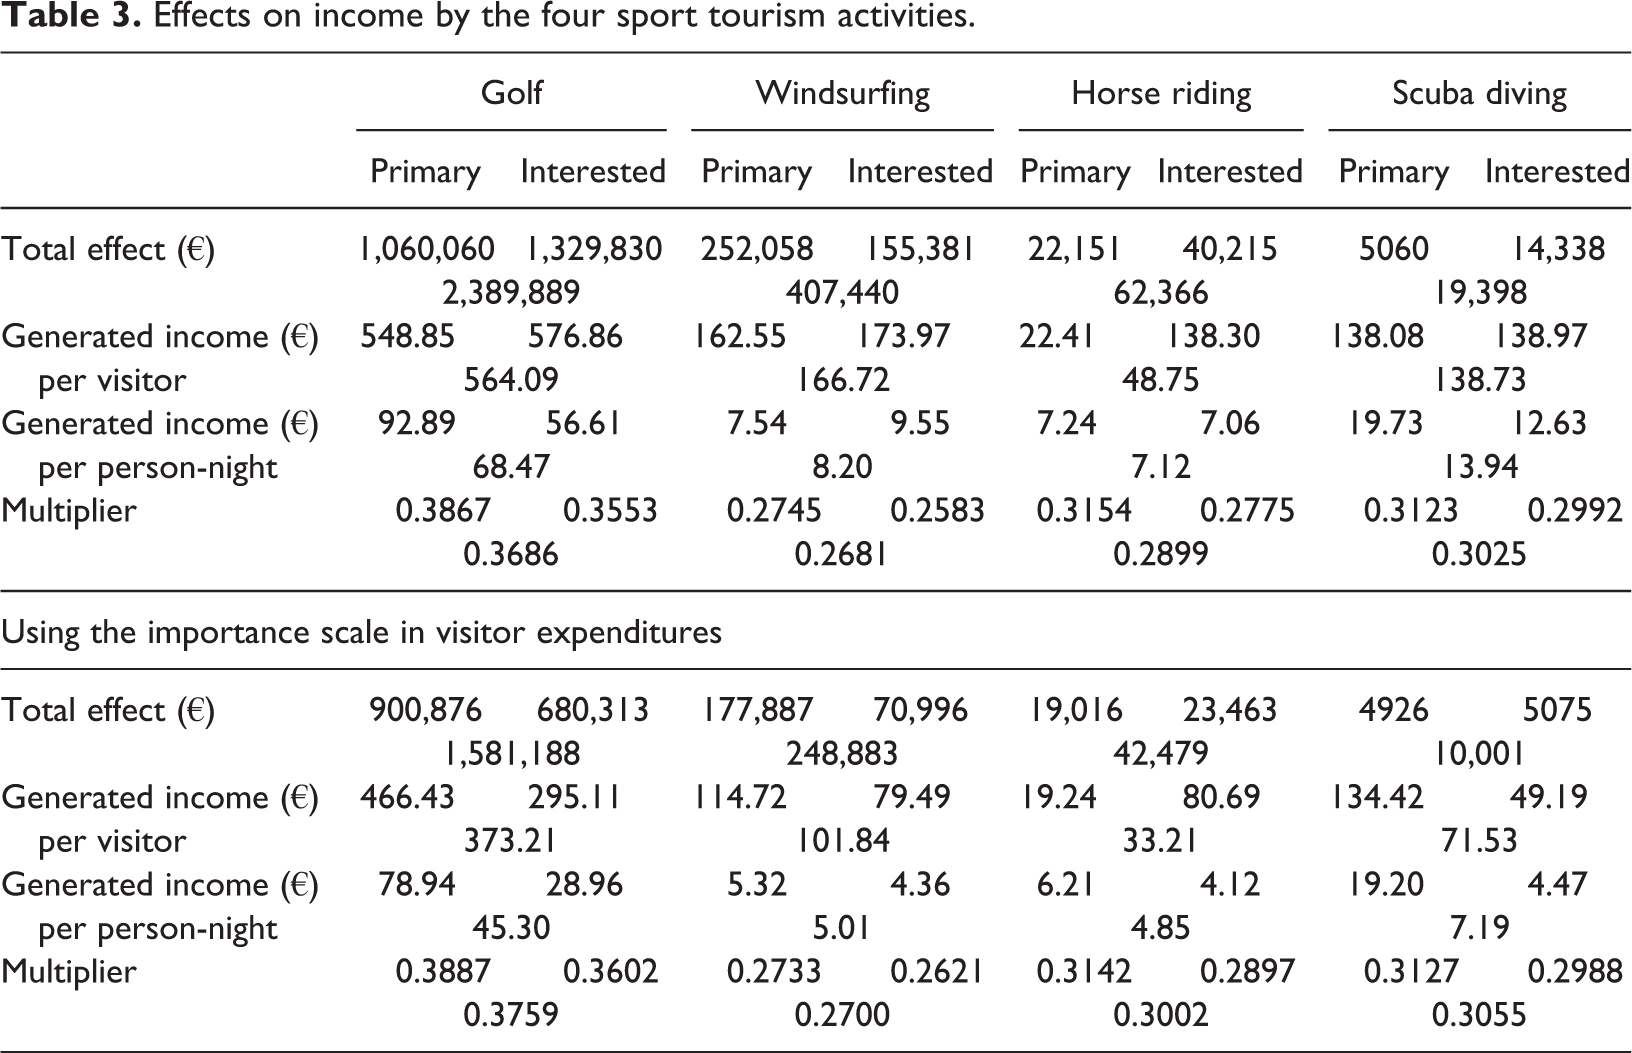
There are no general conclusions to be drawn in regard to the contribution of the two typologies. Which contributes more to income depends on the activity, the approach for calculating visitor expenditures and the comparison criterion (total effects, effects per visitor, effects per person-night) employed. Nevertheless, the data in the table show that in all the activities the average tourist interested in sport generated more income units than the average primary sports tourist per visit, when calculating expenditures without the importance scale. In contrast, the average primary sports tourist generated more income per person-night (or day) in all of the activities, when using the alternative approach.
Table 3 also presents the tourist and tourism multipliers. It is clear that in all the activities and regardless of the approach used for visitor expenditures, primary sports tourists have a propensity for generating greater effects on income in the local economy. Moreover, the highest tourism multiplier comes from golf. Thus, every euro spent by tourists engaging in this activity generated more income units than the other three. In particular, about €0.07 more than scuba diving, €0.08 than horse riding and €0.10–0.11 than windsurfing. These differences also indicate the ranking of the above three activities in terms of the size of their multiplier.
The total effects on employment (unstandardised or standardised) are presented in Table 4. 11 As in the case of income, the biggest effects were generated, respectively, by golf, windsurfing, horse riding and scuba diving, using both approaches. In regard to typology, there are again no general conclusions on which of the two contributes the most, as this depends on the activity and the approach used. However, when we examine the tourist multipliers, we see that primary sports tourists exhibit higher multipliers in every case, meaning that they are more effective in generating employment.
Effects on employment (unstandardised or standardised) by the four sport tourism activities.
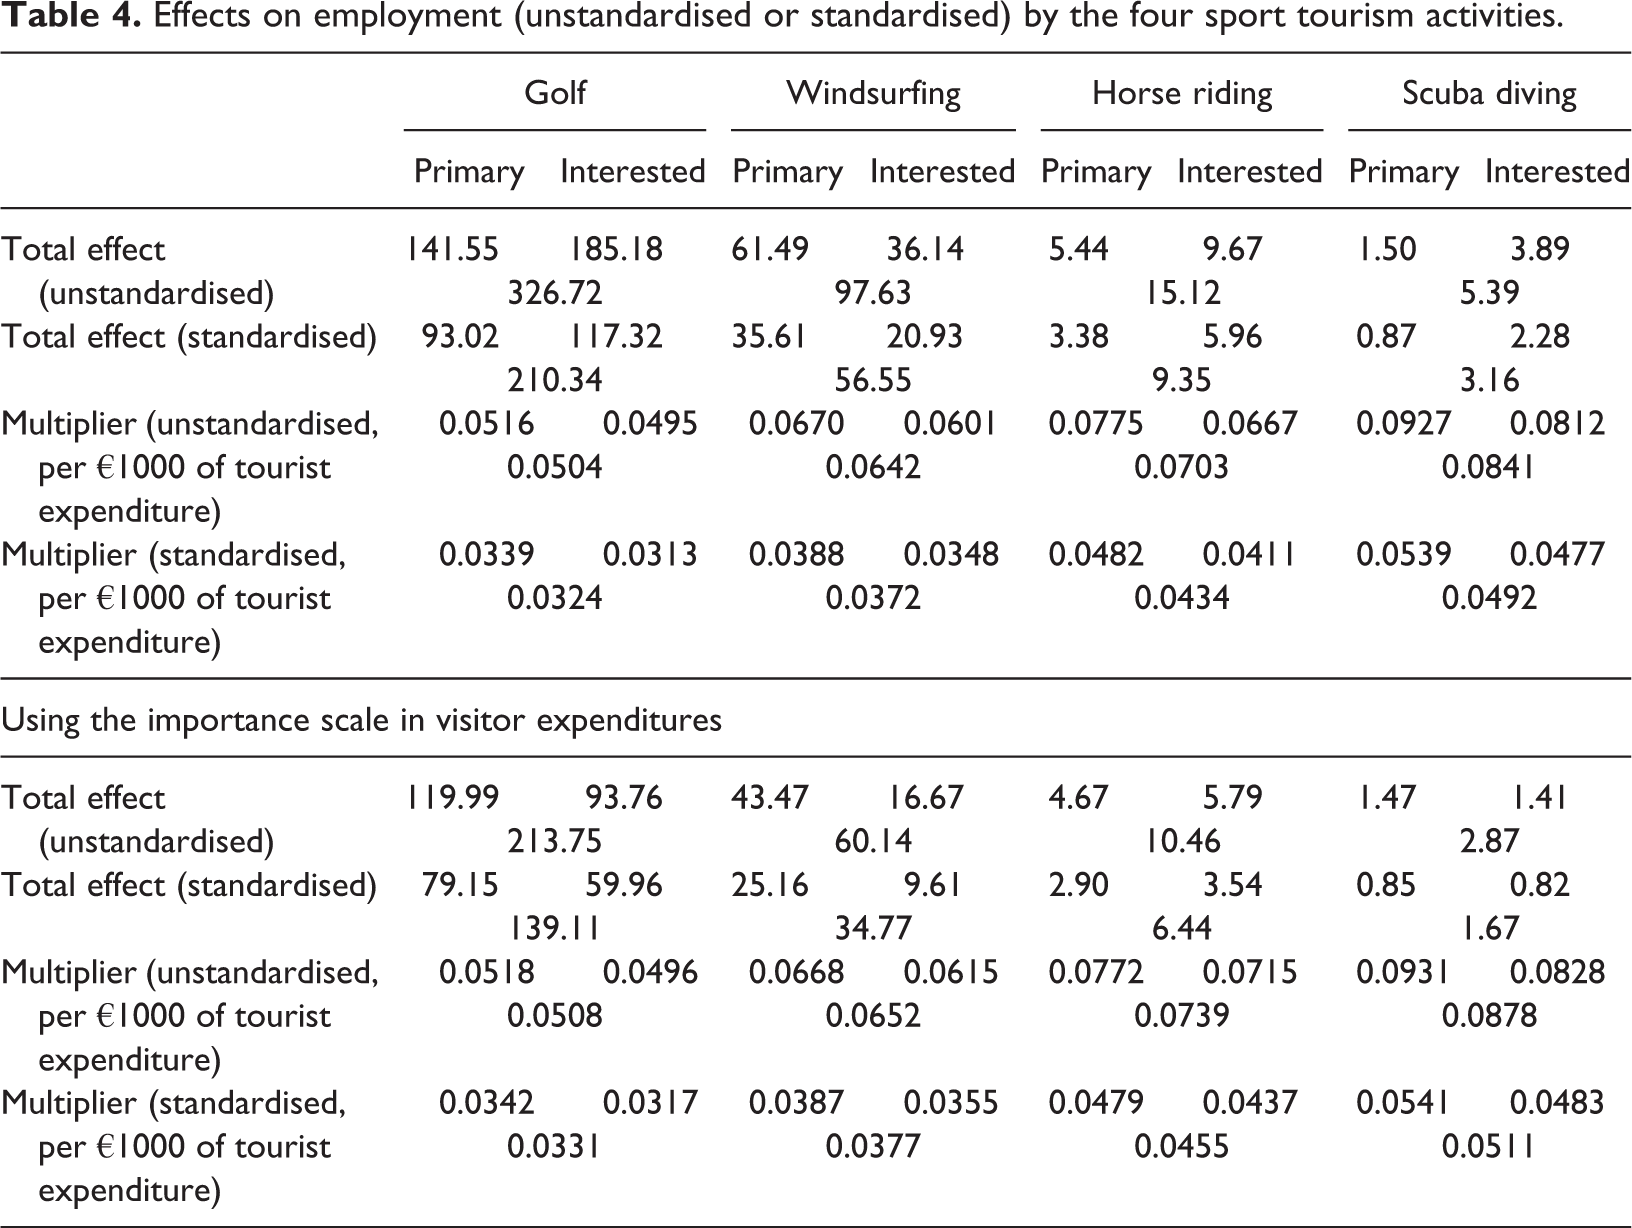
Regarding tourism multipliers, scuba diving has the highest. This is due to the expenditure pattern of tourists engaging in this activity, but also to the fact that dive centres have a higher total employment multiplier (unstandardised or standardised) than the golf business, the water sports centre and the riding centres (see Tables A3 and A4 in the Online Appendix), where a significant proportion of tourist expenditures is concentrated. Tourism multipliers in horse riding and windsurfing follow in that order, while that of golf comes in last place (in contrast to its income multiplier, where it comes in first).
Discussion
This article investigated the economic impact and multiplier effects of four sport tourism activities (golf, windsurfing, horse riding and scuba diving) in terms of income and employment generation on the local economy of the south-western Greek region of Messinia. By comparing their total effects, we ascertained that golf contributed considerably more than the other three activities, both in terms of income and employment (unstandardised or standardised). However, as total effects are influenced by visitation data, effects per visitor and per person-night were used in the case of income, where again golf generated the largest impacts. 12 This is attributed to golfers’ higher average expenditure per visit and day, as presented in Table 1, confirming previous literature that tourists engaging in this activity present a high-spending profile, be they active golf tourists (Haydu and Hodges, 2002; Hennessey et al., 2008; Shani et al., 2010; Stynes et al., 2000) or golf event visitors (Dixon et al., 2012; Gelan, 2003; Tassiopoulos and Haydam, 2008). Golf’s large contribution to income is also demonstrated by its having the highest tourism multiplier, though this is not the case when it comes to employment.
The size of a tourism multiplier depends largely on the economic behaviour of visitors and the businesses involved (Baaijens et al., 1998). It is desirable that the majority of visitor expenditure is concentrated in economic activities with high multipliers. In our case, most of the expenditures (60–86%) in all four activities were allotted to accommodation, catering and sport tourism businesses (see Drakakis and Papadaskalopoulos, 2014). This is consistent with other studies in active sport tourism where participation fees are required (Ditton et al., 2002; Murphy and Bernal, 2008; Stynes and Sun, 2001; Stynes et al., 2000). However, the two hotels in CN where the majority of golfers stayed, as well as the golf business, have substantially higher total income multipliers than the smaller lodgings and sport tourism businesses, respectively (see Table A2 in the Online Appendix), thus giving golf the highest tourism multiplier. The above departs from the general consensus in tourism literature in which large tourism enterprises tend to have lower income multipliers than smaller firms which are more closely tied to the local economy, as evidenced in tourism studies examining multipliers at the firm scale (Liu and Var, 1982; Milne, 1987, 1990, 1992). This contradiction stems from the resort’s policy for hiring (more than 1000 residents from the area are employed when at full capacity) and procuring of goods and services locally.
On the contrary, golf exhibits the lowest tourism employment multiplier. Although CN employs a large number of staff, its accommodation and golf businesses have lower total employment multipliers than the corresponding smaller firms, except for the water sports centre which creates very weak linkages (see Tables A3 and A4 in the Online Appendix). This is because the smaller operations have a greater propensity to generate employment at the direct level (which comprises the larger part of the total multiplier), meaning that they are more labour-intensive. Indeed, Almsarif et al. (2015) found in their study that small firms in the service sector need to increase the number of employees at a faster rate than large businesses, when sales increase. Milne (1987, 1990, 1992), moreover, has indicated that small tourism firms have higher employment multipliers than the larger ones of the same sector.
Based on Perroux’s theory (1955), golf displays all of the characteristics of a propulsive activity. Firstly, it incurs large impacts on income and employment, as well as on tourism revenues/output of local businesses. These impacts, furthermore, will be substantially augmented with the advent of the two new golf courses (a 36-hole course is already under construction), which will establish the region as a golf destination. Secondly, it has improved accessibility to the region with the increase of flights from more European countries and contributed to the significant extension of the tourism season, thus generating external economies for other tourism activities. Lastly, the increased and upscale tourist demand created by this activity prompted a concentration and an upgrade of tourism businesses in the surrounding area. For its part, the resort providing this propulsive activity can be regarded as a growth pole. Given the scope of its role in the region’s tourism development, not only does it develop significant linkages with local sectors due to its policy for local sourcing but it is also embedded in – and not detached from – local society (see Drakakis et al., 2017 for more detail). While many studies argue that hotel resorts often incur limited economic and negative social impacts (e.g. Brenner and Aguilar, 2002; Mbaiwa, 2005; Shaw and Shaw, 1999), this study contends that a big resort can act as a pole of tourism development, on the condition that it intends to forge strong relationships with the local economy and community.
The second aim of this article was to assess the tourist multipliers of primary sports tourists and tourists interested in sport, something that – to the best of our knowledge – has not been investigated in relevant studies on active or event sport tourism. From a comparison of the multipliers, we deduce that primary sports tourists tend to generate, in every instance, larger effects on local income and employment. This is due to their expenditure pattern, mainly that they spent most of their money on accommodation and sport activities, where the total multipliers of the respective economic activities are relatively high. Therefore, local agencies responsible for shaping tourism policy in the region should target or focus more on this typology, if they are seeking to increase income or employment. For example, advertising in sports magazines for heavy spenders as suggested by Shani et al. (2010) or generating positive word of mouth among dedicated sports tourists (Hennessey et al., 2008) could be well-suited strategies for attracting primary sports tourists.
Alternatively, increasing income and employment could be achieved by redirecting tourist demand (that of primary and interested) towards goods and services provided by businesses (economic activities) that generate large multiplier effects. This is, undoubtedly, a challenging task, as the expenditure pattern depends almost entirely on the tourists themselves. Given the appropriate motivation, however, their spending could be nudged towards desirable economic activities. One recommended strategy would be to provide tourists with incentives to engage in relevant activities (such as windsurfing, scuba diving and pleasure boating in our case) that generate large impacts. Such a strategy would, of course, require a degree of cooperation between the businesses involved, which could be achieved via the creation of a network or cluster in sport tourism (Wäsche and Woll, 2010, 2013; Wäsche et al., 2013) or tourism more generally (Alberti and Giusti, 2012; Novelli et al., 2006). Enhancing income and employment can also be achieved by reducing the leakages from the local economic system. The creation of a tourism cluster, as mentioned above, could bolster inter-sectoral linkages and, by extension, the total multipliers as it also helps contain leakages (Gollub et al., 2003).
Conclusion
Much of the literature on the economic impact of sport tourism is devoted to events, which have been shown to stimulate economic development and regeneration for host cities and destinations (e.g. Giampiccoli et al., 2015; Henderson, 2017; Huang et al., 2014). Comparatively little research is dedicated to active sport tourism. This study contributes to this end, by additionally utilising the propulsive activity concept from regional science’s growth pole theory. This concept may well be applied by relevant studies seeking to investigate whether active sport tourism can play a propulsive role in its region, as golf tourism does in our case. Apart from the fulfilment of all characteristics of such an activity, future studies could also examine if there is a positive correlation (and to what degree) between the sport tourism activity in question and the region’s economic or tourism variables, based on time series data.
The current study partially validates the general consensus in tourism literature that small tourism firms have higher total multipliers than their larger counterparts. While the above was principally corroborated in the case of employment, as small firms are more labour-intensive, it was contradicted in the case of income due to the resort’s policy for local hiring and sourcing. Such a policy is beneficial not only for the regions but for the businesses themselves as they are more easily integrated into their local community.
Regarding managerial implications, this study suggests that sports tourism marketers should target or focus more on primary sports tourists, if they are aiming to increase income or employment in their region. This typology displays higher tourist multipliers, meaning that it is more effective in income and employment generation. Nonetheless, the results of this study relate to a specific destination, and considering the paucity of research on this topic, they should be cautiously generalised and be validated with studies at other destinations.
As to methodology, the article proposes an alternative approach for estimating induced effects in economic activities where non-residents are also employed. Admittedly, this approach requires an EPS of tourism business employees to be conducted. However, the overestimation of induced effects as stated by Stynes (1999) is addressed, resulting in more conservative estimations of total income, and subsequently employment, multipliers.
In closing, all of the limitations of this study need to be mentioned. Firstly, the visitor expenditure surveys were conducted, by necessity, in different years, so that the effects of each activity do not pertain to the same period. To isolate the impact of visitation data on the results, effects per visitor and per person-night (in the case of income), as well as tourism multipliers, were used, since they constitute a more suitable criterion for a direct comparison of the activities. Secondly, the Zi values used in our analysis were, perforce, estimated by the researchers. The sensitivity test, though, revealed that the variations in the resultant tourism multipliers were not great. Lastly, the ad hoc model, which is used to estimate effects, adopts the restrictive assumptions of input–output analysis, the most important of which is the existence of constant input coefficients.
Supplemental material
Supplemental Material, supplement_material - Multipliers and impacts of active sport tourism in the Greek region of Messinia
Supplemental Material, supplement_material for Multipliers and impacts of active sport tourism in the Greek region of Messinia by Panayiotis Drakakis, Athanasios Papadaskalopoulos and Dimitrios Lagos in Tourism Economics
Footnotes
Declaration of conflicting interests
The author(s) declared no potential conflicts of interest with respect to the research, authorship, and/or publication of this article.
Funding
The author(s) received no financial support for the research, authorship, and/or publication of this article.

Supplemental material
Supplemental material for this article is available online.
Notes
References
Supplementary Material
Please find the following supplemental material available below.
For Open Access articles published under a Creative Commons License, all supplemental material carries the same license as the article it is associated with.
For non-Open Access articles published, all supplemental material carries a non-exclusive license, and permission requests for re-use of supplemental material or any part of supplemental material shall be sent directly to the copyright owner as specified in the copyright notice associated with the article.
