
Abstract
This study analyzes the impact of economic policy uncertainty (EPU) on the performance of US tourism firms using a sample of 296 publicly traded tourism companies from 2000 to 2018 with a sample of 3068 firm-year observations. Estimation results of panel regressio tests based on the system-generalized method of moments indicate that EPU has a negative impact on return on assets (ROA), return on equity (ROE), and Tobin’s Q. Our results are consistent for different variable specifications. We also find that firm size and leverage play a moderating role in the relationship between EPU and firm performance. Panel quantile regression results show that the impact of EPU on US tourism firm performance is asymmetric. Specifically, low-performing (25% quantile of ROA and ROE) firms are less affected by EPU, and for the case of Tobin’s Q, EPU does not affect firms with a high growth opportunity (100% quantile of Tobin’s Q).
Keywords
Introduction
One of the important business strategies is to determine how to respond to uncertainty (Köseoglu etal., 2013). In fact, although global economic growth seems to have been steady over the last years, 1 uncertainty has increased. 2 This phenomenon is especially pronounced in the tourism industry whose firm-specific characteristics make it extremely sensitive to uncertainty (Akron etal., 2020; Demir etal., 2019).
Uncertainty can be understood from the operative, regulatory, and financial perspectives. Nevertheless, what the 2008 global financial crisis has demonstrated is that even in periods of economic calm (Felipe and Estrada, 2020), uncertainty over the economic policy decisions of politicians, governments, and regulatory bodies can appear. These decisions have a direct effect on the economic environment in which firms operate (Di Giorgio, 2014). In other words, the financial decisions of firms are affected by the content and uncertainty of government policies (Iqbal etal., 2020).
However, finding an appropriate proxy to measure the uncertainty of economic policy is difficult. Previous research has relied on diverse measures of uncertainty, such as stock market volatility, the volatility index, the economic growth rate, and political risks. Following that path, Baker etal. (2016) developed the economic policy uncertainty (EPU) index to provide a more robust measure of uncertainty. This index counts the number of articles in 10 leading US newspapers that include the terms “economic” and “uncertain,” in conjunction with at least one of the following: “Congress,” “deficit,” “Federal Reserve,” “legislation,” “regulation,” or “White House” (for the United States). The index reflects the uncertainty over who will make economic policy decisions and what actions will be taken and when. Figure 1 shows the EPU index in the United States from 2000 to 2018. The index increases significantly with the September 11, 2001 attacks, the debt ceiling dispute in 2011, and Donald Trump’s election in 2016.

Economic policy uncertainty index (United States). Source: https://www.policyuncertainty.com.
Since its introduction, the EPU index has been considered the main proxy for uncertainty. It has increasingly been used in the corporate finance literature and in the hospitality and tourism field (Akron etal., 2020; Demir and Ersan, 2018). On the one hand, prior literature has examined the effects of EPU on stock returns, gold prices, Bitcoin, macroeconomic variables, house prices, exchange rates, and several other variables. On the other hand, the literature also explores how EPU affects the hospitality and tourism industry. What all those previous studies coincide in is that EPU may create difficulties for decision-makers and affect their decisions. In this sense, in times of uncertainty, companies and consumers are likely to fear the possible failures of their decisions and actions (Madanoglu and Ozdemir, 2019).
The interest in studying EPU in the tourism industry is relevant due to the industry’s extremely high sensitivity to uncertainty (Akron etal., 2020; Demir etal., 2019). Uncertainty causes people to delay consumption until times are more certain, as a hedge against possible economic risks in the future (Madanoglu and Ozdemir, 2019). Nevertheless, what influence does EPU have on the financial performance of tourism companies? In times of high perceived uncertainty, consumers are not prone to increase their expenses and companies tend to freeze their investment decisions, which therefore slows down their financial performance.
In the context of tourism firms, a look on the demand side is needed. Since tourism industry is inherently more likely to be affected by consumers’ precautionary behavior, they can easily limit, postpone, or refrain from spending on travel and tourism, restaurants, or recreation activities in the face of uncertainty (Chen, 2015b). This behavior is rational given that people cannot easily forgo spending on necessities such as food, shelter, and health care. Focusing on the offer side, uncertainties related to economic policy will discourage firms from making investment decisions (Akron etal., 2020). This can curtail growth opportunities, resulting in tourism firms being unable to meet the demand. Additionally, as tourism firms incur more fixed costs, their performance will decrease. Accordingly, a negative impact of EPU on US tourism firm performance is expected.
Moreover, the levels of both long- and short-term debt in tourism firms have been traditionally high (Singal, 2015). Hence, when economic uncertainty arises, firms’ financial margin will be highly affected, consequently reducing the firm’s financial performance.
Although there is a fast-growing literature on the impact of EPU on tourism demand (Demir and Gozgor, 2018; Wu and Wu, 2019), there is still limited evidence on the effect of EPU on firm-level decisions. This study therefore examines the impact of EPU on 296 tourism firms listed in the United States for the period from 2000 to 2018 with a total of 3068 firm-year observations. It is expected to make several contributions to the tourism research literature.
First, unlike the study by Madanoglu and Ozdemir (2019) that was limited to hotels, our investigation covers four tourism segments: food and beverage, lodging, recreation, and travel and tourism. Therefore, we will be able to provide complete evidence on the effects of EPU on a range of tourism sectors. In addition, to offer a more comprehensive picture of the effects of EPU on the US tourism industry, we use various measures of financial performance, such as profitability (return on assets, or ROA), return on equity (ROE), and one stock market-based indicator related to the long-term growth opportunity (Tobin’s Q) (Chen, 2010b, 2015a; Chen etal., 2012).
Second, to test the relationship between EPU and tourism firms’ performance, we use a system-generalized method of moments (system-GMM) panel data technique. Traditionally, tourism research has focused on fixed effects and random effects models. Although they can control for unobserved heterogeneity, these models do not account for some critical issues, such as dynamic endogeneity and simultaneity, which are common in panel data estimations and originated by unobserved firm characteristics.
Third, we examine the moderating effect of size and leverage on the effect of EPU on firm performance. On the one hand, since the tourism industry consists of companies of different sizes, we test whether the ability to adjust the activity in larger companies is more difficult when uncertainty arises (Demir etal., 2019). On the other hand, since tourism firms are traditionally more indebted (Akron etal., 2020; Demir etal., 2019; Singal, 2015), we analyze its impact on the EPU-performance relationship.
Lastly, we utilize quantile regression test to analyze the effects of EPU on tourism firm performance at different quantiles of firm performance measures. Quantile regressions have been increasingly used in hospitality and tourism studies (e.g. Akron etal., 2020; Assaf and Tsionas, 2018; Chen, 2016; Chen etal., 2018). Note that unlike least squares estimators that are based on the conditional mean of data dispersions, quantile regressions can deal with information about different parts of data distribution including the tails (Chiang etal., 2010). This issue is particularly relevant for our study sample from 2000 to 2018 given that the terrorist attacks of September 11, 2001, and the 2007–2008 financial crisis significantly deteriorated US tourism firm performance (Chen, 2010a). Specifically, by utilizing quantile regression analysis, we can account for the tail information of tourism firm performance.
Furthermore, the quantile regression analysis enables us to estimate the relationship between the dependent variable and independent variables at any specific quantile. In other words, it can show how EPU influences different quantiles of US tourism firm performance. Analysis results can reveal interesting findings related to the links between EPU and tourism firm performance, particularly whether the impact of EPU on US tourism firm performance is asymmetric or state-dependent (i.e. the effects of EPU on US tourism firm performance vary in different quantiles).
The rest of the article is organized as follows. The second section presents previous studies of the impact of EPU on the tourism industry. The third section presents the data and methodology. The fourth section describes and discusses the results. The fifth section concludes the article and suggests policy implications. The concluding section points out some limitations of the study and directions for future research.
Literature review
EPU has recently attracted rising interest in the tourism and hospitality literature. The number of studies examining the possible negative effects of EPU on the industry has increased rapidly. One strand of this literature centers on the impact of EPU on tourism demand. In one of the first studies in the field, Dragouni etal. (2016) document that EPU shocks have a moderate effect on outbound tourism when the level of EPU is low, but when EPU becomes significantly high, consumer demand for holidays abroad drops. The SARIMA (seasonal autoregressive integrated moving average)-type models of Chatziantoniou etal. (2016) show that for Greece, which is highly dependent on tourism income, EPU is an important determinant to attract tourists from the United States.
The study by Işık etal. (2020) focuses on tourist arrivals from Mexico and Canada to the United States. It shows that EPU has a negative effect on the number of visitors from those two countries to the United States. However, Canadian tourists are more sensitive than Mexican tourists to uncertainty. Likewise, the negative effect of EPU is documented in Ongan and Gozgor (2018) for Japanese tourists traveling to the United States. Chen etal. (2020) consider the effect of EPU on tourist arrivals from Mainland China and Japan to Taiwan in trough and peak periods. EPU is therefore found to decrease demand among Mainland Chinese and Japanese tourists in trough periods; however, this negative effect turns insignificant in peak periods.
In a multicountry panel data setting, Demir and Gozgor (2018) investigate the effect of EPU on outbound tourists in 15 countries. The fixed effects and the bias-corrected least square dummy variable estimation methods show that EPU has a significant negative effect on international departures. Moreover, the lag effect of EPU is also documented. Wu and Wu (2019) examine the interrelationship among EPU, international tourist arrivals, and international tourism receipts in Brazil, Russia, India, and China by using the wavelet analysis based on Granger causality. They show that the relationship between EPU and tourism activities changes in time and frequency domains.
Akadiri etal. (2020) implement a Granger causality test and provide evidence supporting bidirectional, unidirectional, and even no relationship between tourism arrivals and EPU. This implies that the EPU-tourism relationship is country-specific. Singh etal. (2019) explore the impact of country-specific and global EPU on tourist arrivals to the US footfalls. Wavelet-based techniques document that EPU shock has little immediate effect on international tourist arrivals. The country-specific EPU is much more influential than global EPU. Balli etal. (2018) document mixed results in terms of the magnitude of local and global EPU on tourism for the sample countries. The impact of EPU becomes much stronger at peak periods of uncertainty. UK, US, and Canada visitors are more affected by rising uncertainty.
There are also studies showing how EPU affects the financing decision and corporate performance in the tourism industry. Unlike tourism demand models, those studies use firm-level data. By using Smith Travel Research monthly data, Madanoglu and Ozdemir (2019) show that EPU has a negative effect on hotel operating performance in the United States proxied by average daily rate, occupancy, and revenue per available room. Moreover, this negative effect is even higher for hotels that are owned and managed by different entities; luxury hotels are less affected by rising uncertainty. Demir and Ersan (2018) show that stock prices of listed tourism companies in Turkey are negatively affected by EPU in Turkey and Europe.
Likewise, Ersan etal. (2019) find that European and global EPU has a negative effect on travel and leisure companies’ stock returns in Europe. Both studies argue that EPU has a superior forecasting power on stock returns in tourism compared to other macroeconomic variables. For the United States, Akron etal. (2020) show that EPU has a negative effect on the investment activities for 2001–2018. Moreover, the panel quantile estimations document that this negative effect exists only in the lower quantile.
In summary, empirical findings of previous studies that EPU could negatively affect tourism demand and corporate investments of US tourism industry, we propose a rationale for the adverse relationship between EPU and US tourism firm performance.
Data and methodology
Data and variables
The data set includes 296 listed US tourism companies (including food and beverage, lodging, recreation, and travel and tourism) for the period from 2000 to 2018 with a total of 3068 observations. The number of tourism companies according to the subindustries is presented in Table 1. The EPU index provided by Baker etal. (2016) is the main independent variable. It is constructed based on the frequency of articles in the leading newspapers that contain words pertaining to the economy, policy, and uncertainty. The index is built up considering those who set economic policy, how and when those decisions are carried out, and their economic effects. Thus, the index diverges from pure economic slumps, since EPU can rise even if the economy is performing well. 3 Since our study uses yearly firm-level data and Baker etal. (2016) provide monthly updates of their index, the annual variable of EPU is the average of the monthly EPU index within each corresponding year for the United States (EPU) and global (GEPU).
Sample by subindustry.

Source: Thomson Eikon database.
Three variables of firm performance are ROA (net operating income/total assets), ROE (net total income/total equity), and Tobin’s Q (Chen, 2010b; Chen and Lin, 2015; Chen etal., 2012; Iqbal etal., 2020). ROA and ROE are two commonly used performance measures of profitability and quality of earnings; Tobin’s Q is a market-based measure calculated as the ratio of the market value to book value. A higher Tobin’s Q implies a greater future growth opportunity.
Firm size (SIZE), measured as the natural logarithm of total assets, is used as a control variable. Traditional finance literature has found a persistent positive relationship between firm size and financial performance. The rationale is that larger firms are able to better diversify and invest in unrelated business (Díez-Esteban etal., 2016; Hernández, 2020), what makes them more profitable.
The second control variable is the firm leverage ratio (LEV), computed as the ratio of total liabilities to total assets. It is often shown that capital structure is an important determinant of performance in the tourism industry (Demir etal., 2019; Singal, 2015) since tourism firms tend to maintain higher levels of debt than other industries. Moreover, the underinvestment explanation of debt’s role in the tourism industry seems to be prevalent. Thus, we expect that firms that are heavily indebted are less likely to invest regardless of their growth opportunities, which will make them less profitable.
Given that firms’ performance is affected by the general macroeconomic conditions, we include two related variables in the model; the lagged yearly change in GDP (Chen, 2007, 2010; Nenu etal., 2018) and the consumer confidence index (CCI) (in the natural logarithm form) (Chen, 2015a; Demir and Ersan, 2018). Table 2 summarizes the proposed relationships.
Variables definition and expected influence on tourism firm performance.
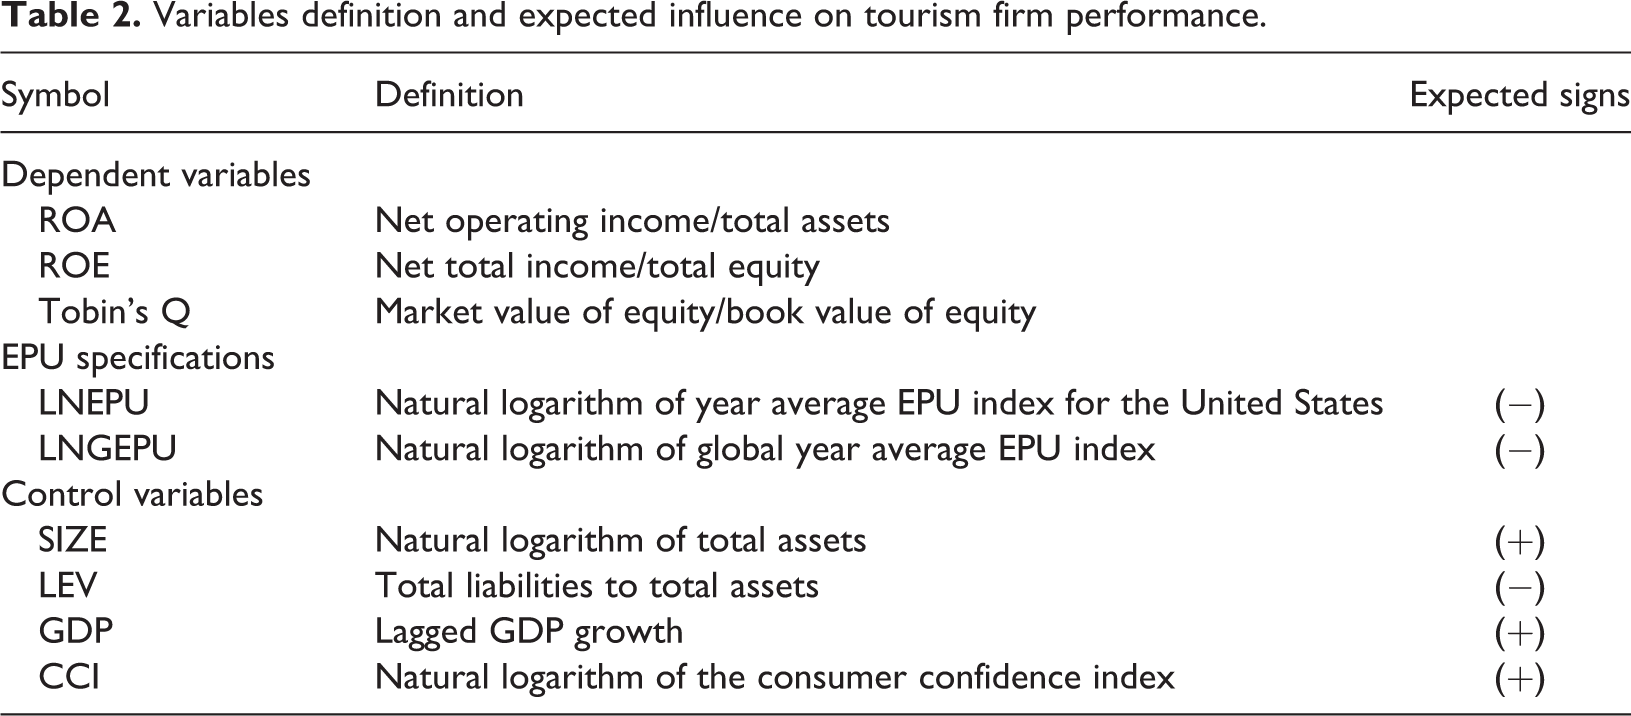
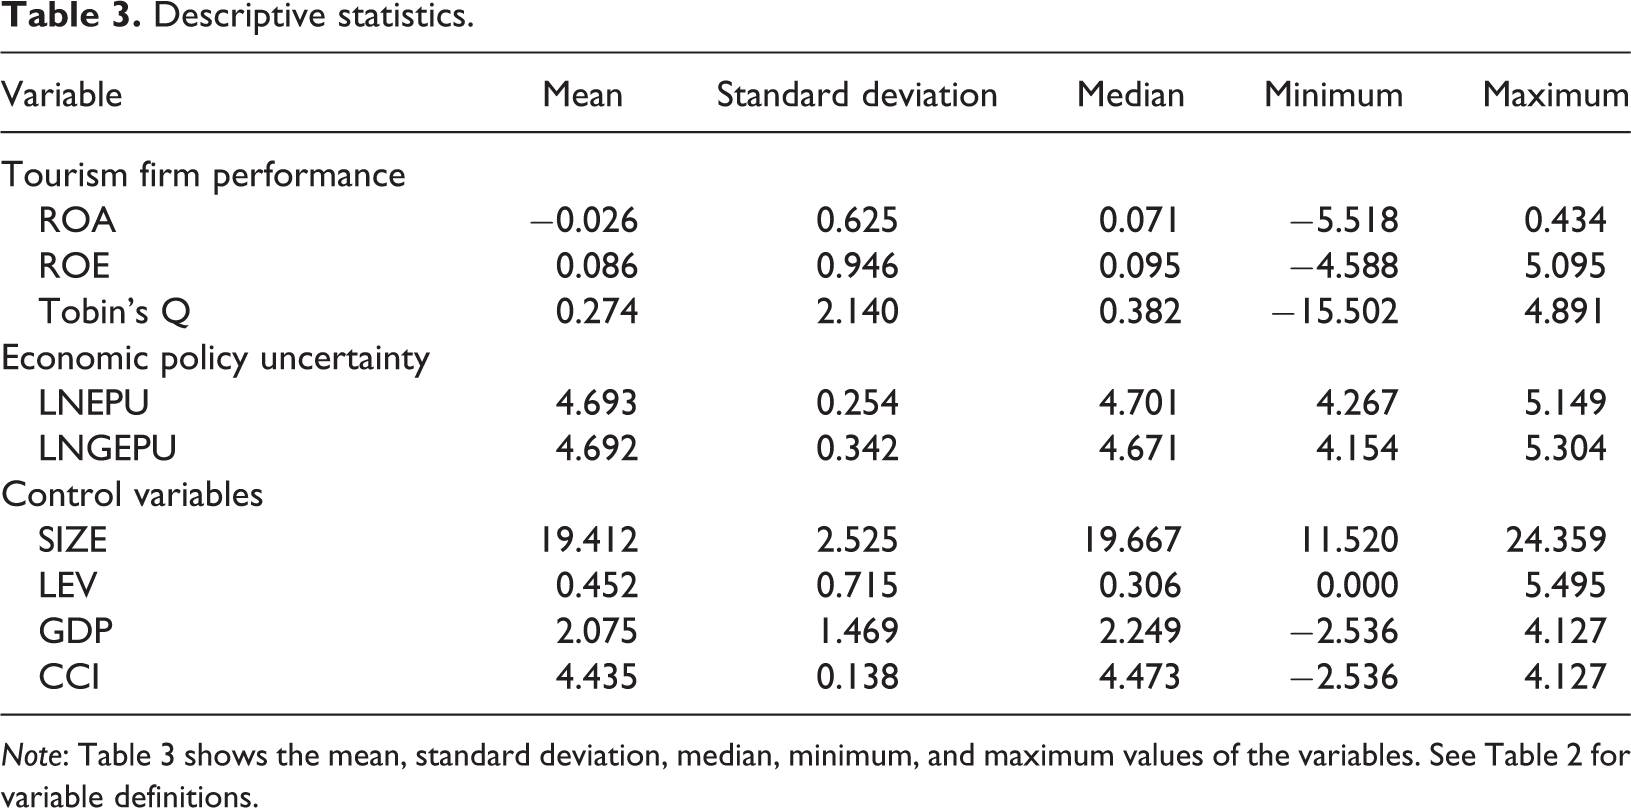
Table 3 presents the descriptive statistics for all variables. Regarding the three measures of firm performance, it is remarkable that the average ROA is −2.6% for the considered period, whereas the other two measures present positive values. Moreover, all measures of firm performance suggest a large spread in their value given the diverse subindustries considered and the crisis period in 2007–2010. Mean EPU values for the US and the global measure are almost the same (4.693 vs. 4.692) revealing that both measures can be informative of the effect of EPU on firm performance. Regarding control variables, our sample consists of companies of different sizes and different capital structures (from debt-free to those with severe financial problems). An additional analysis might be needed to study the moderating role on the relationship between EPU and firm performance.
Descriptive statistics.
Panel regression test model
To examine the effects of EPU on US tourism firm performance, we follow a model specification similar to Iqbal etal. (2020) in performing the following test equation:

where HFP denotes tourism firm performance (ROA, ROE, and Tobin’s Q), i and t refer to company and year, respectively, and
Thus, all models are estimated by using the robust two-step system-GMM methodology (Blundell and Bond, 1998). The lagged dependent variable is included in the estimations using system estimator—an enhanced version of the GMM (Blundell and Bond, 1998; Roodman, 2008). The system estimator improves the fixed effect technique by considering the persistent lag coefficient. Moreover, the system estimator is not influenced by the panel imbalance (Bayraktar, 2019). Therefore, our estimations do not need to show second-order serial correlation in the residuals and use valid instruments (Arellano and Bover, 1995). We report AR(2) p-value to check if error terms do not have a second-order serial correlation. A Hansen test of overidentifying constraints indicates the validity of the instruments.
Moderating role of firm size and capital structure
To investigate the moderating role of firm size and capital structure on the relationship between EPU and firm performance, we perform additional panel regression tests. Based on previous studies (Díez-Esteban etal., 2016; Mahmood etal., 2019), we propose the following equations:


where
The results of this new estimation indicate whether both the independent effects of the considered variables and the interaction between them are significant terms in the estimated regression model. Hence, we may determine in which sense firm size and capital structure affect the relationship between EPU and firm performance.
Quantile regression analysis
A panel quantile regression analysis is also carried out. This approach has been found to be of value in the tourism industry field (Akron etal., 2020; Assaf and Tsionas, 2018; Chen, 2016; Chen etal., 2018) as it provides “an overall assessment of the covariate effects at different quantiles (

where Variable represents explanatory variables. The estimates of

where


Given this model framework,
Empirical test results
Effects of EPU on tourism firm performance
Table 4 reports the system-GMM estimation results based on equation (1). The impact (coefficient) of LNEPU on ROA and ROE is negative and significant at the 1% level and at the 5% level on Tobin’s Q. The effect of LNEPU on ROE is higher than those of ROA and Tobin’s Q. Specifically, the coefficient of LNEPU on ROE is −1.946, −0.594 on ROA and −0.698 on Tobin’s Q, meaning that a 1% increase in EPU has an estimated 1.13% decrease in ROE (a decrease of 0.25% and 0.20% for ROA and Tobin’s Q). 4
Baseline model: The effect of EPU on firm performance.

Note: Numbers in parentheses are the standard deviations. The term g.l. denotes the number of instruments. m1 and m2 represent the test for first- and second-order serial correlation, respectively.
* Significance level at 10%.
** Significance level at 5%.
*** Significance level at 1%.
From a wider perspective, our results confirm those of prior studies (Iqbal etal., 2020) or, in the tourism field, the study by Madanoglu and Ozdemir (2019), who show that EPU has a negative effect on hotel operating performance. Iqbal etal. (2020) also show that the impact of EPU on ROE is higher than that on ROA.
Regarding control variables, the effect of size is not relevant for ROE; it is positively related for ROA and Tobin’s Q. The positive effect of firm size confirms that larger firms perform better because they are more diversified (Díez-Esteban etal., 2013).
The influence of both macroeconomic variables (GDP and CCI) is diverse although, in general terms, they have a positive impact on firms’ performance. This in line with expectations as a growing economy is likely to generate more growth opportunities and increase the demand for tourism companies.
Following prior research (Balli etal., 2018; Iqbal etal., 2020; Singh etal., 2019), we include in our baseline model alternative specifications of EPU, namely, the lag of average EPU index for the United States and average of global EPU index (LNGEPU). Results of these estimations are reported in Table 5.
Alternative EPU specifications.

Note: Numbers in parentheses are the standard deviations. The term g.l. denotes the number of instruments. m1 and m2 represent the test for first- and second-order serial correlation, respectively.
* Significance level at 10%.
** Significance level at 5%.
*** Significance level at 1%.
Test results confirm the negative association between lagged EPU and ROA, ROE, and Tobin’s Q. We can still observe the negative effect of uncertainty on firm performance even after a year. Unlike other studies (Balli etal., 2018; Singh etal., 2019), our results do not show a country-specific EPU effect different from that of global EPU. For the two accounting measures (ROA and ROE), the impact of US-based uncertainty is greater than the impact of global uncertainty. However, in terms of the market-based performance measurement, global EPU has a higher effect than domestic EPU.
Test result of moderating role of firm size and capital structure
We also consider that firm size may moderate the negative relationship between EPU and performance. Table 6 shows the panel regression test results of the moderating role of firm size and capital structure on the relationship between EPU and firm performance. Test results confirm this perspective as the impact of the interaction term between LNEPU and SIZE (LNEPU ×SIZE) on ROA is −0.02 and statistically significant at the 1% level, and the impact of LNEPU ×SIZE on ROE is −1.084 and statistically significant at the 10% level.
The moderating role of size and leverage.

Note: Numbers in parentheses are the standard deviations. The term g.l. denotes the number of instruments. m1 and m2 represent the test for first- and second-order serial correlation, respectively.
* Significance level at 10%.
** Significance level at 5%.
*** Significance level at 1%.
However, we find no significant effect of the interaction term between LNEPU and SIZE on Tobin’s Q.
Furthermore, we test the moderating role of capital structure (leverage ratio) on the relationship between EPU and tourism firm performance. Panel regression test results show that the effect of the interaction term between LNEPU and LEV (LNEPU × LEV) on ROA, ROE, and Tobin’s Q is −0.001, −0.002, and −0.004, respectively, and statistically significant at the 1% level.
Results of quantile regression tests: Asymmetric effects
We perform the panel quantile regression analysis and report the results in Table 7 (ROA and ROE) and Table 8 (Tobin’s Q). Results of quantile regression tests reveal an interesting finding. Table 7 shows that while the negative effect of EPU on both ROA and ROE is statistically significant at the 1% level at the different quantiles, this effect is asymmetric. Specifically, the impact of EPU on ROA at the 50%, 75%, and 100% quantiles is 1.817, 1.809, and 1.730, respectively, significantly higher than that (0.074) at the 25% quantile.
Results of panel quantile regression: ROA and ROE.

Note: Numbers in parentheses are the standard deviations. The term g.l. denotes the number of instruments. m1 and m2 represent the test for first- and second-order serial correlation, respectively.
* Significance level at 10%.
** Significance level at 5%.
*** Significance level at 1%.
Results of panel quantile regression: Tobin’s Q.

Note: Numbers in parentheses are the standard deviations. The term g.l. denotes the number of instruments. m1 and m2 represent the test for first- and second-order serial correlation, respectively.
* Significance level at 10%.
** Significance level at 5%.
*** Significance level at 1%.
Similarly, the impact of EPU on ROE is asymmetric. The estimated coefficients are all negative and statistically significant at the 5% level at the different quantiles. However, the impact at the 25% quantile is 0.624, significantly lower than 2.355 (50% quantile), 2.366 (75% quantile), and 2.609 (100% quantile).
Results of quantile regression tests of the impact of EPU on Tobin’s Q reported in Table 8 also reveal evidence of asymmetry. The estimated coefficients at the 25%, 50%, and 75% quantiles are negative and statistically significant. However, the estimated coefficient at the 100% quantile is negative but not statistically significant. The results suggest that EPU has a strong impact on Tobin’s Q only at the 25%, 50%, and 75% quantiles.
Discussion, implications, and conclusion
This study analyzes the impact of EPU on US tourism firm performance using a sample of 296 publicly traded tourism companies from 2000 to 2018. We utilize the system-GMM panel data technique to avoid the endogeneity issue and apply the quantile regression analysis to analyze how EPU affects different quantiles of US tourism firm performance. Test results reveal several interesting findings. We summarize and discuss those findings and their implications.
First, we find that EPU has a negative impact on US tourism firm performance in terms of ROA, ROE, and Tobin’s Q. Our results are consistent for different variable specifications and going beyond previous studies based on ordinary least squares or fixed effects/random effects methodologies. Moreover, although our results confirm prior related studies (Iqbal etal., 2020; Madanoglu and Ozdemir, 2019), we employ system-GMM panel data techniques to avoid the endogeneity issue. More precisely, EPU affects financial performance since a 1% increase in EPU has an estimated 1.13% decrease in ROE.
This result is especially relevant to tourism firms. Although the tendency has changed in recent years (Demir etal., 2019), tourism firms have traditionally held larger amounts of both long- and short-term debt. Thus, when economic uncertainty arises, firms’ financial margin will be highly affected, and, hence, companies should maintain a capital structure that prevents them from damaging shareholders’ interests. This implication is later confirmed when considering the joint effect of EPU and leverage ratio.
Second, we find that firm size and leverage moderate the relationship between EPU and US tourism firm performance. On the one hand, larger firms are found to be more affected by uncertainty, implying that larger US tourism firms have more difficulties in adapting their activity. This result is in line with a previous study finding that the ability to adjust the activity in larger companies is more difficult when uncertainty arises (Demir etal., 2019).
On the other hand, highly indebted firms are also more affected by EPU, suggesting that highly indebted US tourism firms will have more financial problems if uncertainty is high. Some possible explanation are as follows. Note that tourism firms are traditionally more indebted (Akron etal., 2020; Demir etal., 2019; Singal, 2015). Chen (2012, 2013) also reveals that uncertainty of monetary policy has a powerful effect on the financial performance of US tourism firms because US tourism firms are highly bank-dependent borrowers. This effect can be stronger especially under a tightened monetary policy as financial institutions or banks reduce their supply of credit. Therefore, high EPU would have a stronger impact on highly indebted US tourism firms due to high dependence of US tourism firms on external financing.
Third, results of panel quantile regression tests indicate some interesting results. The impact of EPU on profitability of US tourism firms is found to be asymmetric. EPU has different effects on US tourism firm performance at different quantiles of ROA and ROE. Specifically, although EPU has a significant impact on all quantiles of both ROA and ROE, its effects on both ROA and ROE at the median and high quantiles (50%, 75%, and 100%) are much higher than that at the low quantile (25%).
The corresponding size of EPU’s impact on ROA at the 50%, 75%, and 100% quantiles is 24.55 (1.817/0.074), 24.45 (1.809/0.074), and 23.38 (1.730/0.074) times that of the impact at 25% quantile. Similarly, the corresponding size of EPU’s impact on ROE at the 50%, 75%, and 100% quantiles is 3.77 (2.355/0.624), 3.79 (2.355/0.624), and 4.18 (2.355/0.624) times that of the impact at 25% quantile. This new evidence implies that less profitable companies (firms at lower quantiles) are less affected by uncertainty. The possible explanation is that, according to financial theory, specifically the risk–return relationship, the companies bearing high (low) risk would earn higher (lower) profit or return. Less profitable tourism firms may be more engaged in low-risk investments. Hence, when uncertainty appears, although they are also negatively affected, EPU has a less harmful effect.
In comparison, the effect of EPU on Tobin’s Q of US tourism firms is asymmetric. Although EPU has a significant impact on Tobin’s Q of US tourism firms, this significant impact is found only at the 25%, 50%, and 75% quantiles. The effect of EPU on Tobin’s Q is not statistically significant at the 100% quantile. A plausible explanation for this finding is that US tourism firms with a higher market performance in terms of a higher value of Tobin’s Q are better at creating value, and given this advantage, they can better resist economic uncertainty since investors’ analysis will rely on the ability of firms to maintain their core business results.
Our findings have several policy implications for different parties. Managers of tourism firms should be aware of the negative consequences of rising uncertainty and take precautions against decreasing profitability. Rising EPU in the United States will hit the domestic market demand. People will tend to spend less especially on travel and recreation out of an abundance of caution. As tourism firms bear higher amounts of fixed costs, their profitability ratios will diminish. In such a case, they should diversify their customer groups to mitigate this negative effect. They can target customer groups who are less likely to be affected by uncertainty (for instance by attracting inbound tourists).
Alternatively, managers can try to stabilize the decreasing demand by providing special discounts or packages and developing well-structured and cost-effective marketing campaigns (Madanoglu and Ozdemir, 2019). Moreover, before or during uncertain periods, managers can follow cost-saving behaviors such as labor staffing, holding less inventory, and postponing investment decisions. Managers should maintain an adequate growth and capital structure, since our results confirm a joint negative effect of both firm size and leverage with EPU. Thus, managers ought to adopt flexible policies that allow the company to adjust its activity when uncertainty arises (Demir etal., 2019).
Governments should try to minimize EPU by being more transparent and predictable in economic decision-making. This will lead to a more stable economic environment. If the source of uncertainty is abroad or global, governments should also take actions to protect tourism companies, for instance by opening new credit channels, creating refinancing options, and providing tax incentives. Moreover, the performance of highly indebted firms is more affected by uncertainty. Therefore, creating new credit channels for those companies will be more important as those companies have less capabilities to reach funds. A proactive behavior will mitigate the negative effect of uncertainty.
As for limitations and directions for future research, this article provides evidence for tourism firms listed only in the United States. Thus, the findings can be limited for the United States. To better understand the negative effects of EPU, future studies can extend the data set to emerging economies which are more vulnerable to uncertainty. Evidence from around the world will help to provide a more complete picture of the consequences of uncertainty. An additional limitation is the focus on listed companies. At this step, special attention can be given to SMEs which have limited access to capital and lack managerial sources to cope with uncertainty, unlike listed companies. A comparison between listed and non-listed companies will have important implications.
Footnotes
Declaration of conflicting interests
The author(s) declared no potential conflicts of interest with respect to the research, authorship, and/or publication of this article.
Funding
The author(s) received no financial support for the research, authorship, and/or publication of this article.