




Abstract
The features of some cultural goods allow them to be exhibited in a unified form in one location or separated for display in two or more locations. The aim of the present article is to understand whether the decision to expose a cultural good in two different cities instead of the same location could generate benefits for both. To do so, the case of the Giants of Mont’e Prama is analysed. This recognised heritage complex of archaeological stone statues was found in Sardinia (Italy) in 1974 and first displayed in 2014. Since 2014, interest in these statues has increased among both residents and tourists. Moreover, the location of the exhibition was the subject of a strong discussion among historians and politicians. Historians preferred to display all the statues together in Cabras, where they were found. However, politicians and other authorities decided to divide the statues between Cabras and Cagliari, the regional capital, thus separating the collection into two exhibitions. This analysis is carried out to capture potential spill-over effects in visitors’ behaviour and identify which exposition causes visits to the other. The results indicated that the exposition system is a win–win solution, and the negative effect of overtourism is not observed.
Introduction
In recent decades, the growth of tourism flows has been considered to be a positive economic signal. Indeed, job creation and improved social well-being in countries and regions are only two examples of the positive externalities linked to tourism. 1 However, an important feature of the tourism sector is its uneven spatial and temporal distribution (Batista e Silva et al., 2018). Moreover, negative externalities such as crime, congestion, overbuilding and environmental degradation can be generated by tourism in destinations and must be taken into consideration by policymakers. 2 In response to earlier negative consequences of tourism, a recent literature strand has analysed overtourism as a phenomenon that can affect not only tourist cities but also rural areas, island destinations and parts of cities during certain events (Koens et al., 2018). Butler (2018: 637) defined overtourism as a situation in which visitor numbers overload the available services and facilities.
In this context, the positive relationship between regional prosperity and the presence of creative and cultural industries (Power and Nielsen, 2010) has to be better investigated. Cultural heritage management and investment have the potential to generate social and economic spill-over effects such as regional development and new job opportunities in the tourism field. In fact, both tourism and culture have the capability to attract people to destinations, influencing their competitiveness and promoting growth (Brida et al., 2013a). The cultural segment has also been noted to be the most favourable for diverting tourism flows in the low season (Cisneros-Martínez and Fernández-Morales, 2015), while an essential feature of tourists’ experiences is their contact with local culture and heritage, often through visits to local museums (Jolliffe and Smith, 2001). However, when cultural heritage attracts a number of tourists greater than or equal to the residential population of an urban area, it is important to prevent negative effects and overtourism. Consequently, policymakers have to consider all possible scenarios because the features of some cultural goods allow them to be displayed in a unified form in a single location or be separated among two or more locations. Taking into account tourists’ preferences, therefore, may provide a helpful tool to inform sustainable choices related to tourism in cultural heritage management.
From a microeconomic perspective, the economic value of cultural tourism is linked to a set of values associated with the bundle of public goods composing the cultural supply (Brida et al., 2013b). Visitors may be willing to pay a large amount of money to visit a cultural attraction (use value) or simply preserve a site for future visits or use by future generations (non-use value). Individuals may attribute value even simply to knowledge of a site’s existence. These values may be useful for shaping policy directions and can be elicited by applying the stated preferences (SP) and the revealed preferences (RP) methods. In the SP method, individuals are asked to state what they hypothetically are willing to pay or accept for a given good or bundle of commodity characteristics (i.e. contingent valuation and choice experiments). RP studies determine monetary value based on a complementary though real-world market (i.e. hedonic and travel cost methods). This research estimates potential spill-overs effects in visitors’ behaviour by following the travel cost method approach in a case study of the Giants of Mont’e Prama exhibitions in Cabras and Cagliari. Empirical data were gathered from a survey conducted at the National Archaeological Museum (Cagliari) and the Civic Museum (Cabras) from August to October 2014.
This article is structured as follows. A literature review on the evaluation of museums and cultural heritage and recent debates on overtourism is presented in the first section. This is followed by a section describing the methodological approach and a section explaining the case study and data used. The results are presented in the fourth part, along with a further section including robustness checks. Finally, the last section of the article offers conclusions and policy implications.
Literature review
The economic evaluation of cultural goods remains an open debate presenting some problems (Mazzanti, 2003a). Total economic value includes use and non-use components. Use value arises from the willingness to pay to visit and enjoy cultural heritage, whereas non-use value derives from the willingness to preserve these assets regardless of whether one visits them. The estimation of use and non-use value is fundamental to determining cultural policy. Indeed, knowledge of the individual and aggregate benefits of both use and non-use value, as well as individual behaviour, helps the public and private sectors make cultural policy decisions and prevent negative externalities such as overtourism.
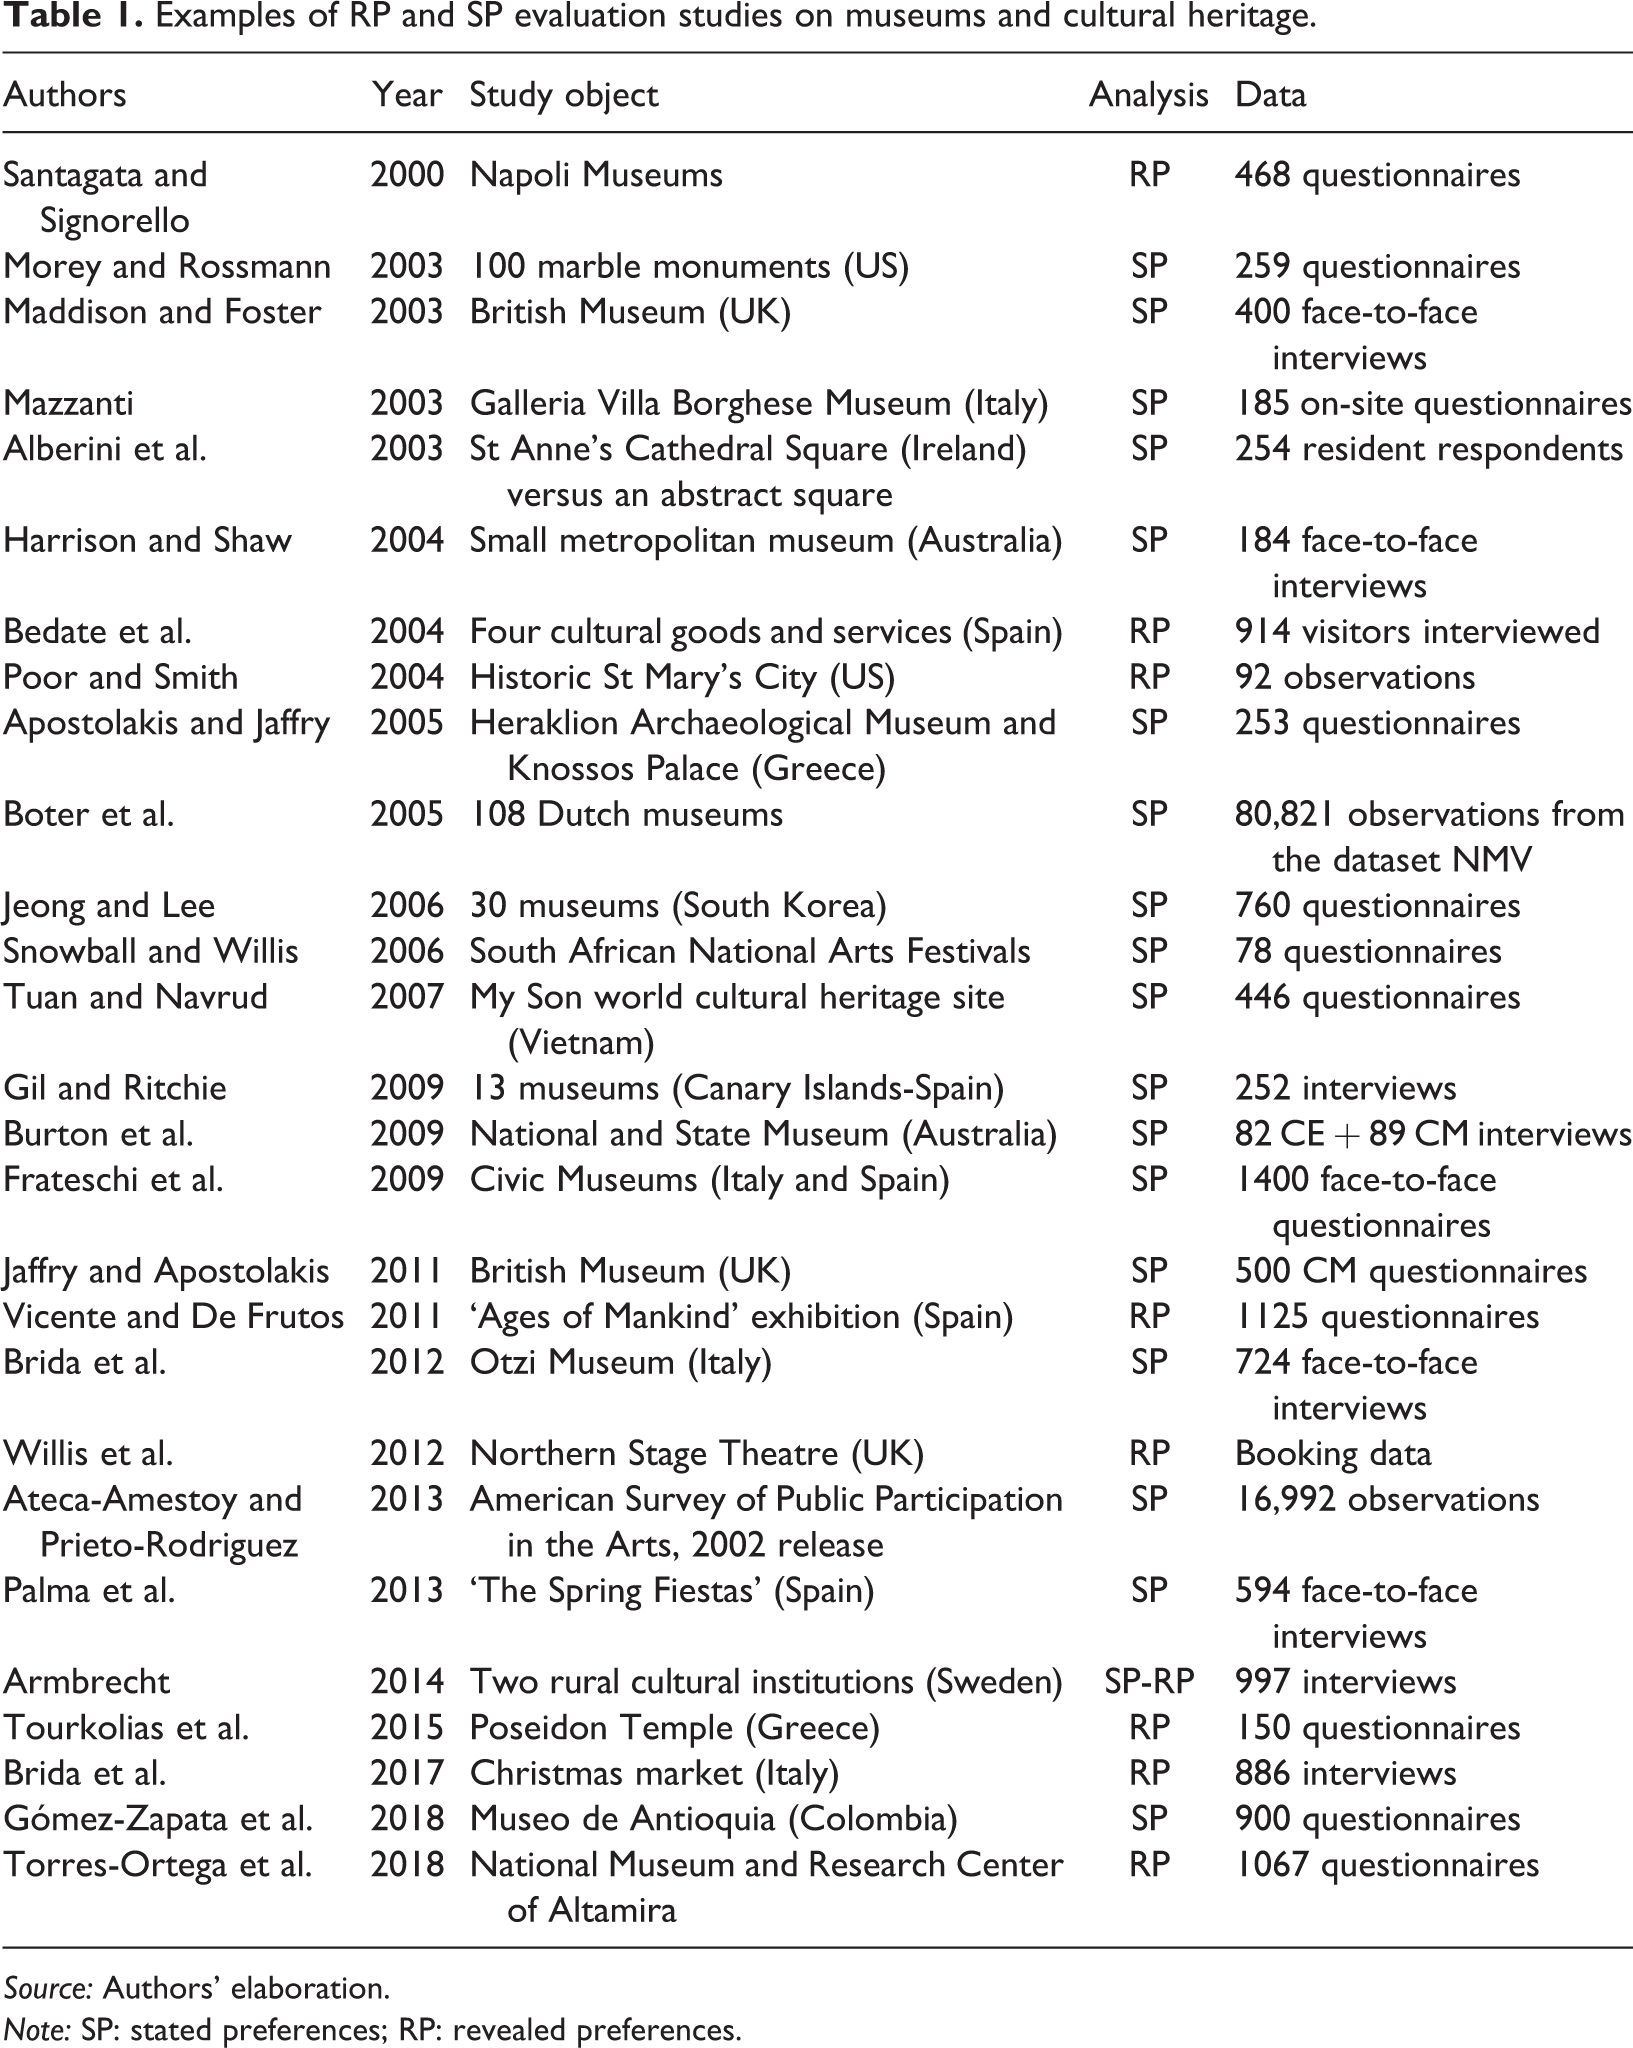
In cultural economics, evaluation studies have employed both SP and RP analyses. Using SP, Mazzanti (2003b) first tested the reliability of discrete choice experiments (DCEs) in cultural evaluation. Mazzanti (2003b) employed a DCE questionnaire to consistently measure economic value and user preferences regarding cultural goods and services based on on-site interviews of visitors at the Borghese Gallery in Rome (Italy). Since then, several DCE studies have addressed the topic of cultural goods (see Table 1).
Examples of RP and SP evaluation studies on museums and cultural heritage.
Source: Authors’ elaboration.
Note: SP: stated preferences; RP: revealed preferences.
Regarding the RP method, numerous empirical applications of the travel cost method are found in the tourism, cultural events and heritage literature (Brida et al., 2017). This research strand started some years later than the SP analysis. One of the first contributions was Poor and Smith (2004), who employed the travel cost model to estimate the consumer surplus welfare measures of a cultural heritage site. More specifically, they analysed the case of Historic St Mary’s City in rural southern Maryland (US) using only 92 observations (Poor and Smith, 2004). That same year, Bedate et al. (2004) published a travel cost method analysis evaluating four cultural goods and services in the autonomous community of Castilla and León (Spain): (1) a cultural artistic event, (2) a village comprising a historic ensemble, (3) a museum and (4) a historical cathedral.
More recently, Torres-Ortega et al. (2018) apply a travel cost on the National Museum and Research Center of Altamira (Spain) assuming that the visit was the main purpose of the trip. RP has been applied to other cultural goods and cultural events: theatre (Willis et al., 2012), concert hall (Armbrecht, 2014), touring art exhibition (Vicente and De Frutos, 2011), ancient Greek temple (Tourkolias et al., 2015) and famous Christmas market in northern Italy (Brida et al., 2017). As pointed out in this literature, the application of this method in cultural economics is useful for many reasons. Armbrecht (2014) investigates the applicability of the travel cost method versus contingent valuation, based upon the cases of the Nordic Watercolour Museum and the ‘Vara Konserthus’ concert hall, and shows that first method is preferable when the visit is the single cultural experience.
It can inform public policy design and encourage private and public commitment to cultural heritage management. Moreover, this research strand has demonstrated the validity of the travel cost method in the field of cultural events and heritage sites (Brida et al., 2017).
The present article exploits survey data and the individual travel cost (ITC) approach to study visitors’ demand and behaviour and disentangles the linkages between two exhibitions that were part of the same cultural good. To the authors’ knowledge, this study marks the first attempt to evaluate a cultural good and its spill-over effects from this perspective. The topic has assumed a significant relevance as problems related to overtourism are emerging in some cultural destinations such as Venice (Italy) and Barcelona (Spain). This complex, multilayered phenomenon is related to residents’ and visitors’ quality of life, and the solution includes the creation of a sustainable model to manage tourism growth (Capocchi et al., 2019). However, despite the growing literature on this issue, the concept of overtourism cannot be objectively measured (Koens et al., 2018).
Methodology
The methodological approach followed lies the basis into the travel cost method that is usually used to estimate the economic use value for recreational goods and services and can be applied in three directions depending on the available data (Brida et al., 2017). The zonal travel cost, which is the simplest approach, typically uses secondary data, with some basic data collected from visitors. The ITC approach bases estimations on comprehensive surveys of visitors, and the random utility approach requires very detailed information on visitors’ experiences. Willingness to pay for marketed goods is estimated based on the quantities demanded at different prices, while willingness to pay to visit cultural sites is estimated based on the number of trips made at different travel costs. Travel costs including entrance fees thus are the price of access to the site, while the number of visits is the demand.
The present research applies the ITC approach taking into account the number of times individuals previously visited the statue exposition hosted in their location of discovery (Cabras) and the main regional museum (Cagliari). The empirical analysis thus identifies factors influencing per capita visits, individuals’ knowledge of the exhibition’s displacement controlling for travel costs and other important variables. The controls include demographic variables such as age, income, gender and education level. Following the travel cost method approach, it is assumed that individuals respond to travel costs in the same way as to changes in entrance fees.
All the surveyed visitors are considered in the empirical estimation, because we assume that the trip in the city is attributable to the statues’ presence. Controlling for individuals’ knowledge of the exhibition’s displacement, it allows understanding the potential spill-over effect between the two museums. We first perform the analysis including all the visitors, and then to gain a clear image of the phenomenon, we split the sample into the two locations (Cagliari and Cabras). The dependent variable is the number of times the respondents visited the exhibit at the same museum. This variable can have only positive values (i.e. a count variable) and is estimated through Poisson class regression models (Cameron and Trivedi, 2013).
Based on the characteristics of the empirical data and the differences between the means and variances, several extensions of the Poisson model can be used. For example, the negative binomial regression generally is used when the values of the mean and the variance of the dependent variable differ considerably (Haab and McConnell, 2002). Another feature of the data that needs to be considered is the truncation at the zero of the count data as zero counts are not observed (i.e. the dependent variable assumes values that range from 1 – in this case, the first visit to the cultural site – to N). An estimator that allows modelling visits with this specific restriction is the zero-truncated Poisson (or negative binomial) model. It is specified in the following equation:

in which wi represents the controls in addition to travel costs.
The right-hand side of the specification includes travel costs, entrance fees, knowledge of the statues’ separation among the two museums and a set of socio-economic controls such as age, gender and education level. Additional controls are satisfaction with the visit, visitors information retrieval about the museums. The econometric model for visitor demand at the two museums is defined as follows:

in which Vij is the number of visits individual i made to museum j. According to demand theory, travel costs and entrance fees are expected to be inversely related to the number of visits. Satisfaction and the socio-economics controls of income and age might show a positive relationship with the number of individuals visits, as found in previous studies (Poor and Smith, 2004). Information about the museum and the statues is expected to have a positive relationship with individuals’ number of visits.
Case study and data
The Mont’e Prama complex is a unique, archaeological set of stone statues found in Cabras, a municipality in the Sardinia region (Italy). These 2-m-high stone statues, called the Giants of Mont’e Prama, were found in the locality of Mont’e Prama, near Oristano (Italy). In 1974, a farmer discovered small fragments of these statues by chance, and 40 years later, they were rebuilt into 35 stone statues representing boxers, archers and wrestlers. Shown to the public in 2014, the Giants of Mont’e Prama temporary exhibition was divided between two museums, one in Cagliari, the regional capital, and one in Cabras, where the statues were found.
According to Giovanni Lilliu, the most important historian on Sardinia, these sculptures are the most ancient in the Mediterranean zone, after those in Egypt (Leonelli and Usai, 2012). The statues were carved in sandstone probably between the ninth and eight centuries BC. They came from the Nuragic civilisation, which dominated Sardinia for two millennia until the second century AD. The main characteristic of these sculptures is the shape of their eyes consisting of two perfectly concentric circles. The origin of this detail has remained a mystery, and no similar statues have been found. The importance of this cultural heritage is derived from the mystery of the statues’ total number and the unknown purpose of this site with so many statues. Considering the presence of a necropolis, it has been hypothesised that perhaps the Giants guarded the tombs or an undiscovered temple. The total number of these statutes is unknown as other fragments have been found.
The National Archaeological Museum of Cagliari has largest exhibition of 28 statues, with seven others displayed in the Civic Museum of Cabras. This allocation of statues and the exhibition shared between two places has been the subject of a strong debate among historians and politicians. Historians preferred to display all the statues in Cabras, where they were found, but politicians and other authorities decided to divide them between Cabras and Cagliari, the regional capital.
To enable a comparative analysis of visitors’ preferences, the same questionnaire was randomly distributed at the sites from August to October 2014. The questionnaire was given to visitors as they left the museums during opening hours (10 am–6 pm) on all days except Monday when the museums were closed. We employed snowball sampling, a convenience sampling technique frequently used to access difficult-to-reach subjects and to test the hypothesised relationships among the variables (Filieri and McLeay, 2013).
The questionnaire consisted of 29 questions in three sections. First was a sequence of questions with a five-point Likert-type scale (1–5) on the museum visits and the related push-and-pull motivations (Lam and Hsu, 2006; Yoon and Uysal, 2005). The second section presented the DCE. The third section covered visitors’ socio-demographic and economics characteristics.
From the 345 successfully collected questionnaires, 51% of the respondents were female. The majority of the respondents had attended tertiary education, were tourists or excursionists and had yearly incomes of less than 50,000€. Table 2 reports the descriptive statistics of the sample.
Socio-demographic characteristics of the visitors.

Source: Authors’ elaboration.
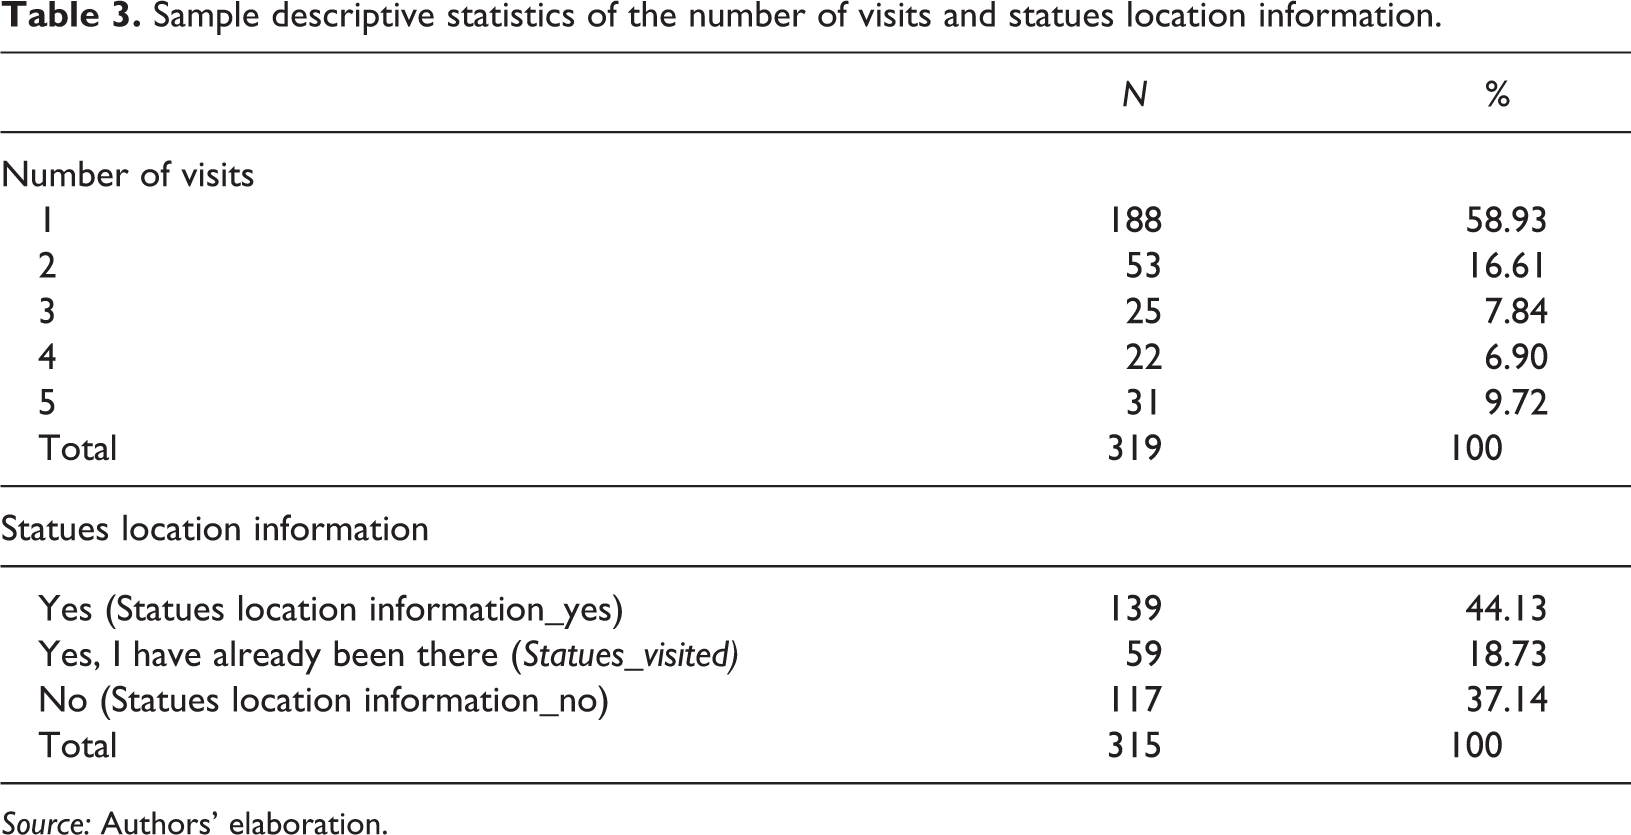
The dependent variable is the number of visits that each respondent previously completed to the museum where the interview took place. The 58.93% was at the first visit, the 63.3% in Cabras and the 48% in Cagliari. The individuals’ knowledge on the exhibition’s displacement was retrieved by asking respondents if they were aware on how the Giants of Mont’e Prama temporary exhibition was organised. Almost the 63% (44.13 + 18.73%) of the sample at the time of the visit already knew how the system was organised; among them, about the 19% had previously visited the other part of the exhibition (Table 3). Accordingly, three different visitors’ typologies can be identified: Those who had already visited the other museum (Statues_visited), those who had the information but did not visited it yet (Statues location information_yes) and those who declared that they did not know how the exhibition was arranged and did not visited it yet (Statues location information_no).
Sample descriptive statistics of the number of visits and statues location information.
Source: Authors’ elaboration.
In order to understand the overall visitor dynamics, Figure 1 shows the different visitor trends at the two museums. Annual and monthly data are made available by MIBAC for Cagliari and Cabras for the timespan 1996–2018. Unfortunately, the time series include an interruption for the period 2000–2010 for Cabras, for this reason data from 1996 are only considered for descriptive purposes. On one hand, Cagliari shows a positive trend with significant growth starting in 2009, and regarding monthly trends, a clearly identifiable peak occurred in May 2014 after the opening of the Giants of Mont’e Prama exhibition. Afterward, the number of visitors seems to have stabilised around the previous mean. On the other hand, Cabras displays a clearer, positive evolution with more visitors after the Giants of Mont’e Prama exhibition (see Table 4). This museum’s appeal continued to grow after 2014 until peaking in August 2016. Visitors’ interest in seeing and learning about the statues in their original location seems to have had a more durable effect.
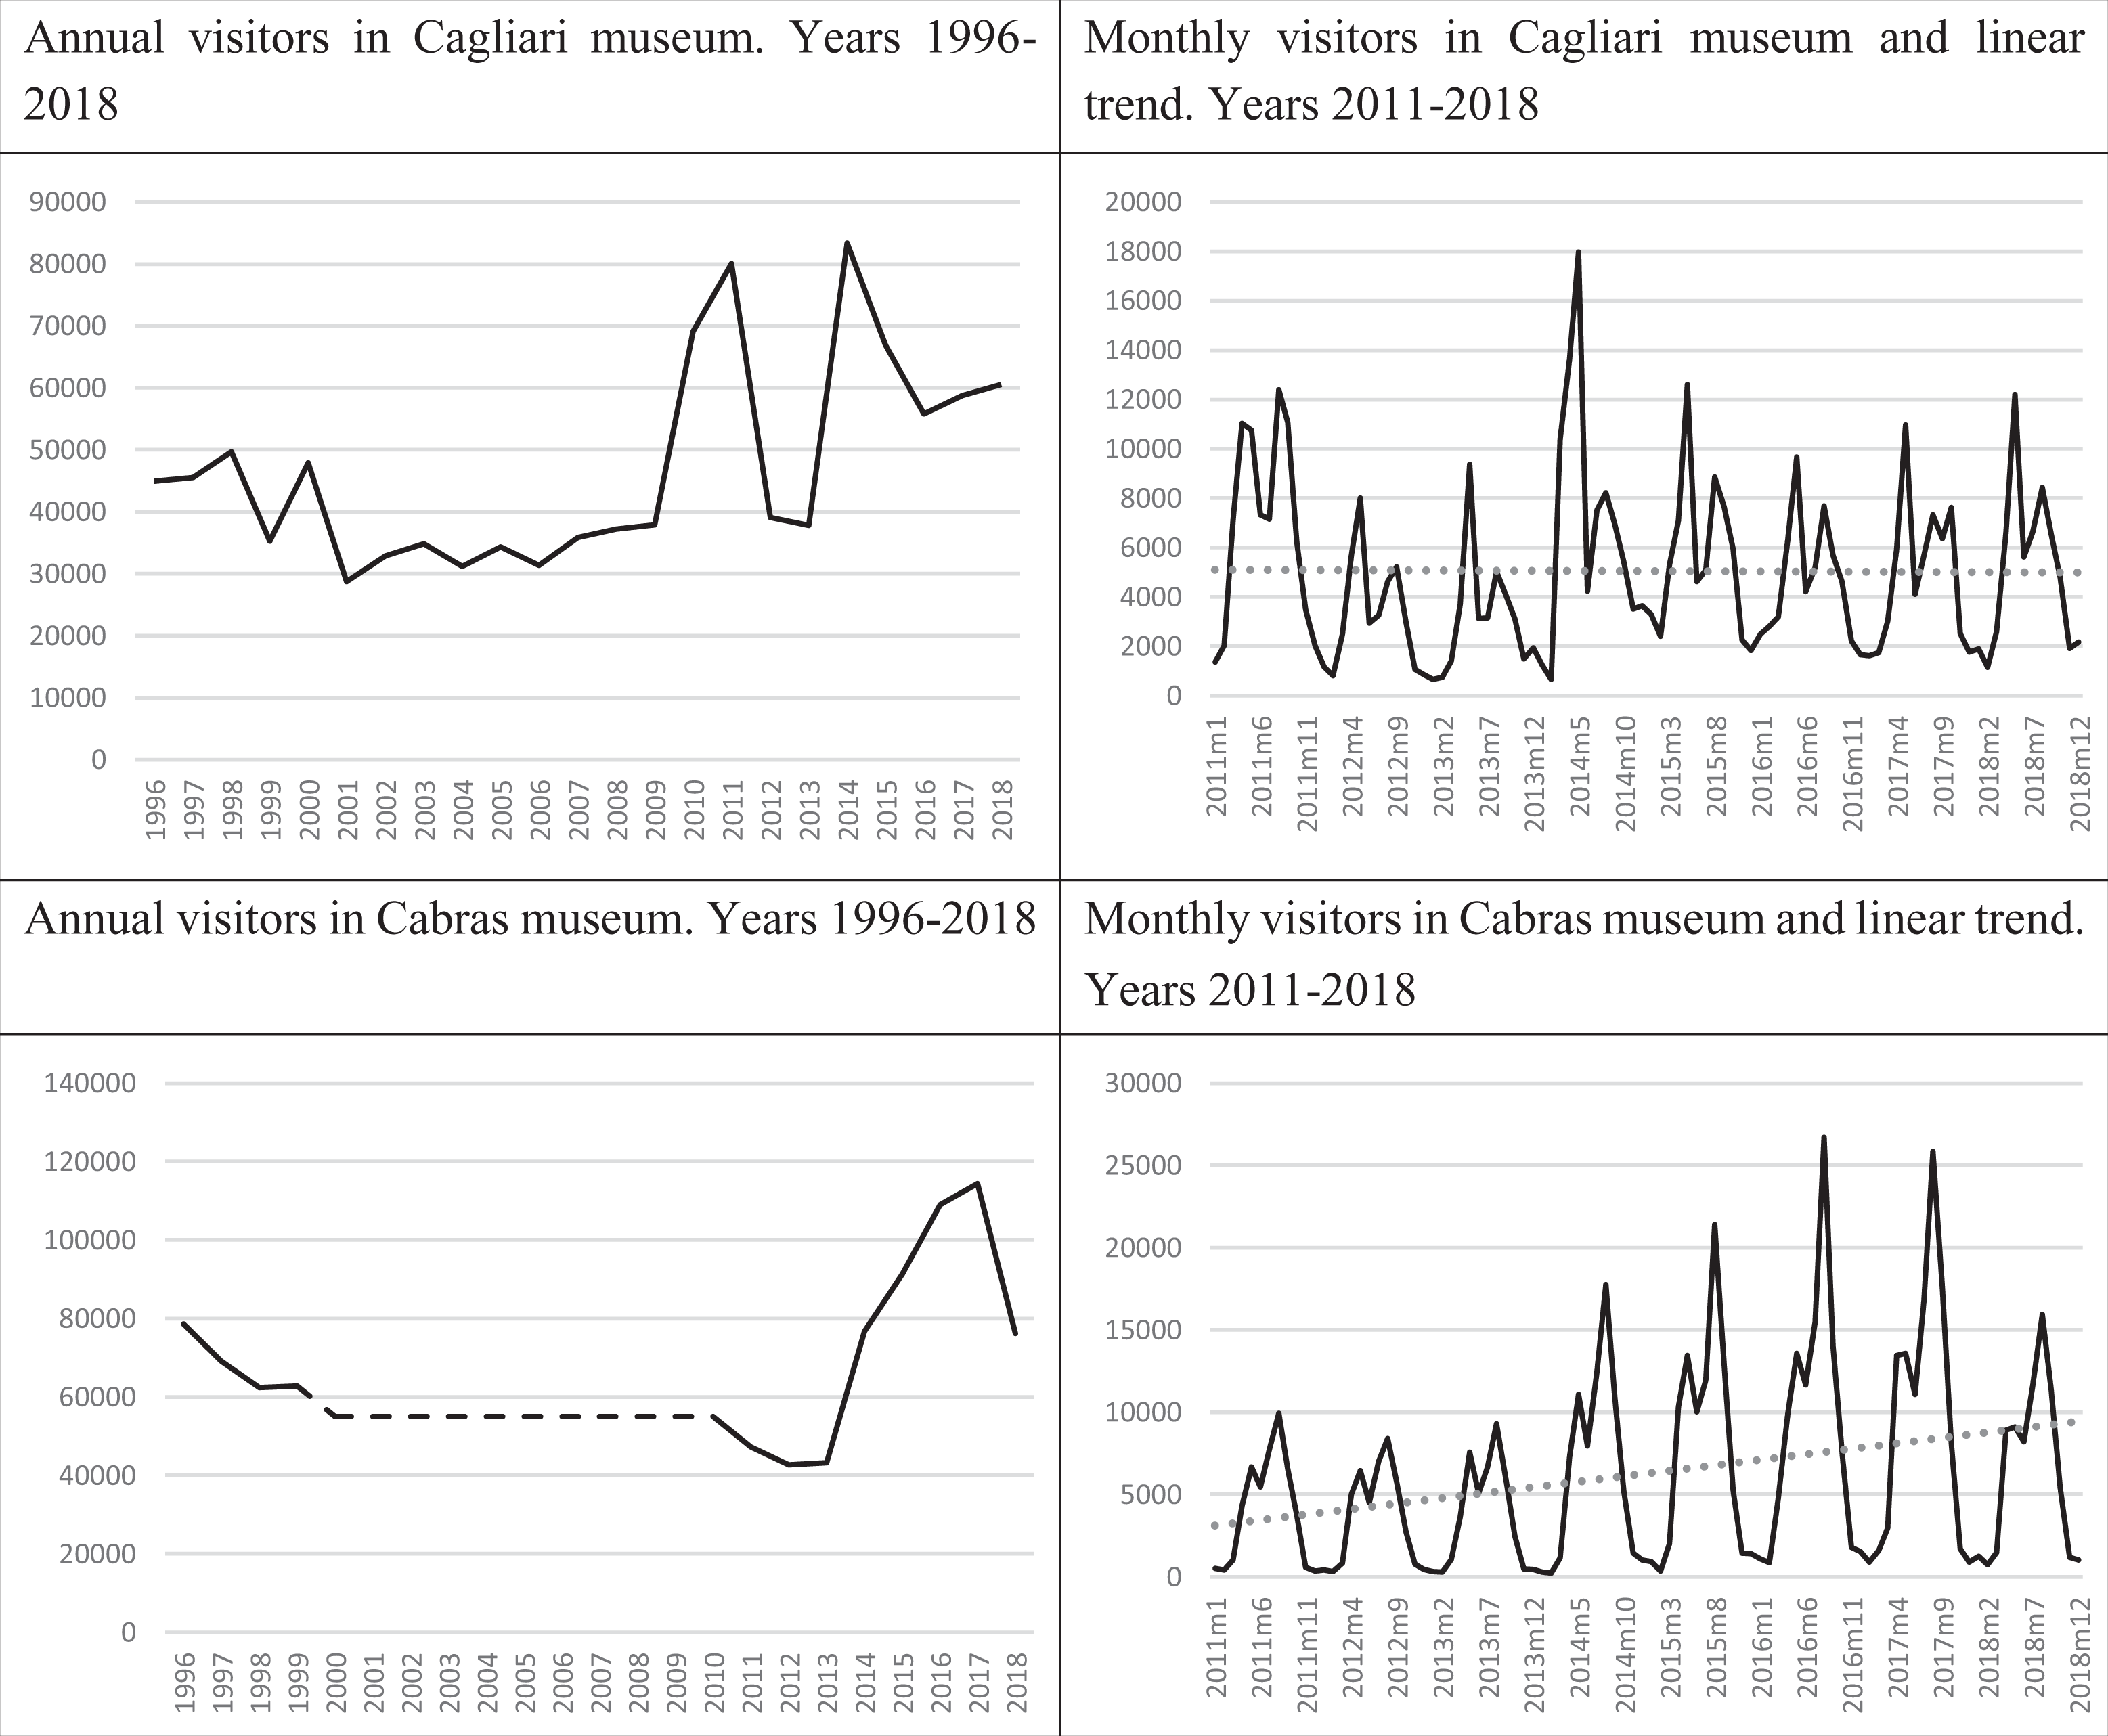
Annual and month visitor trends at the two museums. Source: Author’s elaboration on MIBAC data. Note: Data for 2000–2010 were not available for the Cabras museum, so for the graphical representation, we used the average number of visitors over 2009–2011 (see the dashed line).
Descriptive statistics of total number of visits at the two museums.

Source: Authors’ elaboration on MIBAC data.
Results
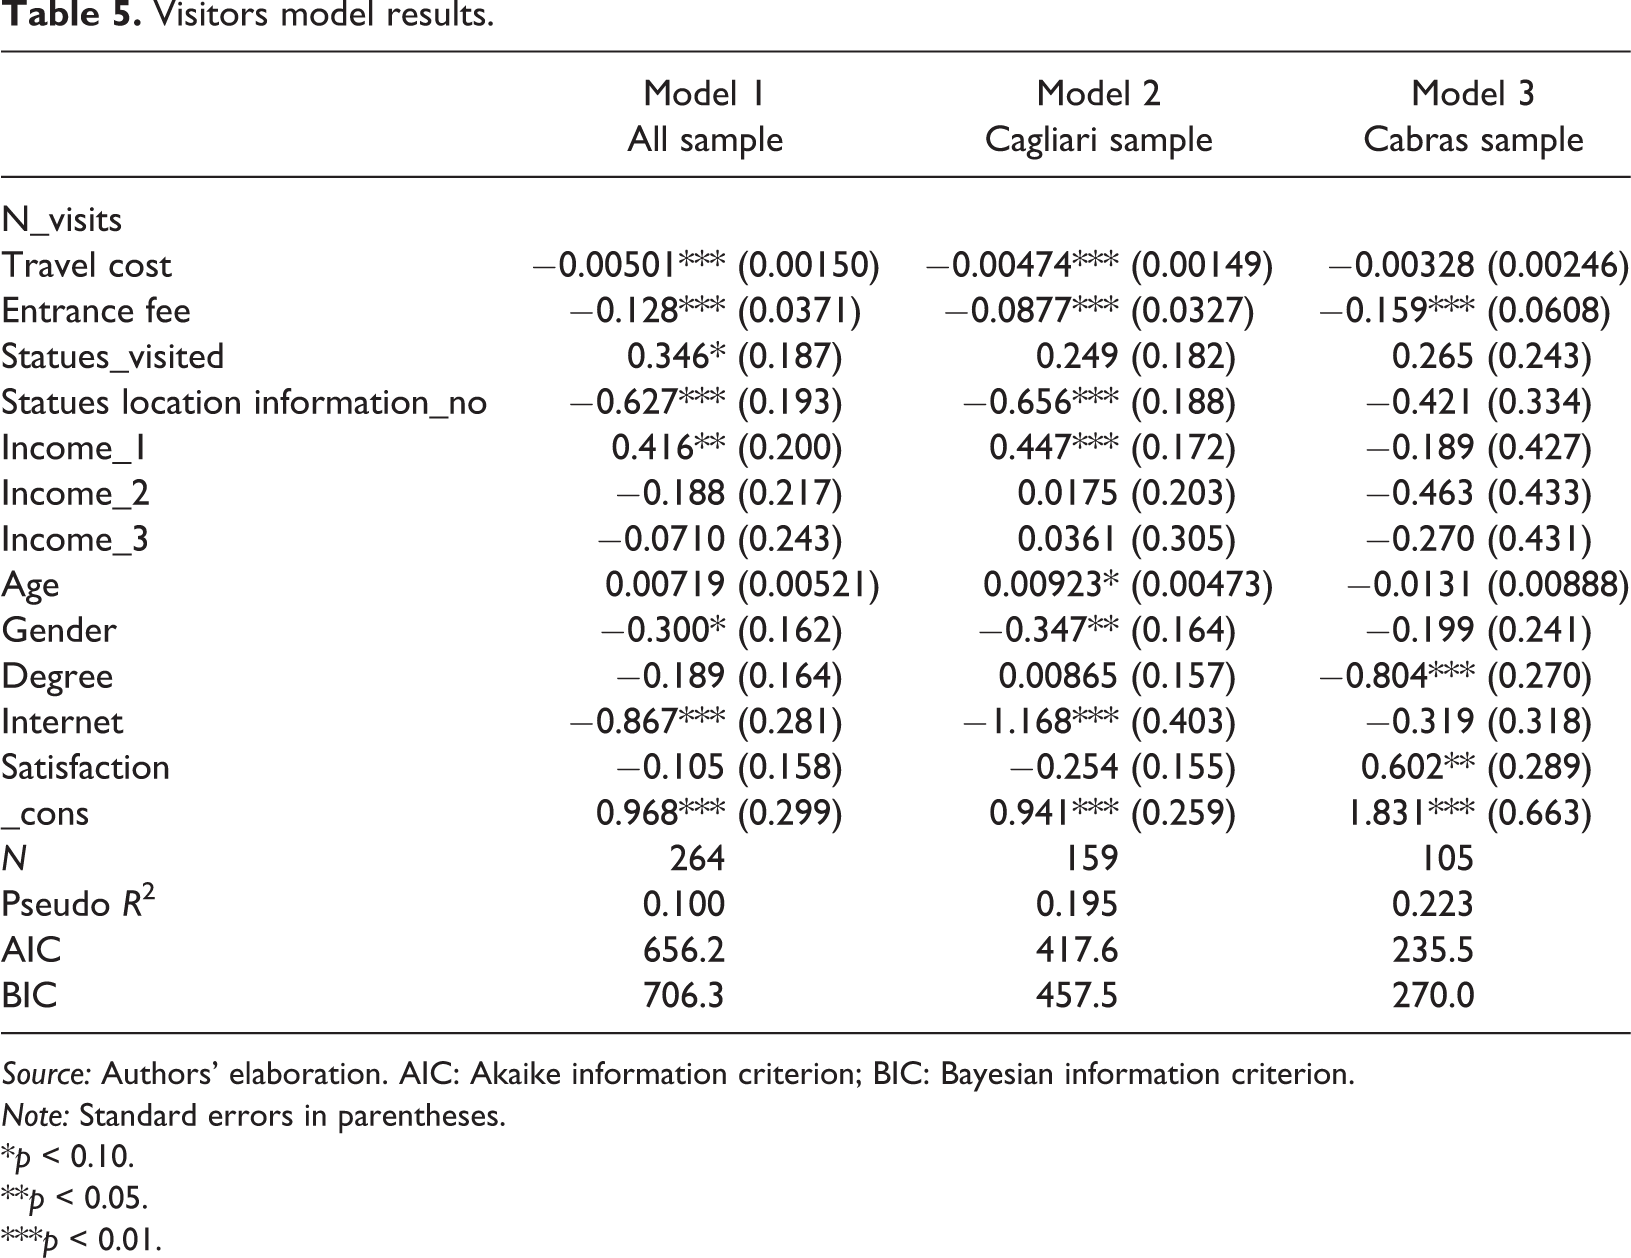
Table 5 reports the regression results for the empirical specification in equation (2). Model 1 includes the estimates for the entire sample, model 2 for those interviewees at the Cagliari museum and model 3 for the Cabras museum sample. The variables used in the regressions are described and available in the Online Appendix (Table A1).
Visitors model results.
Source: Authors’ elaboration. AIC: Akaike information criterion; BIC: Bayesian information criterion.
Note: Standard errors in parentheses.
*p < 0.10.
**p < 0.05.
***p < 0.01.
The models that fit the data were chosen based on a goodness-of-fit test among several specifications of Poisson and negative binomial regressions. The test results for the entire sample (goodness-of-fit χ2 = 263.04 – Prob > χ2 = 0.00) gave empirical evidence suggesting that the Poisson model was not very appropriate for the data. As a further assessment, a test of the overdispersion parameter α was employed (likelihood-ratio (LR) test). When the overdispersion parameter is zero, the negative binomial distribution is equivalent to a Poisson distribution. In this case, the α was statistically significantly different from zero (LR test of α = 0:
In line with theory and previous findings (Poor and Smith, 2004), the coefficient for travel costs for the entire sample (model 1) is negative and statistically significant, indicating that as travel cost increases the number of museum visits decreases. This same result is found for the Cagliari sample but not the Cabras sample, which do not have a statistically significant coefficient. The entrance fee coefficient is statistically significant with a negative sign across the three specifications.
Regarding socio-economics characteristics, the coefficient for the lowest income level in the first sample is positive and statistically significant, implying that those with this income level had a greater probability of visiting this type of museums. Gender is negative and statistically significant as male respondents had a lower probability of visiting museums several times. These same results are found for the Cagliari sample (model 2). However, in the Cabras sample (model 3), those with graduate degrees (the most common education level) were less likely to visit that museum more than once.
The variable controlling for those who stated that they knew how the exhibition system was arranged and had already visited the other museum (Statues_visited) is positive and statistically significant only for the total sample. These results indicate that well-informed individuals generally were more likely to revisit one of the two museums. Some spill-over effects due to the statues’ displacement, therefore, could be seen to arise between the two museums. Interestingly, compared to those who had this knowledge, those who declared that they did not know how the exhibition was arranged (Statues location information_no) were less likely to return to the museum in Cagliari. However, the same cannot be said for Cabras as the coefficient is not statistically significant. In contrast, the coefficient controlling for those very highly satisfied with their visits is positive and statistically significant for Cabras, meaning that they tended to revisit the museum. This same pattern is also found among those who learned about the exhibition online. These results could indicate differences in the characteristics of the audiences attending the two museums. Visitors to Cabras were aware and well informed about the statue exposition, whereas visitors to Cagliari might have visited the statue exposition by chance.
A further regression analysis is performed on a subsample of people that do not spend the night in the museum city, in order to validate the hypothesis that the trip in the city is attributable only to the statues’ presence.
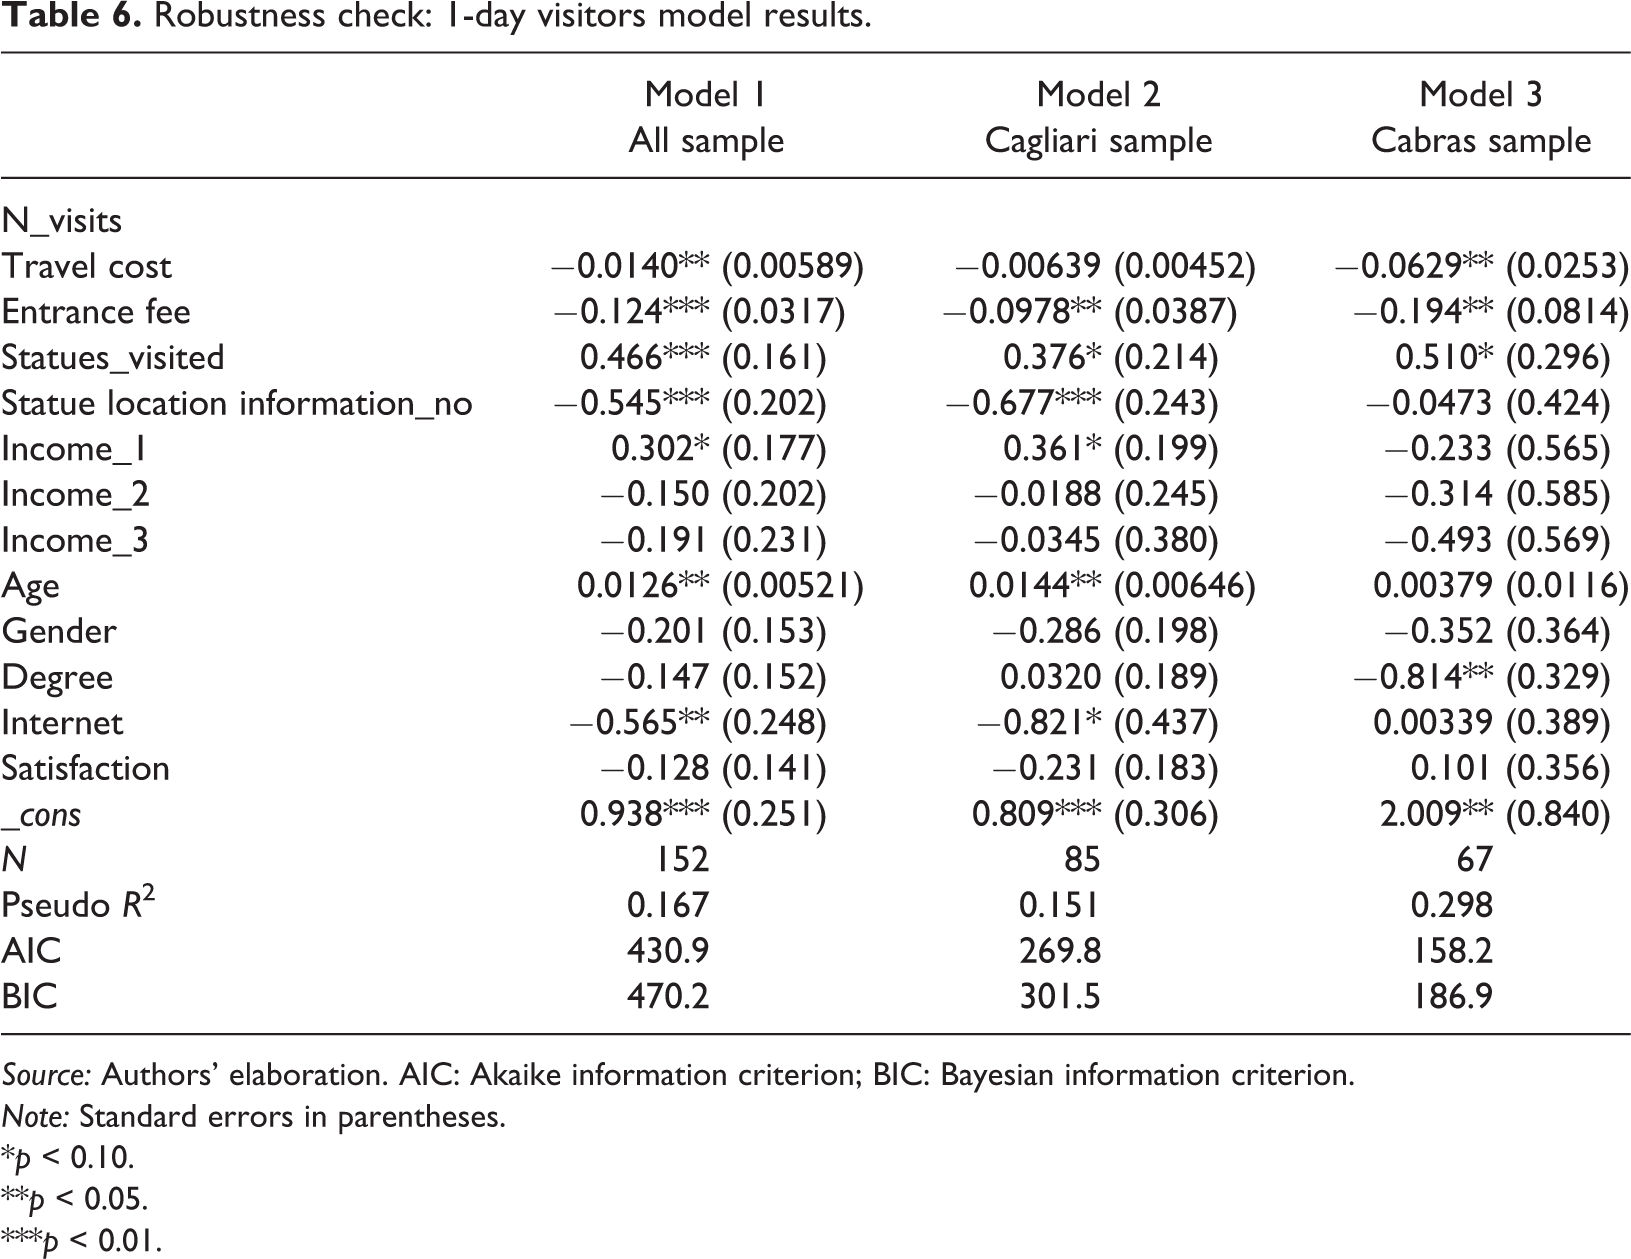
Considering the time constraint, 1-day visitors (Table 6) cannot do other recreational activities in the city, except visit the exhibition. Although the smaller sample size, results for all sample confirm model 1. In the Cagliari case, the coefficients for travel cost and gender turned out to be not statistically significant. The first finding could be interpreted as an indicator of the visitors’ interest in the exhibition regardless of the costs needed to reach it. For those who know how the exhibition system was arranged and had already visited the other museum, the coefficient is now positive and statistically significant in the three specifications. At the opposite, Statues location information_no is negative and statistically significant for the pooled sample and Cagliari visitors. These outcomes confirm that well-informed individuals generally were more likely to revisit one of the two exhibitions and that is true especially for 1-day visitors, whose trip motivation is to visit the museum. Consistently, those who declared that they did not know how the exhibition was arranged (Statues location information_no) were less likely to visit the museum in Cagliari, but the same cannot be said for Cabras. In this sample, the coefficient for the travel cost is, as expected, now statistically significant meaning that reaching this destination is more costly due to its peripherical position.
Robustness check: 1-day visitors model results.
Source: Authors’ elaboration. AIC: Akaike information criterion; BIC: Bayesian information criterion.
Note: Standard errors in parentheses.
*p < 0.10.
**p < 0.05.
***p < 0.01.
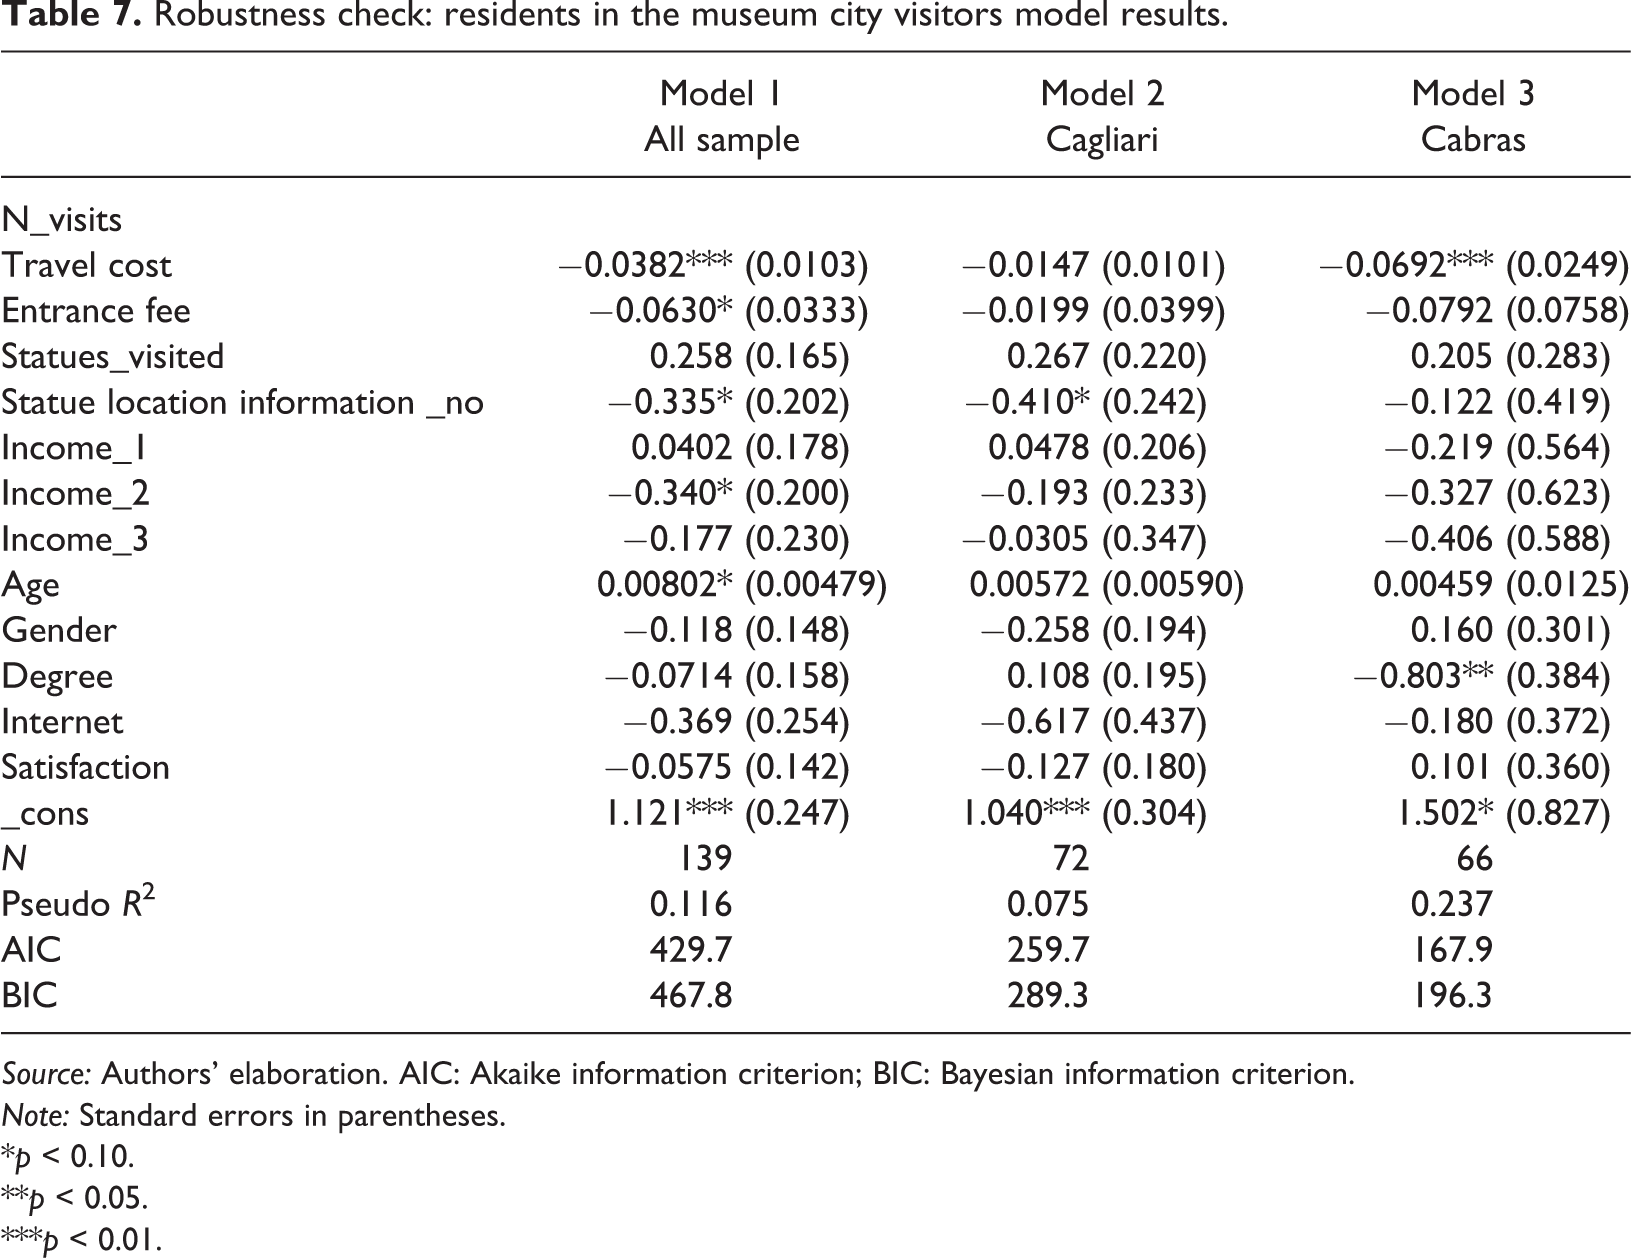
Moreover, in order to disentangle the effect on the number of visits of residents in the museum city that are Sardinian residents, a set of regressions is performed on only this subsample (Table 7). Results show that also for this component reaching Cabras is more costly (the coefficient for the travel cost is negative and statistically significant), but the same cannot be said for Cagliari.
Robustness check: residents in the museum city visitors model results.
Source: Authors’ elaboration. AIC: Akaike information criterion; BIC: Bayesian information criterion.
Note: Standard errors in parentheses.
*p < 0.10.
**p < 0.05.
***p < 0.01.
Robustness checks and further comments
Among residents in the museum city, knowing how the exhibition was displaced and having already visited it, does not seem to increase the probability to revisit it (Statues_visited coefficient is not statistically significant, but it maintains the positive sign). At the same time those who have not this information were less likely, overall, to return to the museum, especially in Cagliari (Statues location information_no is negative and statistically significant for the pooled sample and Cagliari). This effect has not been found for Cabras.
To disentangle the link between visitors to the Cagliari and Cabras exhibitions and identify if visiting one exposition causes visits to the other, a set of further checks is performed. A first control is for those who did not know about allocation of statues and the exhibition shared between two places (Statues location information_no) as before, and those who had the information but did not visited it yet (Statues location information_yes). Changing the controls for the information availability allows to strengthen previous results (Table A2 in Online appendix is presented in shorter version as the other coefficients stay stable): In fact, the negative sign of the Statues location information_yes coefficient confirms that a spill-over effect arise if the other part of the exhibition is visited and not only from knowing that it exists. Those who have not the information about the displacement were less likely to visit one of the two museums, compared to those who already visited one. This result is consistent also across locations and across 1-day visitors (Table A3) and residents in the museum city (Table A4) among which having the information makes the difference only for those who visited Cabras (Table A3, model 3).
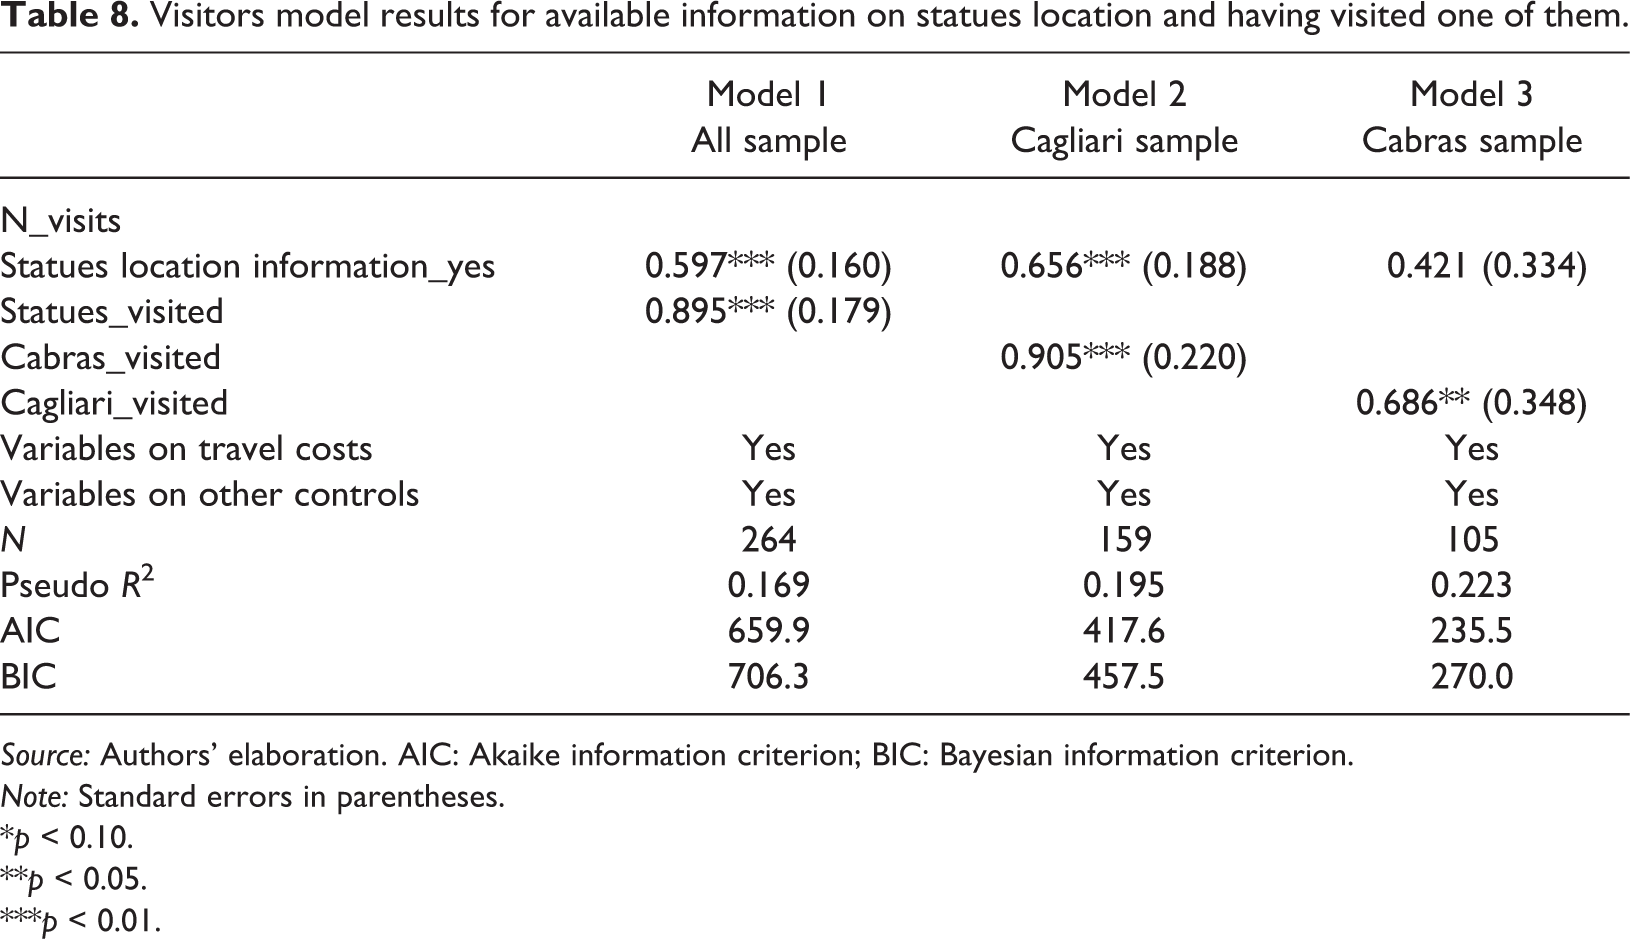
The second set checks for those who had the information (Statues location information_yes) and those who visited already one place (Statues_visited). To better highlight the effect for the subsample of Cagliari, a dummy variable was created to check for those who already visited Cabras (Cabras_visited) and vice versa (Cagliari_visited). Table 8 presents a shorter version of the regression results as the other coefficients stay stable; the positive and statistically significant coefficients of the variables controlling for having already visited one of the two expositions reveals the importance of the spill-over effects between the two museums. The findings suggest in turn that having visited one of the exhibitions before increase the overall visitation rate (Statues_visited) and that having visited Cabras increase (Cabras_visited) the visitation in Cagliari and vice versa (Cagliari_visited). Figures 2 and 3 (Table 9) show the role played by the previous visit on the other part of the exhibition: having visited Cabras rises the visitation in Cagliari and contrariwise. Indeed, Figure 2 compares the predicted number of visits in Cabras and the previous visits in Cagliari. The predicted number of visits for those that did not go to Cagliari (Cagliari_visited = 0) is about 0.90, while for those that visited Cagliari before (Cagliari_visited = 1) is higher at 1.78. The predicted number of visits for those who went to the other part of the exhibition is two (1.78/0.90 = 1.98) times higher than the predicted count for those who did not visit it previously. Figure 3 shows the predicted number of visits in Cagliari and the previous visit in Cabras. The predicted number of visits for those that did not go to Cabras (Cabras_visited = 0) is about 1.78, while for those that visited Cabras before (Cabras_visited = 1) is higher, at 3.38. Once again, the effect on the number of visits of having seen the other part of the exhibition is two (3.38/1.78 = 1.90) times higher compared to the effect of not having visited it previously. The positive effect of the available information is partially confirmed also for the subsamples of 1-day visitors (Table A5) and residents in the museum city (Table A6).
Visitors model results for available information on statues location and having visited one of them.
Source: Authors’ elaboration. AIC: Akaike information criterion; BIC: Bayesian information criterion.
Note: Standard errors in parentheses.
*p < 0.10.
**p < 0.05.
***p < 0.01.

Predicted number of visitors to Cabras according to a previous Cagliari visit.
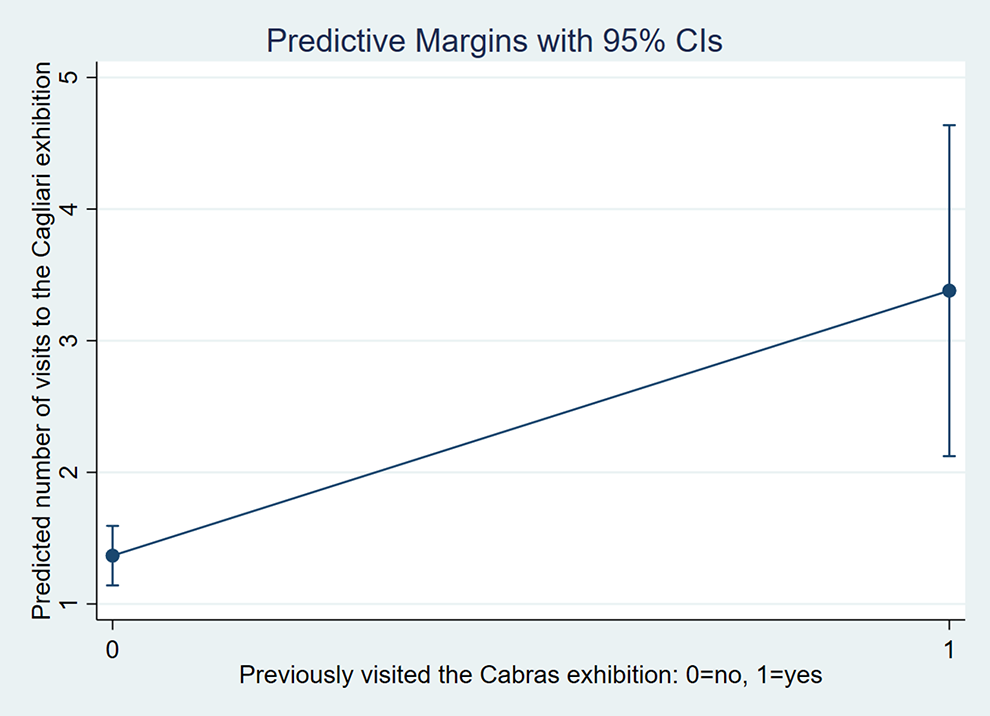
Predicted number of visitors to Cagliari according to a previous Cabras visit.
Predicted number of visitors.
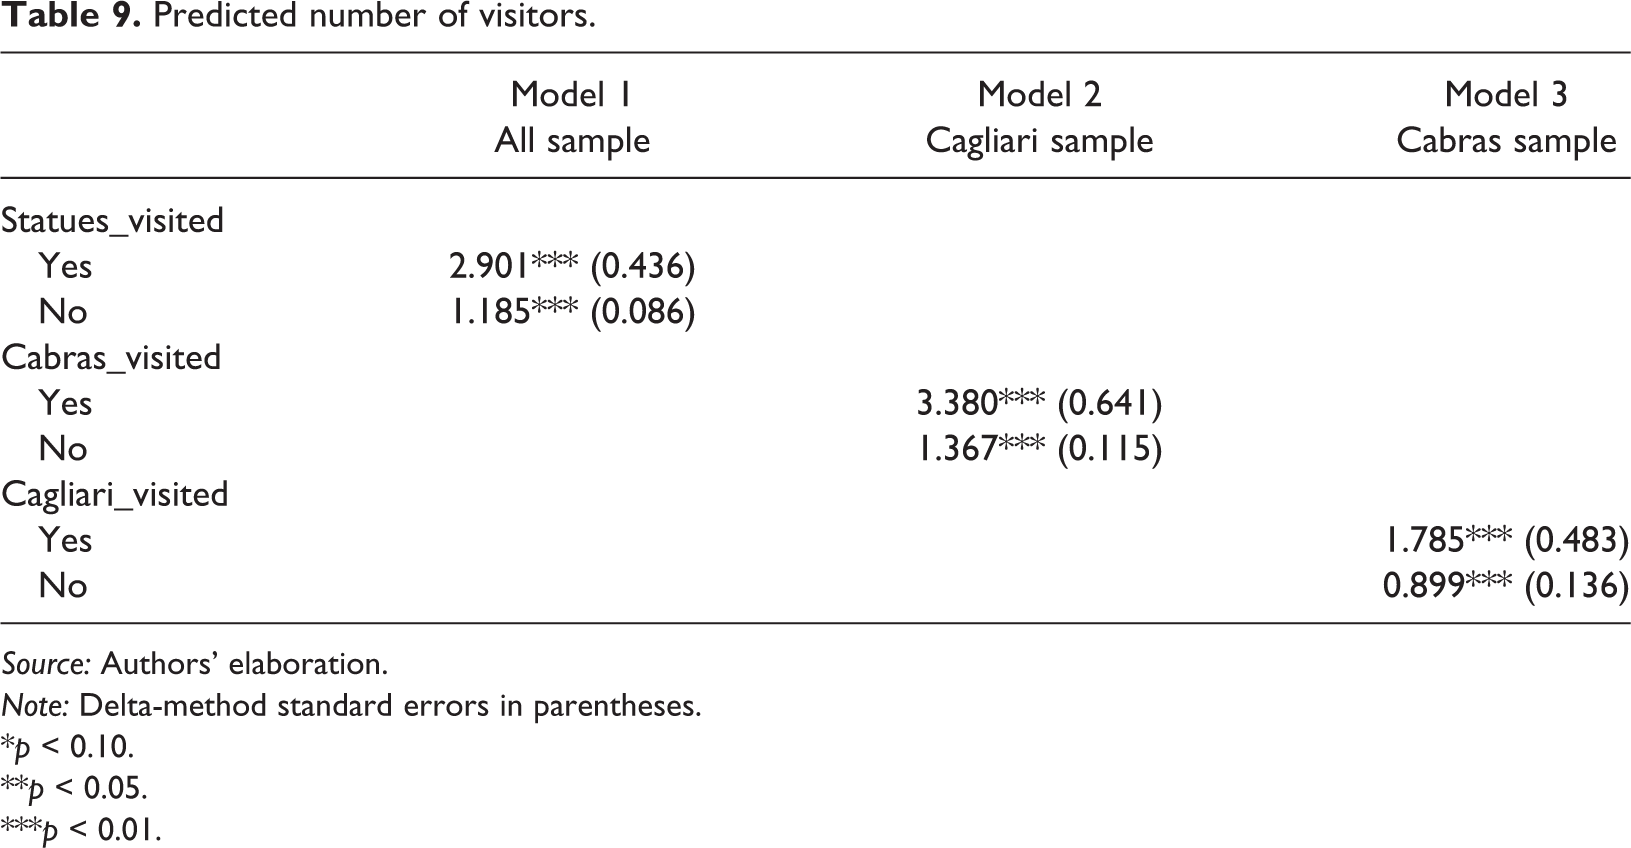
Source: Authors’ elaboration.
Note: Delta-method standard errors in parentheses.
*p < 0.10.
**p < 0.05.
***p < 0.01.
Conclusions
A common feature of tourism and culture is the capability to attract visitors to destinations, positively influencing their competitiveness and promoting growth. However, the cultural segment can be exploited to divert tourism flows in both the low and the regular seasons (Cisneros-Martínez and Fernández-Morales, 2015). Indeed, when cultural heritage becomes a strong tourist attraction, it is important to prevent negative effects and overtourism. Policymakers, therefore, have to consider win–win scenarios as the features of some cultural goods allow them to be displayed in a unified form in a single location or separated into two or more locations. Economic theory has shown that returns can be either efficient or inefficient (Halonen-Akatwijuka and Pafilis, 2009): if generated by changes in the assessment of the cultural good – that is, if the value of the separated cultural goods is reduced – returns can be optimised. Taking into account tourists’ preferences, therefore, may provide a helpful tool to make sustainable choices in cultural heritage management associated with tourism development policies.
The present research contributed to this debate an empirical analysis of the case of the Giants of Mont’e Prama, a well-known heritage complex of archaeological stone statues found in Sardinia (Italy) in 1974. Specifically, the analysis exploits the travel cost method approach to interpret the linkages between the two exhibitions of the same cultural good. This methodology consents to verify the linkage between the two collections considering costs, notoriously a constraint. To the authors’ knowledge, this study marked the first attempt to evaluate a cultural good and its spill-over effects from this perspective. To apply the proposed framework, the same questionnaire was randomly distributed at the sites following a snowball sampling process. Based on a final sample of 345 questionnaires, an empirical count data model was estimated to understand how the exhibition created benefits for society and the corresponding use value. Furthermore, monthly data from MIBAC were used to test the overall spill-over effects between the two expositions, that is, the causal relationship between the number of visits to Cagliari and Cabras.
The analysis showed that in line with theory, museum visits decreased as travel costs increased. This same result was found for the Cagliari sample but not the Cabras sample. Furthermore, the findings indicated some spill-over effects from the statues’ displacement. Interestingly, compared to those with knowledge, those who declared that they did not know how the exhibition was arranged were less likely to return to the museum in Cagliari but not in Cabras. As robustness check, a subsample of 1-day visitors and another of Sardinian residents was considered to validate the findings. Overall results confirm them, but in the Cagliari case travel costs do not matter anymore. The opposite occurs in the case of Cabras meaning that reaching this destination is more costly due to its peripherical position.
Overall, the research results supported the hypothesis that this allocation of cultural goods (the statues) could be considered to be a win–win solution. Cagliari benefited as visitors flows could be diverted to Cabras, lowering the risk of overtourism in the urban context. Cabras gained visitors flows because the statues’ presence in the capital city allowed people to discover the existence of the Giants of Mont’e Prama. Future research could further investigate the sustainability of this allocation by considering residents’ opinions and the corresponding economic values to account for preferences regarding exhibition displacement. Moreover, the same approach could be applied to case studies with similar circumstances and data.
A future development of this study could be to deepen the relationship between the Cagliari and Cabras visitors flows by employing a causality test and controlling also for other neighbouring and similar museums.
Supplemental Material
Supplemental Material, sj-docx-1-teu-10.1177_1354816620987676 - Together or not? Spill-over effects of cultural goods displacement
Supplemental Material, sj-docx-1-teu-10.1177_1354816620987676 for Together or not? Spill-over effects of cultural goods displacement by Maria Giovanna Brandano and Marta Meleddu in Tourism Economics
Footnotes
Declaration of conflicting interests
The author(s) declared no potential conflicts of interest with respect to the research, authorship, and/or publication of this article.
Funding
The author(s) disclosed receipt of the following financial support for the research, authorship, and/or publication of this article: Maria Giovanna Brandano acknowledges the financial support provided by Regione Autonoma della Sardegna (POR FSE 2007-2013).

Supplemental material
Supplemental material for this article is available online.
Notes
Author biographies
References
Supplementary Material
Please find the following supplemental material available below.
For Open Access articles published under a Creative Commons License, all supplemental material carries the same license as the article it is associated with.
For non-Open Access articles published, all supplemental material carries a non-exclusive license, and permission requests for re-use of supplemental material or any part of supplemental material shall be sent directly to the copyright owner as specified in the copyright notice associated with the article.
