
Abstract
The notion to travel to a tourist destination is often based on competitiveness aspects. The efficiency of these target markets is, however, not clear, and this article will determine the efficiency of tourists visiting South Africa, which will be categorised according to demographic aspects in relation to cost and competitiveness. Empirical evidence by means of the data envelopment analysis model found that South Africa is currently facing poor price competitiveness in different markets from tourists across different demographic backdrops. Results indicated that age, gender, time spent and continent of origin cause tourists to perceive South Africa as a price competitive tourist destination, differently. Being able to determine these efficiencies for different demographical markets, destination marketing officers will be able to use competitiveness and cost attributes as indicators to which markets will respond. Tourism councils must ensure that the correct information reaches visitors through advertising and marketing campaigns, as visitors’ expectations must be managed to improve the perceived price competitiveness of South Africa’s tourism industry. The findings have clear implications for DMOs’ managers regarding the designed marketing campaigns for South Africa as a tourist destination, especially for segments under investigation in this study.
Introduction
The growth of travelling markets globally intensifies rivalry among destinations, making tourism an extremely competitive industry (Cronjé and Du Plessis, 2019). Competition is the nature of the tourism industry. The Economist (1998), as cited by Crouch (2007: 1), noted that while there may be more tourists going around, there is also more competition between destinations as cities, countries and continents latch on to the charms of tourist revenue. Therefore, the notion of increased tourism and economic research that focuses on the transition from mass tourism to an alternative of tourism calls for a tailor-made approach to analyse the specific attitudes and needs of tourists (Gracolici et al., 2008). Adding to this is the change in tourist characteristics and economic climate, putting more strain on the disposable incomes of tourists, which will force destination marketing organisers and researchers to rethink their strategy to sustain a competitive advantage.
To fully comprehend the logistics and importance of destination competitiveness, it is important to understand the definition, the theories of the concept and how destination competitiveness is being measured. The most frequently used and accepted definition with tourism literature is the definition by Ritchie and Couch (2003: 2), which states that what makes a tourism destination truly competitive is its ability to increase tourism expenditure, to increasingly attract visitors while providing them with satisfying, memorable experiences, and to do so in a profitable way, while enhancing the well-being of destination residents and preserving the natural capital of the destination for future generations.
This proves the obstacle at hand when attempting to fully understand the idea of competitiveness within tourism that has been described as multidimensional, relative and multifaceted, including various numbers of components that make it problematic to measure (Enright and Newton, 2005: 349; Eraqi, 2009: 15; Navickas and Malakauskaite, 2009: 38; Ritchie and Crouch, 2010: 1050). It is clear that debates exist on how to develop and sustain a competitive advantage, especially when one considers the different circumstances, different destinations, developed or developing countries, different sectors in the tourism industry, to name but a few. Different perceptions are evident in literature where scholars investigated either demand or supply perceptions and approaches, factors/aspects/indicators of tourism competitiveness and how to sustain that advantage and developing models within the industry (Dupeyras and MacCallum, 2013; Dwyer and Kim, 2003; Enright and Newton, 2005; Gomezelj and Mihalic, 2008; Gooroochurn and Sugiyarto, 2005; Hafiz Hanafiah et al., 2016; Hong, 2009; Pansiri, 2014; Ritchie and Crouch, 2010).
Traditional competitiveness models could not be implemented within the tourism industry and destination competitiveness models were developed by researchers such as Poon (1992), Heath (2003), Croes and Rivera (2010), Dwyer and Kim (2003), Enright and Newton (2004), Ritchie and Crouch (2000, 2003) and Crouch (2011) (to name but a few) with the primary aim to develop a competitiveness model that will provide guidance to the tourism industry on how to offer the competitive product, seeing that the product is service intensive (Du Plessis et al., 2017). This means that it is intangible and different from other products (Dwyer and Kim, 2003: 369) and provided to different customers (Flagestad and Hope, 2001: 457). These models should not necessarily be used to make the final decision, but rather assist in the decision-making process (Ritchie and Crouch, 2003: 62), taking into account that destination competitiveness is and can be measured differently.
Literature indicates that destination competitiveness can be classified into objectively or subjectively measured variables. Finding available data for each measure of destination competitiveness could be very problematic where many of the feature measures are multidimensional, abstract or inaccurate and it was also mentioned that many indicators are not always quantifiable and may be subjective (Crouch, 2011: 371). The other approach concerning qualitative data or ‘soft measures’ is used to measure competitiveness using survey data of tourists’ opinions and perceptions (Bahar and Kozac, 2007; Cracolici and Nijkamp, 2008; Kozak, 2002), which implies that tourists might evaluate the standard components of destination attractiveness but are uncertain about the various factors that influence and determine the competitive position of a tourism destination (Enright and Newton, 2005: 340). However, the World Economic Forum and Travel and Tourism Competitiveness Index used the approach that was based on the empirical evaluation of a number of subjective indicators of tourism competitiveness, surveyed on key tourism stakeholders and once again referring to the various models (Crouch, 2007; Gomezelj and Mihalič, 2008; Knežević Cvelbar et al., 2016; Lee and King, 2009).
To sustain a competitive advantage, destination management organisers should consider all the above-mentioned information and are sometimes forced to take one approach at a time to keep up with the increased competition on an international scale (Genc and Pirnar, 2008: 122). Consequently, DMOs often rely on the proper target audience – which refers to the demand orientation as described in destination models – and various marketing campaigns to maintain its competitive advantage. The destination management organization utilizes the integration and coordination of factors related to the destination, such as accommodation, transport, entertainment, activities and natural resources to better formulate a marketing campaign and branding that best appeals to the target market and its consumers. Marketing agencies acknowledge the fact that external aspects have an impact such as the location of the destination (travel time), the climate, as well as political and economic stability, but the question is how to use these external circumstances and attributes to their advantage through proper management, marketing, positioning and branding answering to the needs of tourists. Destination marketing organisations should focus on supplying the tourists with satisfying experiences and at the same time focus on providing the tourism destination with social, physical and economic benefits. Furthermore, Vengesayi (2003: 639) argues that if a destination marketing organisation can achieve both attractiveness and competitiveness, the competitiveness of the destination will surely increase.
This research article will focus on the relevance of South Africa’s costs and competitiveness aspects in relation to the factors that contribute to competitiveness. Another aspect that will be covered is how a country can relieve costs by looking at the time spent, gender and continent of origin of tourists to South Africa.
Tourism literature showcases that the understanding of a destination’s attributes and how this correlates with the tourist motivation to travel to the destination is greatly influenced by appropriate segmentation of the market (Um et al., 2006: 1142). The socio-demographic factors are important to identify, as it could assist with the accurate segmentation and understanding of target markets in relation to the destination’s image and its attractiveness to tourists (Kara and Mkwizu, 2020: 83).
Shahrivar (2012) agrees with the important role demographic factors play in the travel decision-making and satisfaction of tourists. The demographic segmentation was highlighted by various studies, for example the investigation of gender in developing media planning as a key driver in marketing areas (Okazaki and Hirose, 2009). Andreu et al. (2005: 2) found that the female motivation to travel and the type of destination to travel were stronger than that of their male counterparts. Females were more frequently looking for destinations that would provide the opportunity to relax and escape, whereas males were looking for recreation and activities that are ample at the chosen destination. Xie et al. (2008: 3) support this research by indicating that women are more inclined to participate in shopping, dining and cultural activities, whereas men are more likely to participate in adventure activities. Women are also more influenced by the attractiveness of the destination, but men are more likely to revisit (Lee et al., 2009: 18; McGehee et al., 1996: 45). Saayman and Saayman (2009: 1) also indicated that, within a South African National Park context, the different genders’ spending behaviour is different.
In another study by Li et al. (2013: 147), the researchers contend that ‘tourists’ generation membership could affect travel thoughts, decisions and behaviors’. It is clear from the work of Tsiotsou and Ratten (2010) and Kozak (2001), which states that it is important to firstly acknowledge the changing demographics of the new tourists and secondly to compare different groups and nationalities regarding the tourist experience satisfaction. This would enable DMOs to better understand the difference in behaviour and characteristics. With this information at hand, different tourism marketing approaches must be developed to overcome stereotypes and alter a sustainable advantage.
The application of the data envelopment analysis (DEA) model in evaluating macro- and micro-efficiency in tourism has already been justified by the literature (see e.g. Bell and Morey, 1995; Sigala, 2004; Van Heerden and Saayman, 2018). Research on tourism competitiveness using the DEA approach is limited but not uncommon. Assaf and Josiassen (2012) conducted a study on the determinants of tourism performance using the DEA and identified the 10 most negative determinants of tourism performance which in itself influence tourism competitiveness. Barros et al. (2011) and Botti et al. (2009) used the DEA method and compared destination competitiveness and performance of French tourism destinations. Tourism competitiveness and the efficiency of different regions in Italy was determined by the DEA and results indicated that Italian regions do not show a significant change in efficiency over the years that were considered (Cracolici et al., 2007). Wu (2011) made use of the DEA, GST and ANN ranking methods to develop a tourism competitiveness ranking system. Given the international literature on tourism competitiveness using the DEA efficiency model, it does seem that limited DEA applications with special reference to South Africa’s competitiveness in terms of tourism have been attempted, making this a novel study in establishing its applicability as a performance management tool to improve tourism competitiveness.
The limited research and with other tourism studies using different decision-making units (DMUs) and different time horizons will, however, undermine the ability to produce a comparative study.
Nevertheless, this novel and exploratory study utilised a multistage DEA model to identify the extent to which the level of competitiveness and cost for male and female must be improved from an input-oriented approach. As X-efficiency is considered to be an important strategic and policy consideration (Molyneux et al., 1996), this study will set X-efficiency as the objective (Mester, 1993; Sathye, 2001) to generate efficiency scores that will characterise the utilisation of limited resource (Førsund and Hjalmarsson, 1974). The study by Leibenstein (1966) was the first to introduce the concept of X-efficiency. Originally, Leibenstein (1977) argued that technical efficiency is a manifestation of X-efficiency, which may be due to imperfections in the market (Leibenstein, 1966), such as an absence of competitive pressures. However, the concept of X-efficiency essentially consists out of technical efficiency, which reflects the ability to obtain maximum output from a given set of inputs, and allocative efficiency, which reflects the optimal use of inputs, given their respective prices (Akhtar and Nishat, 2002). This means that X-inefficient would imply that visitors are either wasting (technical inefficiency) their inputs (overspending – wasting too much money) or using the wrong combination of inputs (allocatively inefficient) (adapted from Sathye (2001)), where the latter falls outside the scope of this study. The multistage DEA model has been proposed by Coelli (1998) as a solution to slack problems to identify more respective efficiency estimates compared to the more commonly used two-stage linear programming process (Ali and Seiford, 1993). This model is gaining increasing prominence in the literature, with evidence suggesting that a DEA conducted in multiple stages yields more reliable information (Coelli, 1998); it has a sound economic basis (Cherchye and Puyenbroeck, 2001); it has the ability to capture the interdimensional impact of inputs across different stages of output-realisation (Wu and Callarman, 2006); it has the ability to place more emphasis on inputs that are within management’s control (Muñiz, 2002); and it has the ability to not only identify overall efficiency but also the efficiency of subprocesses (Ang and Chen, 2016; Mahdiloo et al., 2016).
Although the literature has propose several DEA alternatives, including different two-stage process, there is still no consensus on model superiority and no evidence to support the notion to adapt a different model for this study. In fact, studies such as Zhu (2003) and Chen and Zhu (2004) have provide evidence to suggest that some modified two-stage processes may be bias, as some may conclude that two inefficient stages can lead to an overall efficient DMU (with inputs from stage one and outputs from stage two), which consequently can distort the improvement to the DEA frontier. In this study, the multistage DEA model was estimated by means of the DEA Frontier software, a DEA add-in for Microsoft Excel® developed by Zhu (2016).
Efficiency measurement by adopting the DEA model
The measuring of efficiency was first introduced by Farrell (1957), who proposed the use of an equi-proportionate reduction in current inputs to produce predetermined levels of outputs. This could be executed by means of a non-parametric, non-stochastic, mathematical programming framework that is more commonly known as the DEA model (Charnes et al., 1978). The original DEA model was limited to a constant returns to scale (CRS) perspective (Charnes et al., 1978), but based on the work of Shephard (1953), the Banker et al. (1984) model was developed with the ability to adopt a variable return to scale (VRS) approach to account for possibilities such as capacity limitations on inputs. Nevertheless, under a CRS or VRS perspective, the DEA model exhibits the ability to solve LP problems that generate a non-parametric, piecewise-linear, convex frontier (Färe et al., 1985). The DEA model does not require any assumptions of a functional form relating inputs to outputs and focuses on the observed best-practice frontiers rather than on central tendency properties of frontiers (Charnes et al., 1978; Nunamaker, 1985). The DEA model has the ability to measure relative or comparative efficiency in terms of the inputs and outputs of a DMU or visitor under evaluation. It benchmarks the non-best practices with best practices to determine the extent of inefficiencies (Avkiran, 1999; Jaforullah and Whiteman, 1999). Even though the DEA fails to address the problem of output assessment, it combines multiple inputs and outputs in a single, non-arbitrary, non-subjective manner via the criterion of Pareto efficiency without prior weight specifications (Nunamaker, 1985).
With the equivalence of a maximum likelihood estimation (Banker, 1993), the estimators of the DEA model are considered to be consistent, unbiased, with the ability to converge faster than that of other frontier methods, and have no assumption of any underlying model or reference technology (Grosskopf, 1996; Kittelsen, 1999). These distinguished features already enabled a vast array of applications, as reported by Liu et al. (2013). Also, with its modelling flexibility and ability to accommodate qualitative and quantitative data and multiple non-discretionary and discretionary inputs and outputs simultaneously (Golany and Storbeck, 1999; Kirigia et al., 2001; Nunamaker, 1985), make the DEA model ideal to enable any country’s tourism council to investigate numerous dimensions of questionnaires, as it incorporates the interdimensional relationships that exist between inputs and outputs in the estimation of visitors’ inefficiency levels (Cooper et al., 2007). These inefficiencies in total expenditure (overspending) or in competitiveness can serve as a guideline in the development of tourism destination competitiveness and to improve tourism sustainability (Van Heerden and Saayman, 2018). Nevertheless, keep in mind that the efficiency scores are still limited to the restricted variables that were available (Berg et al., 1991).
Methodology and data
It was evident from the literature review that research focusing on the demand side that could fill the gap in literature towards tourism competitiveness is lacking. It is important to conduct this research from the demand side seeing that there is a continuous growth in tourism, which means that more tourists hold their own opinions concerning what the factors are that contribute to the competitiveness of a destination. For marketing purposes, the application of the DEA model results would provide more insight. The next section is a brief description of the methods used to obtain, capture and analyse the data to achieve the goal of this study. The survey done at the international airport allowed researchers to fully explore the data that focussed on a representing sample of international tourists to South Africa as a tourist destination.
Questionnaire and sampling
The initial goal of the questionnaire was to investigate the competitiveness of South Africa as a tourist destination from a demand point of view using quantitative research and capturing descriptive and exploratory data. The questionnaire consisted of both structured and unstructured questions and included the following sections: Section A consisted of demographic information on gender, birth year, country of residence, companion of travel of the respondent, type of tourist, estimated spending, price competitiveness of South Africa’s prices, duration of visit, person who initiated the visit to South Africa, reason for visit, attractions visited and memorable experience. Section B focused on factors contributing towards destination competitiveness, the strengths and weaknesses of South Africa, importance of destination competitiveness and destination preference of tourists. The questionnaire was developed focussing on 36 attributes that influence destination competitiveness on a 5-point Likert scale where 1 = no opinion, 2 = no importance, 3 = some importance, 4 = important and 5 = very important. Section B was based on studies by Du Plessis (2002), Porter (1990)), as well as Ritchie and Crouch (2003) and Hong (2009). This section included internal and external attributes such as the location of the destination, quality of food, the friendliness of locals, marketing and communications systems.
For this specific study, the focus was drawn on questions focusing on gender, place of origin, duration of visit in South Africa and different sectors’ competitiveness overall and competitiveness in terms of prices, which included food, accommodation, transport, souvenirs, activities, shopping and tour packages.
The questionnaire was distributed at OR Tambo International Airport. The survey was divided into two segments, including a winter and summer survey, which captured both of these markets. The first survey was conducted from August 2017 to September 2017 and the second survey between December 2017 and January 2018, at OR Tambo International Airport. The sample population is divided into separate or different strata. In this case, the strata include foreign respondents travelling back to their country from South Africa at OR Tambo International Airport in Johannesburg.
The survey was conducted by Ratile Research consultants who provide data collection services at the airport. There were 313 questionnaires distributed at the first survey and 309 at the second survey. Ratile Research distributed the 313 questionnaires in 2 months’ time and the 309 in 1 month’s time. In September, the first half of the survey was completed and the rest in January. However, some of the surveys were incomplete, limiting this study to use only 156 questionnaires.
Data analysis
The questionnaire limited this study to consider two input categories (see Table 1), namely total expenditure and South Africa’s tourism competitiveness as ranked by international visitors. Total expenditure entails accommodation, transport, sight-seeing, food and beverages, souvenirs, shopping and tour package costs. The tourism competitiveness rankings, on the other hand, include rankings provided for attractions, food and beverages, other transport, airline transport and accommodation. The inefficiency in competitiveness can be assigned to the overdependence on current facilities/attractions that can limit the potential for product innovation in destinations (Chais, 2008); the dependence on outdated facilities/attractions (Bob and Maharaj, 2015; Torres and Milman, 2020); wrong or lack of combination of facilities/attractions offered (Balkaran and Maharaj, 2013); the lack of trained staff to ensure optimal services (Gabora and Olteana, 2012); expectations of tourists are not aligned with the destination image projected; expectations are not met due to unrealistic demands or failure of destination to deliver projected promises (Banyai, 2010); poor information and marketing (Booyens, 2010); misleading advertisements or the destination is oversold by outdated pictures and information (Pamela et al., 2008). This implies that this study will assume that from an input-oriented perspective, higher technical efficiency can only be obtained if visitors pay less (do not overspend) and if South Africa exhibits a high level of price competiveness. The latter will be incorporated by utilising the competitiveness rankings provided by the visitors, where a ranking between 1 and 5 was assigned to rank the competiveness of prices (with 5 being most competitive) (see Table 1). This implies that the inverse of the competitiveness rankings will be implemented to ensure the correct interpretation of the efficiency scores.
Selected input and output variables for measuring technical efficiency.
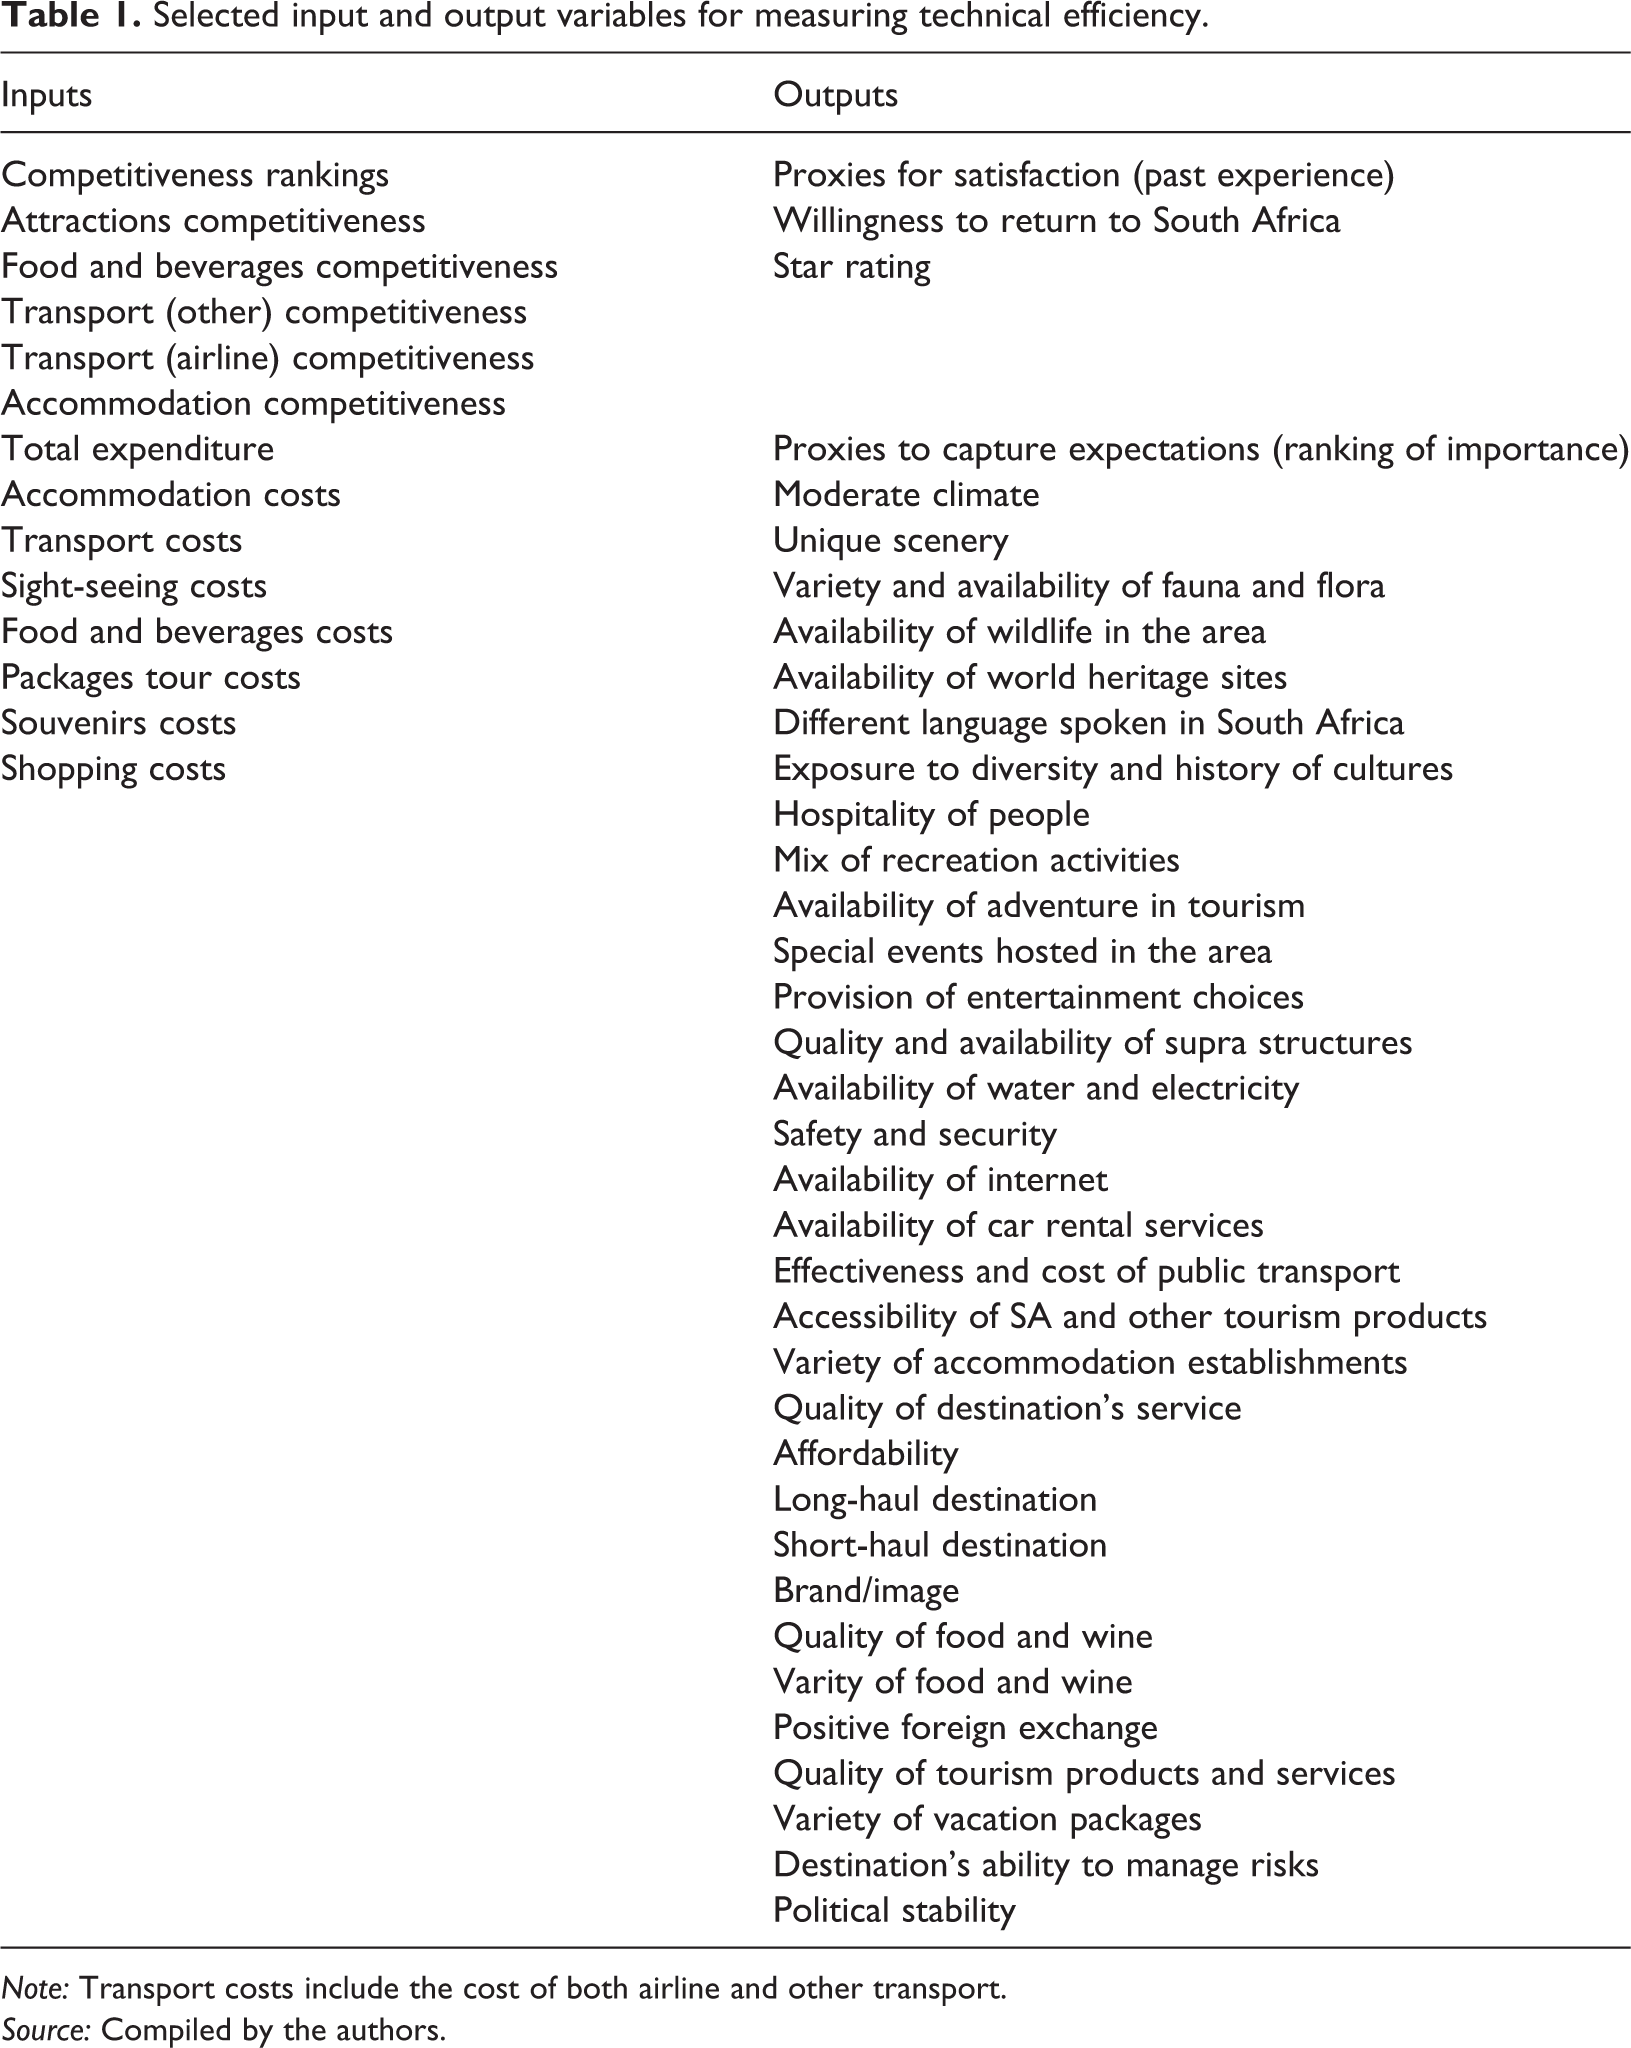
Note: Transport costs include the cost of both airline and other transport.
Source: Compiled by the authors.
However, tourism outputs’ intangibility and the ceteris paribus problem, which entails the difficulty to compare one tourism unit with other over a certain time horizon, still pose a problem in efficiency measurement (Fuchs, 2002; Jones and Hall, 1996). Nonetheless, the literature still emphasises the importance of considering the level of satisfaction as an output, as it is argued to be a vital contributor to tourism sustainability (Meng et al., 2008). Additionally, the significance of how past experiences can lead to greater future attendance must be acknowledged (Elicks, 2010; Lee et al., 2011; McCarthy and Jinnett, 2001). This led to the initiative to consider two output categories (see Table 1), which entail the visitors’ tendency to visit South Africa again and the star rating provided by the visitors as proxies for past experience/satisfaction. This implies that input-oriented efficiency scores will be estimated under the assumption that the probability of greater overall experience/satisfaction can only be realised if visitors’ past experience was good (if they reported that they will come again and if they provided a high star rating). Furthermore, as tourists’ expectations of a destination will influence their level of satisfaction (Aksu et al., 2010), this study incorporated 32 additional output proxies to capture the expectations of the international visitors under evaluation (see Table 1). These proxies entail the rankings provided by visitors on the importance of certain elements during the duration of their stay in South Africa.
Results
From Table 2, it is evident that there is not a significant difference in the demographic profile of the sample under evaluation, as 53% of the visitors were male and 47% were female. However, it was interesting to note that the most likely international tourist will be a male of about 40 years of age. According to Kotler et al. (1999), this demographic group can be classified as ‘Generation X’. Generation X were born between 1964 and 1979 and are considered to be sceptical, wary, experienced consumers who are value-conscious and prefer lower prices; share cultural, environmental and social concerns; respond to honesty in advertising; and seek higher life quality (Fountain and Charters, 2006; King, 2001; Tassiopoulos et al., 2004). The implication is that these visitors will be well informed of what constitutes a good South African experience/visit, making it a daunting task to improve competitiveness through only enhancing current facilities and products. However, more emphasise will have to be placed on tour package combos (or price specials/discounts) to increase overall satisfaction but also to initiate the desired spillover effect by attracting additional friends or family members to increase future attendance (McCarthy and Jinnett, 2001; Van Heerden and Saayman, 2018). Furthermore, according to Table 2, females had a greater tendency to visit South Africa for a longer duration compared to males, where the duration of females also exceeded the average duration of the entire sample. There is especially a significant difference in the percentage of females who visited South Africa for 15 to 21 days, compared to males. Furthermore, besides the fact that the majority of visitors preferred a duration of 1 to 7 days, there is a smaller percentage of visitors who preferred to stay for longer than 14 days. These results justify the notion that if tour package combos should be the preferred choice to improve overall competitiveness, these tour package combos will not only have to be tailored for both male and female (Van Heerden and Saayman, 2018) but should exhibit cost-saving implications to encourage longer visits to South Africa.
Summary of data sample under evaluation.
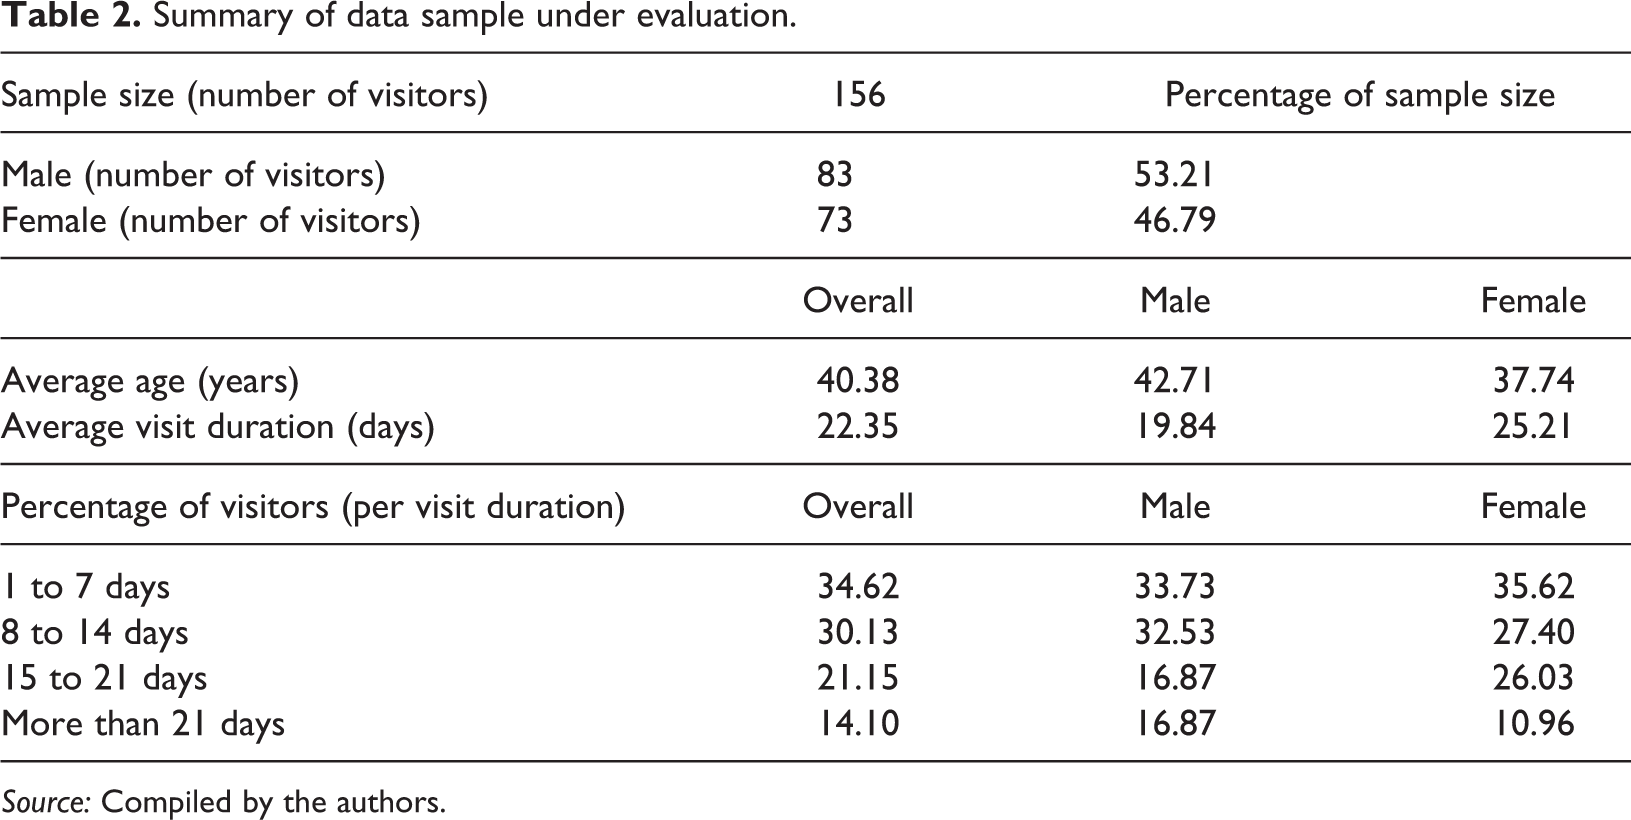
Source: Compiled by the authors.
The above-mentioned argument can be substantiated by the results reported by Tables 3 and 5, which accentuate the presence of overspending and poor price competitiveness (low technical efficiency scores). Visitors from Asia (0.34) exhibited the highest level of overspending, followed by South America (0.47), Africa (0.56), North America (0.57) and Europe (0.64), respectively. Overall, this can be explained by the significant presence of overspending on sightseeing, food and beverages, transport and accommodation costs that exhibited efficiency scores of less than 0.6 (with 1.00 indicating no overspending). Additionally, accommodation (0.32), transport (0.38) and food and beverage (0.40) costs exhibited the lowest average efficiency scores across all five continents (see Table 3), which signifies the attractions/facilities where overspending is the highest. However, the level of overspending is the least for tour packages (0.68), which exhibited the highest average efficiency score. These results accentuate the argument that tour packages can be justified as being a viable tool to improve tourism competitiveness but must exhibit cost-saving implications. The study by Nguyen (2016) agrees with the latter by stating that overspending behaviour depends largely on the price of goods and services, but the importance of correct pricing must be acknowledged, as it can lead to greater efficiency, fairness and suitability in management (Laarman and Gregersen, 1996).
The technical efficiency for total expenditure (per country).
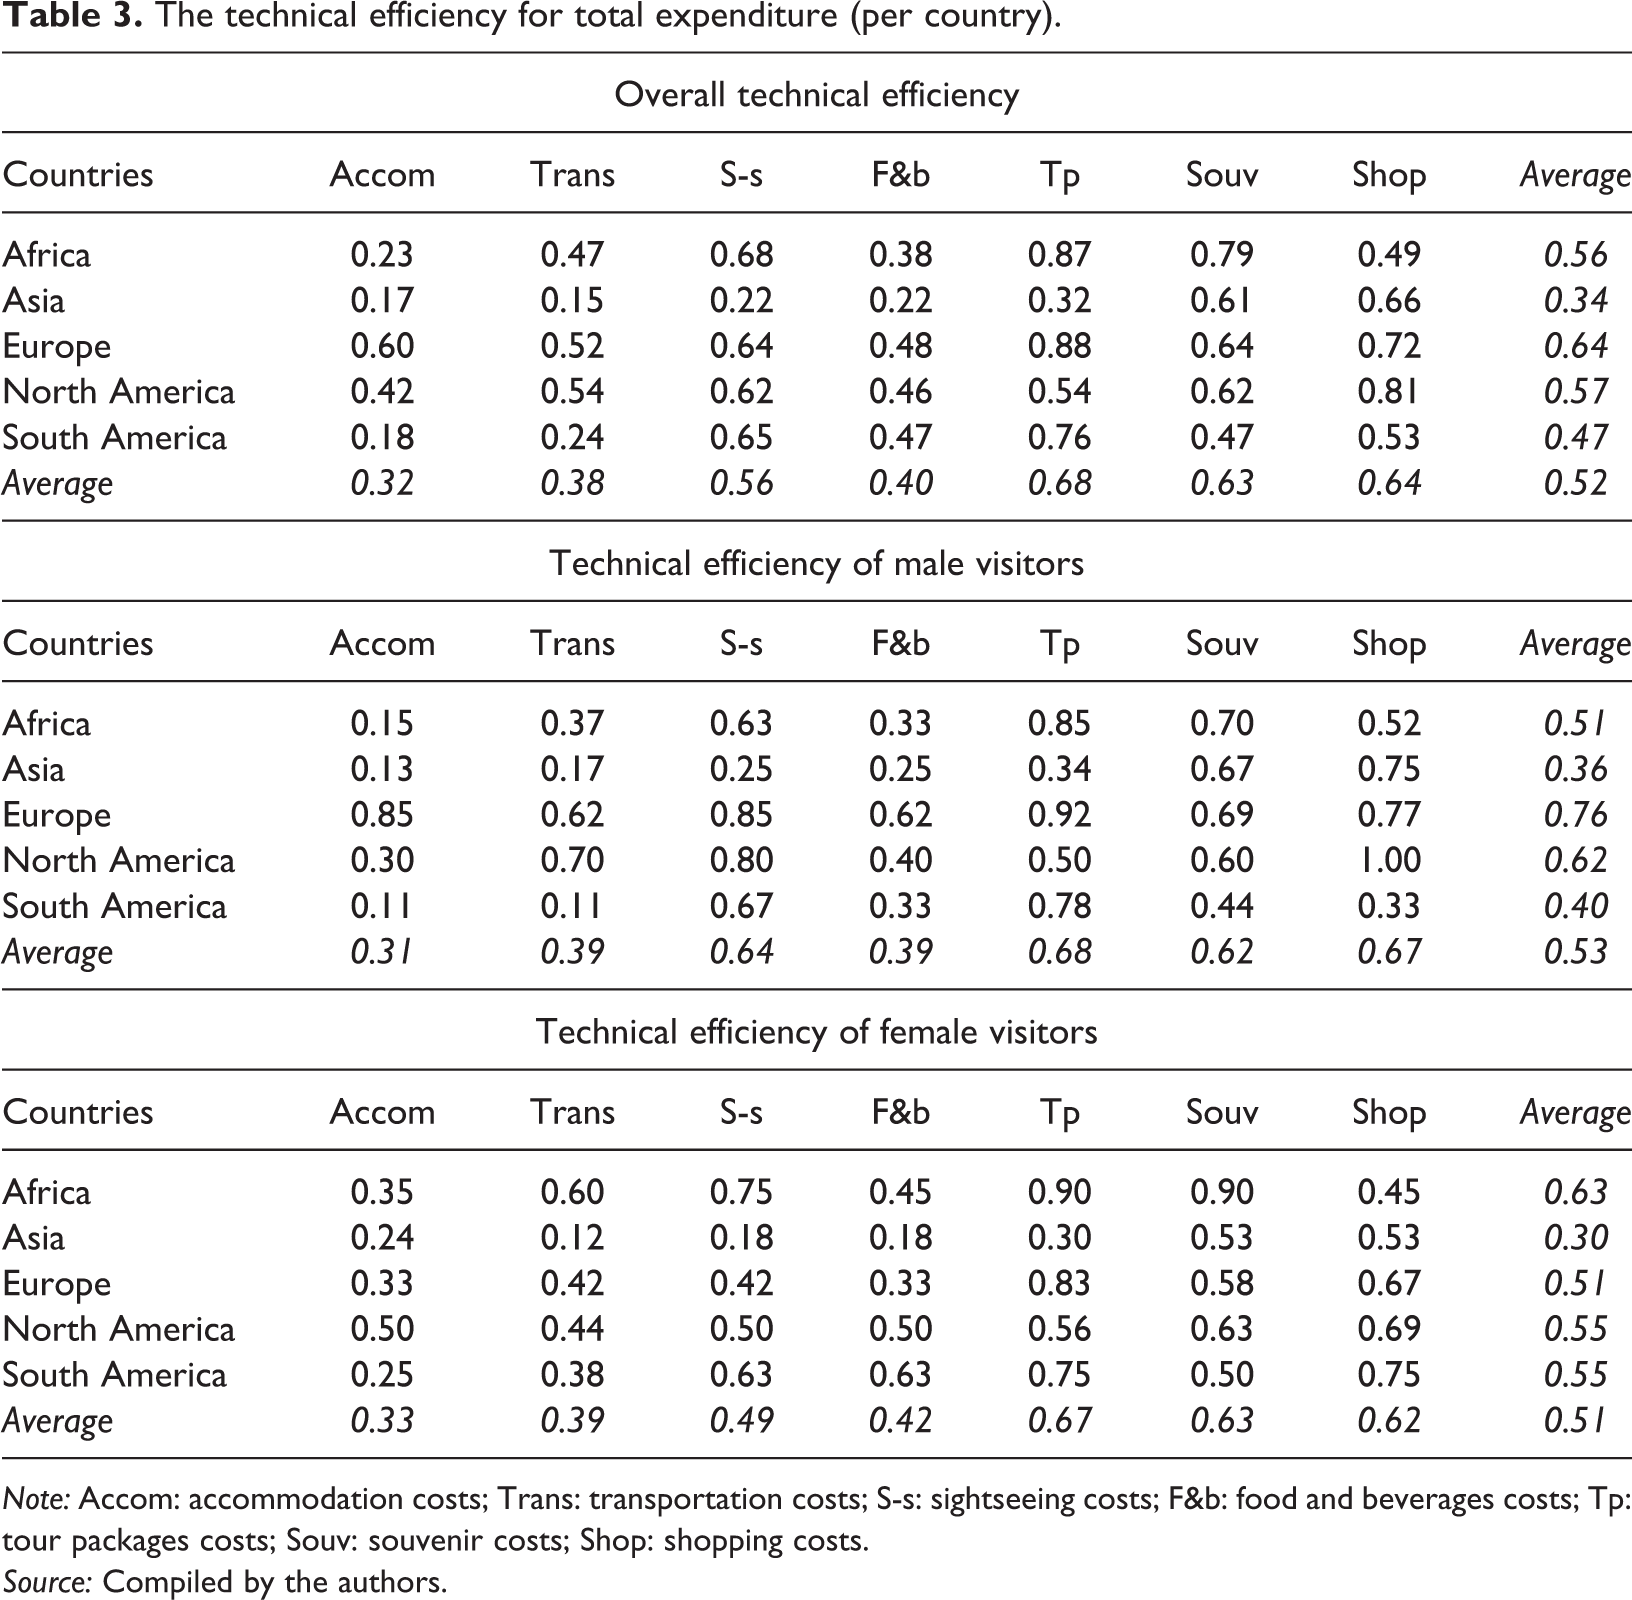
Note: Accom: accommodation costs; Trans: transportation costs; S-s: sightseeing costs; F&b: food and beverages costs; Tp: tour packages costs; Souv: souvenir costs; Shop: shopping costs.
Source: Compiled by the authors.
The technical efficiency for expenditure (per country over different visit durations).
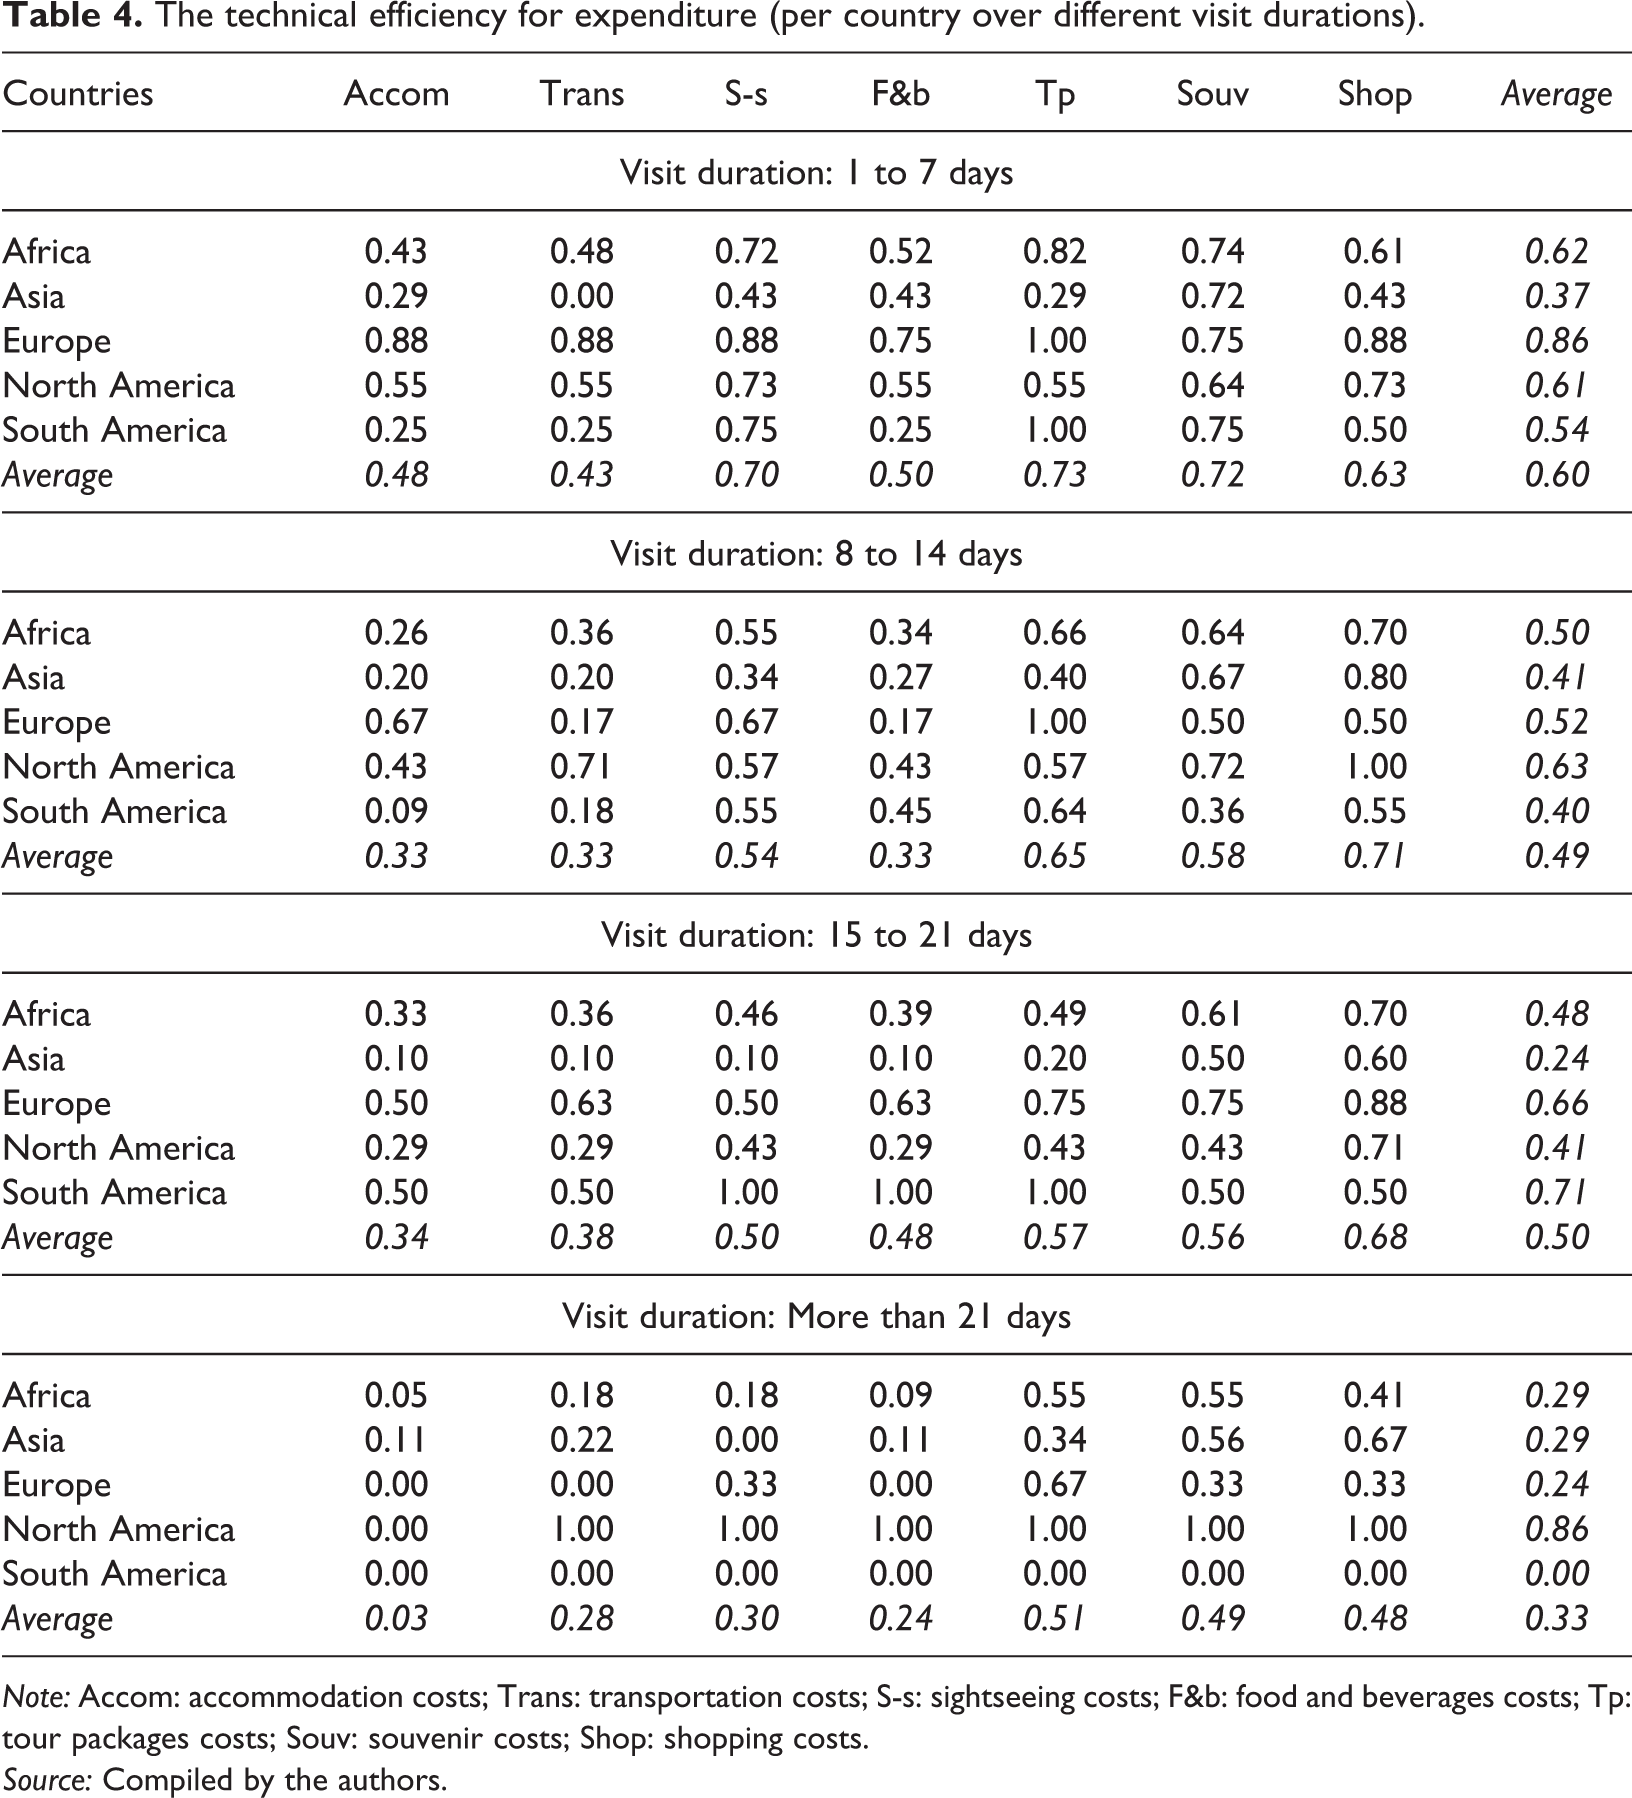
Note: Accom: accommodation costs; Trans: transportation costs; S-s: sightseeing costs; F&b: food and beverages costs; Tp: tour packages costs; Souv: souvenir costs; Shop: shopping costs.
Source: Compiled by the authors.
Furthermore, according to Table 3, tour packages must be strategically tailored and improved to enhance the level of satisfaction, as not all continents exhibited similarly high efficiency scores towards tour packages, for example Asia (0.32) and North America (0.54). An article featuring the reasons for tailor-made tour packages indicates that tour companies can secure bulk rates making tours cheaper (Kepnes, 2017). The argument of tailoring tour packages can further be motivated by the results reported by Tables 3 and 4, where Table 3 indicates that males and females exhibited different levels of inefficiency (overspending). To curb overspending, one can follow the example of Mauritius and Thailand as tourist destinations. These destinations are known for its tour packages that include flights, accommodation, food and beverages and certain activities. By limiting tourists to specific booked packages tourists can avoid overspending but the country introducing the best-tailored package to the tourists still ensures price competitiveness. Du Plessis and Saayman (2017) support this notion by referring to other South Africa research projects that recommend packages to add to the marketing and the perception of receiving value for money. Table 4 also signifies the importance of considering the duration of visits to South Africa in formulating tour packages. The results from Table 4 confirm that Generation X will be more cost-conscious when planning for longer visits, as the visit duration of more than 21 days exhibited overall a lower average efficiency score (greater tendency to overspend). The argument can again be raised for the case of tour packages. For the cost-conscious Generation X tourist, cost-conscious packages should be introduced by tourism stakeholders and for the longer type visitors tailor-made packages should also be introduced so that the tourist can save money too while visiting South Africa. It could serve in the best interest of both the long-term tourist and stakeholders if a give and take scenario is reached. With regards to longer type of visits to South Africa, the only two exceptions were for Asia (0.24) and North America (0.41), where the 15- to 21-day duration exhibited the lowest efficiency. Additionally, the North American visitors exhibited a higher average efficiency level (0.86) for the maximum duration compared to the shortest duration. It is also interesting to note that visitors from South America exhibited the lowest efficiency over the maximum duration (0.00), whereas North America exhibited total efficiency for all cost categories (1.00), except for accommodation costs that were totally inefficient (0.00). For the 1- to 7-day (0.37) and for the 15- to 21-day duration (0.24), Asian visitors exhibited the lowest efficiency (more overspending), whereas South America (0.40) and Asia (0.41) exhibited the lowest efficiency over the 8- to 14-day duration. In addition, besides the less significant difference in average efficiency levels between males and females from Asia and North America, there are greater discrepancies in average efficiency exhibited between males and females from Europe (0.25), followed by South America (0.16) and Africa (0.12), respectively (see Table 3). Nevertheless, both sexes from Asia exhibited the highest level (0.36 and 0.30, respectively) of overspending (lowest technical efficiency), followed by males from South America (0.40), males from Africa (0.51), females from Europe (0.51) and females from North and South America (0.55, respectively). Furthermore, the highest level of overspending is also evident for both sexes in accommodation (0.31 and 0.33, respectively), transport (0.39, respectively) and food and beverages costs (0.39 and 0.42, respectively). However, the greatest discrepancy is reported for sightseeing costs, where males (0.64) exhibited a higher efficiency score (less overspending) compared to females (0.49), which suggests that males experienced a greater value for money compared to females. The implication is that the different expenditure behaviours suggest different needs and signify the importance of tailor fitting tour packages not only based on socio-economic characteristics of visitors (for example, gender), but tourism councils will have to account for the nationality, destination attributes, visitors’ past experiences and the quality of visits, as these can serve as determinants for the duration of future visits (Barros and Machado, 2010).
However, the presence of poor price competitiveness (average efficiency of 0.51), as reported by Table 5, further accentuates the importance of identifying shortcomings in South African tourism, which can serve as guidelines to realise more desirable tour packages. From examining Table 5, it is evident that transportation (0.48 and 0.51, respectively) and accommodation (0.50) competitiveness exhibited the lowest average efficiency scores across all five continents. Additionally, visitors from South America (0.49) reported the lowest competiveness, followed by Africa (0.50), Asia (0.51), and Europe and North America (0.54), respectively. These results accentuate the need for tourism councils to approach guesthouses, backpackers, bed & breakfasts (B&Bs), the local municipality and airlines in negotiating their contribution in developing tour packages that can boost tourism. The same observation can be derived from both male and female visitors’ perspectives, as transport via airlines (0.46 and 0.51, respectively), other transport (0.50 and 0.51) and accommodation (0.50 and 0.51, respectively) exhibited the lowest price competitiveness. From Table 5, it is also interesting to note that it was males from Africa (0.48) and South America (0.48), and females from Asia (0.51) and South America (0.49) who exhibited the lowest average efficiency. The implication is that these visitors may generate the perception that South African attractions/facilities are overpriced compared to the rest of the world. The duration of visits can also have a contributing effect, as Table 6 reports that the maximum duration (more than 21 days) exhibited the lowest efficiency (0.44), followed the duration of 1 to 7 days (0.47) and the duration of 8 to 14 days (0.48). It was only the duration of 15 to 21 days that exhibited a higher level of price competiveness, where an efficiency of 0.65 was reported. It was especially transport via airlines that contributed to this low efficiency scores, as it exhibited the lowest price competiveness (average of 0.47 across all duration categories), followed by other transport (0.50), accommodation (0.52), food and beverages (0.53) and attractions (0.55), respectively.
The technical efficiency for competitiveness (per country).
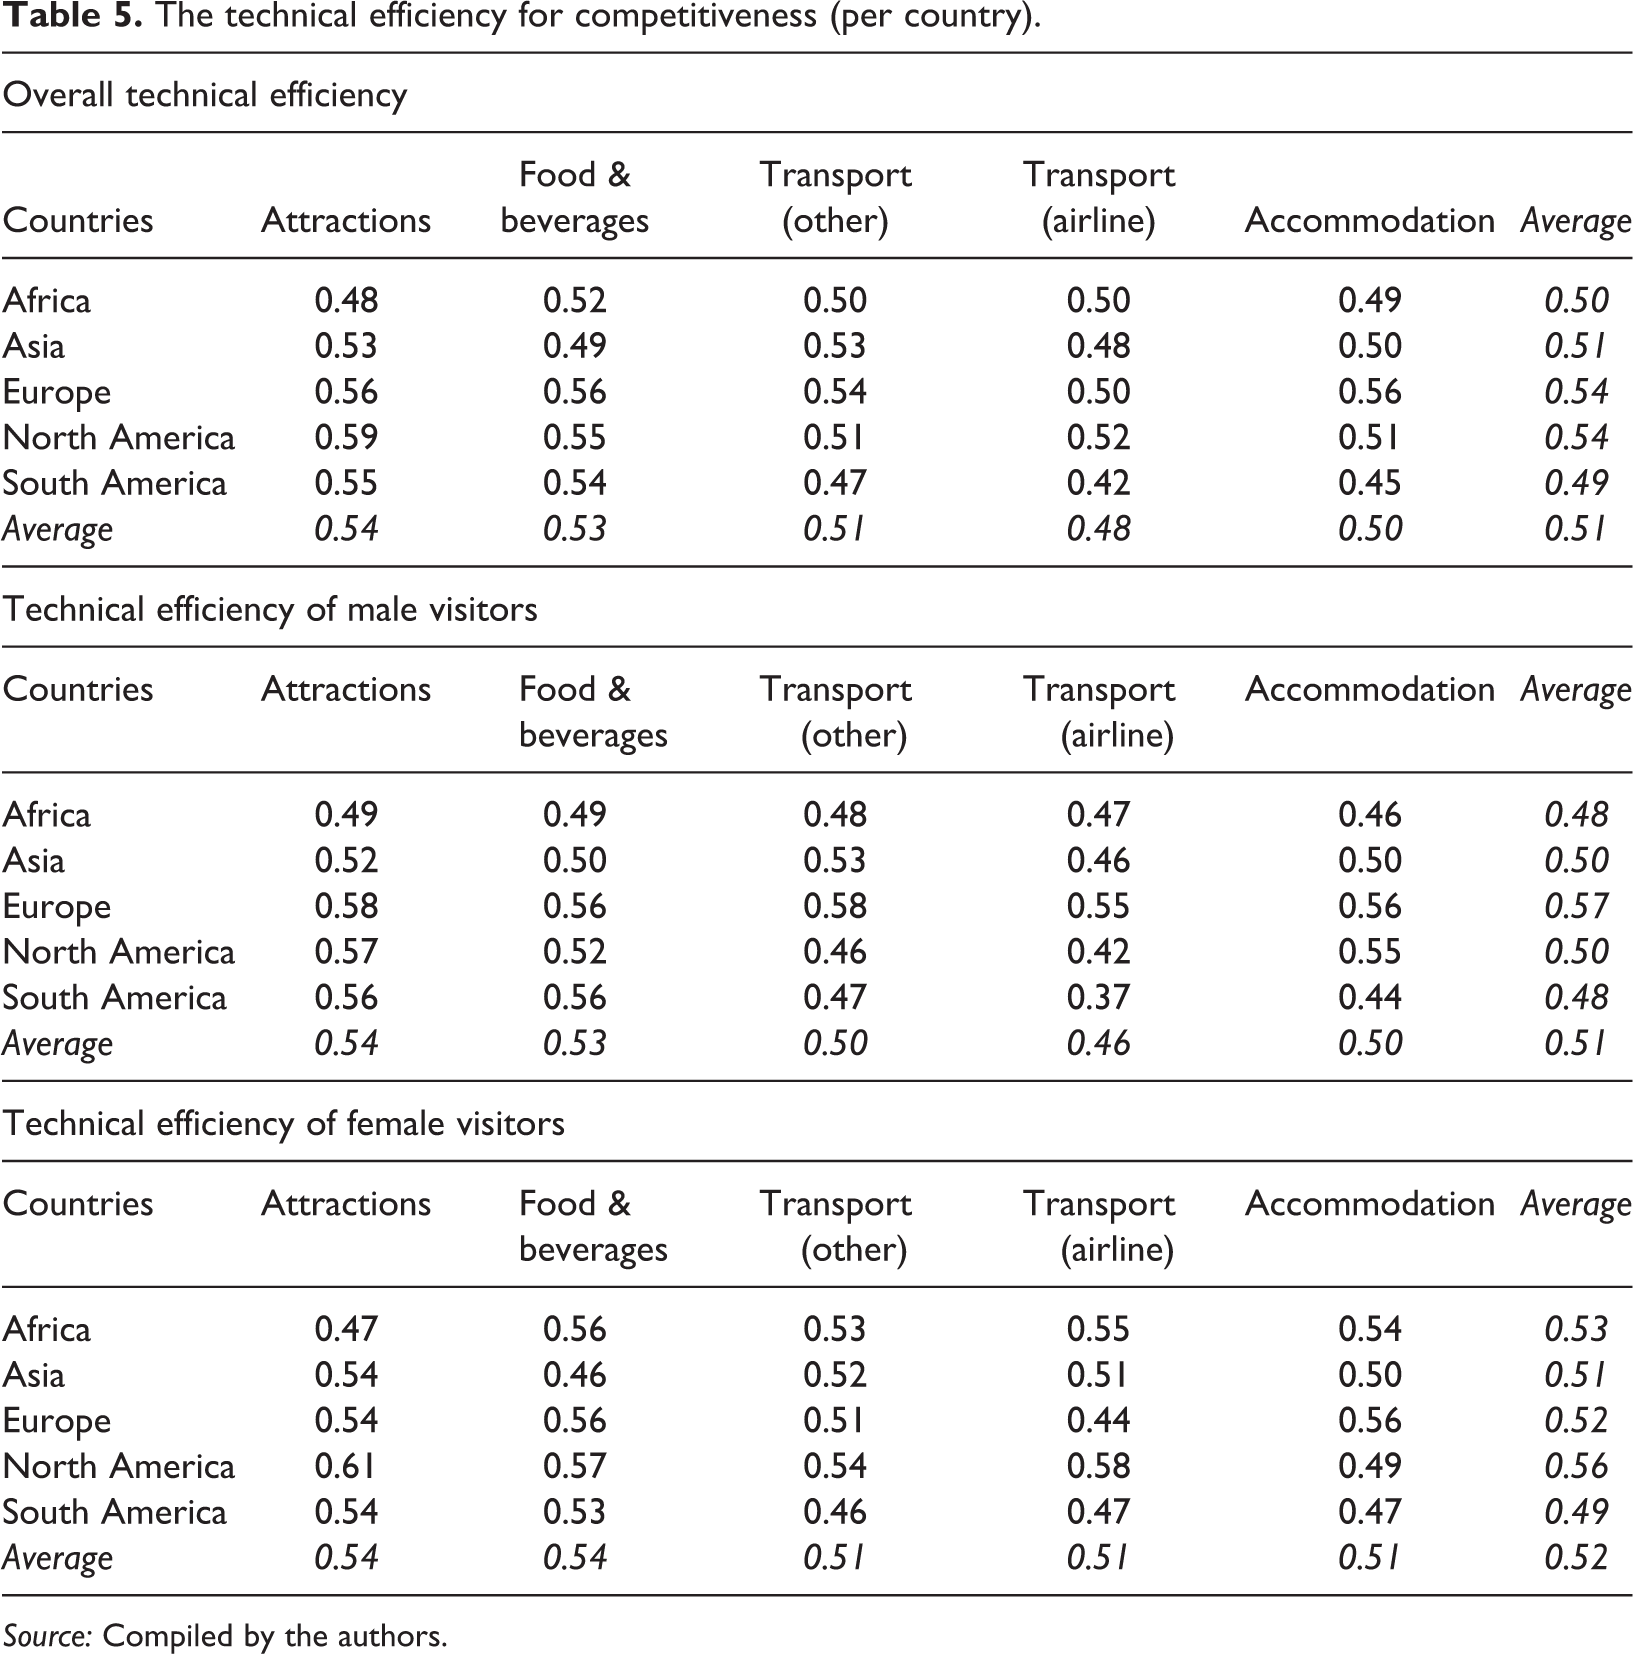
Source: Compiled by the authors.
The technical efficiency for competitiveness (per country over different visit durations).
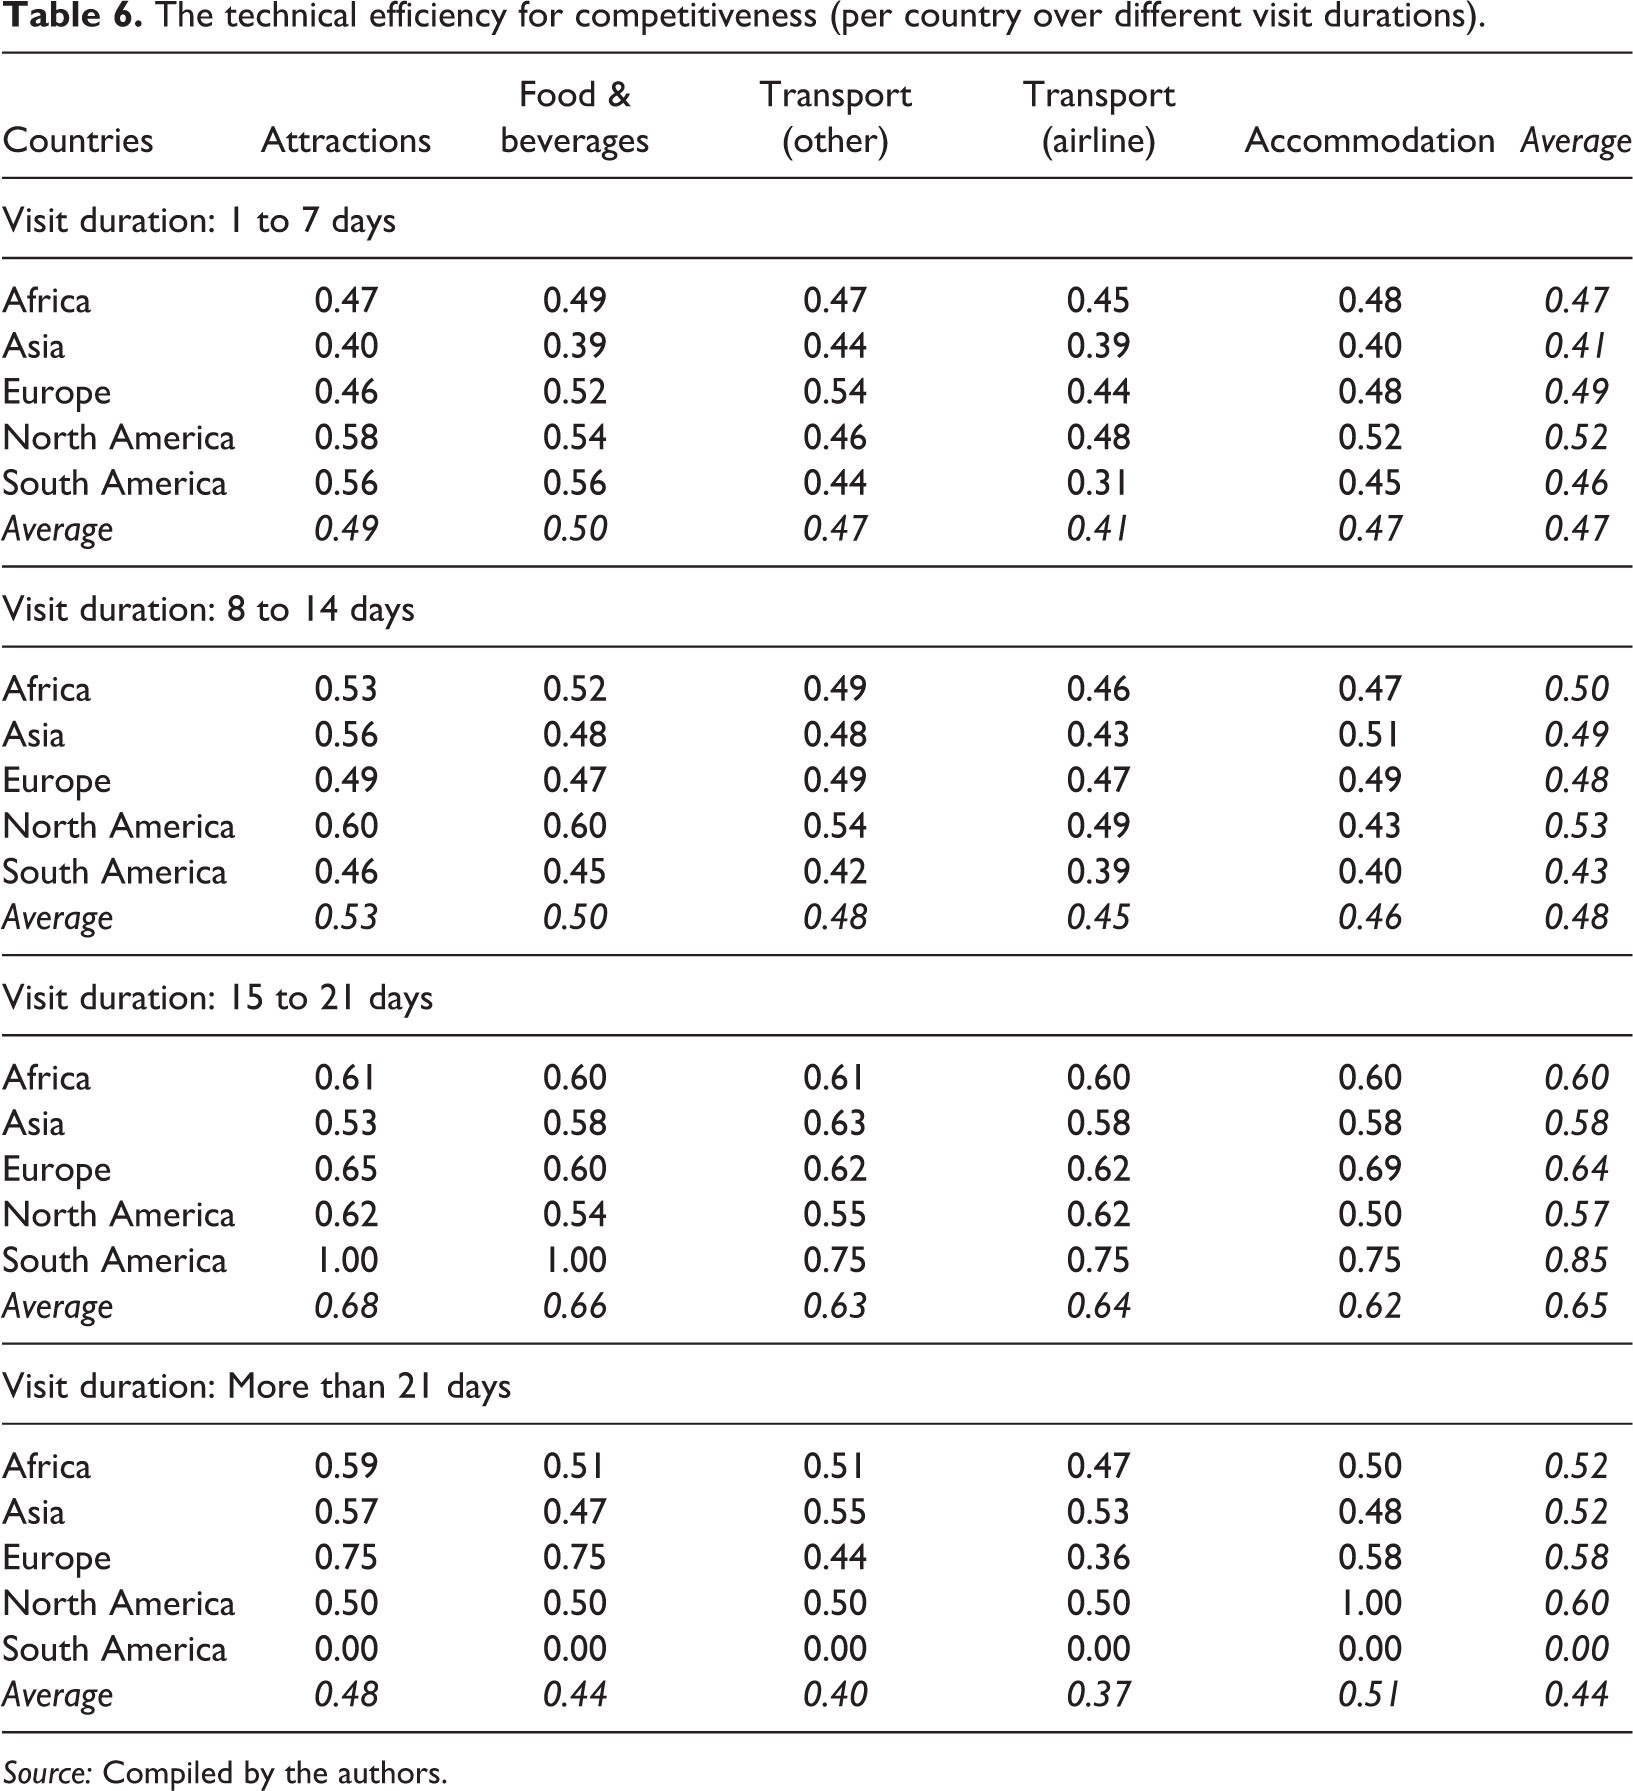
Source: Compiled by the authors.
These results substantiate the importance for the collaborations and networks between guesthouses, backpackers, B&Bs, the local municipality, owners of stalls and airlines to result in special prices or coupons that are suitable for a wider range of potential visitors, with the purpose of stimulating greater future attendance, but also with the objective to still realise profit with a sufficient number of visitors. However, from Table 6, it is evident that nationality can be considered as an influential factor in visitors’ experience and what they regard as being price competitive. For example, some evidence suggests that the formulation of tour packages should not only focus on visitors who prefer longer visits but must also consider which attributes are important for visitors who prefer to visit for a shorter duration to ensure greater future attendances. This argument can be accentuated by the low efficiency levels reported for Asians over the 1- to 7-day duration (0.41), for Europeans over the 8- to 14-day duration (0.48), and for South Americans over a period of more than 21 days (0.00). Additionally, South and North Americans did, however, exhibit high efficiency scores over the 15- to 21-day (0.85) and maximum duration period (0.60), respectively, which suggests that their general experience supported the notion that they received greater value for their money compared to others visitors under evaluation.
Conclusion and recommendations
The goal of the study was to investigate the relevance of South Africa’s cost and competitiveness aspects in relation to the factors that contribute to competitiveness, especially looking at how a country can relieve costs by looking at the time spent, gender and continent of origin of tourist to South Africa.
Results confirmed the presence of very poor price competitiveness in the South African tourism sector, which should be addressed urgently. South African attractions/facilities are considered to be overpriced compared to the rest of the world and it is recommended that strategically tailored tour packages can serve as a tool to improve the number of future attendances, which can promote competitiveness, but it is advised that tourism stakeholders consider not only demographic characteristics and nationality of visitors to compile these tour packages but that these factors can also influence the duration of visits. The results indicated that overspending by tourist is in some cases evident and that a ‘give and take’ scenario should be established in South Africa under the tourism stakeholders. Stakeholders can provide cost-effective custom made packages to curb overspending and still remain competitive in the market. A study by Du Plessis and Saayman (2017) confirm this finding, stating that tour operators to South Africa will continue to choose packages that will provide value for money to tourist. It was clear that tour operators who chose to promote South Africa as a tourism destination will continue doing business in the country and because of the importance of price competitiveness will further explore new packages (Du Plessis and Saayman, 2017: 9).
It is clear that with information gained that DMOs could strive to enhance the revenue generated from tourism through strategic marketing campaigns, target marketing and coordinated tourism development. These efforts will result in more tourism spending, longer lengths of stay and satisfied returning visitors. To stay true to the competitiveness definition that implies sustainability (Ritchie and Crouch, 2003), results from this study can guide DMOs with careful planning and management based on demographics, to implement ways to ensure that the destination environment suffers minimum damage while also offering sufficient economic benefits.
Future research
To further elaborate on price competitiveness in South Africa and to present a clearer framework for tourism stakeholders regarding tour packages, more light should be shed on the type of tourist that is visiting South Africa. From the questionnaire utilised in this study, 30% of the visitors were from Africa, 26% from Asia, 16% from Europe, 17% from North America and 11% from South America. When establishing what type of tourist visit South Africa and what their motivations are behind travelling will provide valuable insight in how one can tailor packages for tourists. For example, by establishing if the tourist is adventure, leisure, eco- or business tourist will help to establish their needs and expectations.
Footnotes
Declaration of conflicting interests
The author(s) declared no potential conflicts of interest with respect to the research, authorship, and/or publication of this article.
Funding
The author(s) received no financial support for the research, authorship, and/or publication of this article.