
Abstract
The main objective of this article is to shed light on the determinants of international tourism demand expansion in Cape Verde. The research involves cointegration analysis to test the existence of a long-term equilibrium relationship between the variables included in tourism demand using the autoregressive distributed lag bounds testing approach. The results showed high income elasticity and price inelastic demand. Moreover, turmoil in traditional tourist destinations in non-European Mediterranean basin countries, coupled with the investments of tour operators and hotel groups who are key players in the European source markets, significantly and positively affected international tourism demand. Supply side changes associated with foreign investment were necessary to increase the number of tourists. Finally, lower level of income in European countries following the financial crisis of 2008 might have favored the shift of European tourists from more expensive destinations to Cape Verde. The concentration of tourism, economic growth, jobs creation, and population growth on two islands may have affected island communities, resources, and other aspects of inter- and intraisland relationships.
Keywords
Introduction
Many scholars have argued that the high growth of international tourism demand (Cobbinah et al., 2013; Gauci et al., 2002; Holden et al., 2011; WEF, 2017) could be a pillar to stimulate economic growth (Bouzahzah and El Menyari, 2013; Nunko et al., 2019), particularly in some island territories endowed with key characteristics for the development of the tourism sector (Seetanah, 2011). These benefits of tourism (Moreno et al., 2020) have led governments and international organizations to implement programs and policies with the objective of increasing economic growth and employment. However, obstacles such as insufficient investment in the tourism sector (El Menyari, 2021; Fauzel et al., 2017) or uncertainty dissuading people from visiting risky destinations (among others, Buigut and Amendah, 2016; Naudé and Saayman, 2005; Pizam and Fleischer, 2002) explain how low- or medium-income countries, particularly island territories endowed with natural, historical, and cultural resources, stay in a “vicious circle” and “low level of economic development” (Naftziger, 2006; Soubbotina, 2004).
The case of the Small Island Developing State (SIDS) of Cape Verde shows that foreign investment overcomes shortages of domestic capital and, coupled with other factors, raises the level of competitiveness in the international tourism market (UNCTAD, 2018). As a consequence, the number of tourists in hotels and similar establishments has more than quintupled over the last 20 years. Cape Verde has increased its market share in the international tourism market, and the archipelago is among the countries with the highest share of tourism in terms of value added, employment, and exports (WTTC, 2017). The WEF (2017) ranks Cape Verde 83rd out of the 136 countries included in the travel and tourism competitiveness index. It is ranked as the seventh African country with the highest level of competitiveness, behind South Africa (53rd), Mauritius (55th), Morocco (65th), Egypt (74th), Kenya (80th), and Namibia (82nd). Cape Verde improved considerably and rose six places in the ranking since 2011, the year when the country was included in the analysis for the first time (WEF, 2011). However, the fact that the archipelago is ranked behind other small island territories included in the index—Malta (32nd), Cyprus (52nd), Mauritius (55th), Barbados (58th), Jamaica (69th), and the Dominican Republic (76th)—shows space for further improvement.
Previous literature on the tourism–economic growth interaction has considered different factors to explain the evolution of tourism and their net economic benefits (Bouzahzah and El Manyari, 2013; Nunko et al., 2019). Among these factors, the replacement of a centralized model with a more open and marked based economy, inflows of foreign direct investment (FDI), and the sun, sand, and sea resources of the islands have played an important role in Cape Verde (UNCTAD, 2018). Although those supply side changes associated with FDI are necessary, the ultimate determinant of tourism arrivals is demand in the source markets, that is, tourists’ destination choices.
Several published studies on tourism demand have focused on destinations in Africa, among them Ibrahim (2013), Wahba and Elanani (2017), and Faragalla (2018) in Egypt; Holden et al. (2011) in Ghana; Buigut and Amendah (2016) in Kenya; Gooroochurn and Sinclair (2005) and Seetanah et al. (2015) in Mauritius; Awaritefe (2007), Bankole and Babatunde (2010), and Eja et al. (2012) in Nigeria; Burger et al. (2001); Saayman and Saayman (2015), Durbarry et al. (2009), Seetanah et al. (2010), Gil Alana (2011), and Moyo and Ziramba (2013) in South Africa; Ouerfelli (2008), Choyakh (2008), Ouerfelli (2010), Gasmi and Sassi (2015), Hathroubi (2011), and Sassi (2014) in Tunisia; Muchapondwa and Pimhidzai (2011), Chigora and Vutete (2015), and Mpofu (2009) in Zimbabwe; and Gauci et al. (2002), Naudé and Saayman (2005), Adeola et al. (2018), and Viljoen et al. (2019) included groups of countries. Despite the remarkable role that tourism has played in the economic performance of the SIDS of Cape Verde over the last few decades, to the best of our knowledge, no empirical study has been carried out. Thus, it would be convenient to examine the drivers behind the demand dynamics of visitors to Cape Verde. According to previous research on modeling international tourism demand, 1 the most salient determinants of the number of foreign visitors are consumers’ income in the source market and the relative prices of goods and services in destinations compared with prices in tourists’ countries of origin (Adeola et al., 2018; Saayman and Saayman, 2015; Saayman and De Klerk, 2019; Song and Witt, 2000; Viljoen et al., 2019, and more particularly Seetanah et al., 2015 for the case of islands’ tourism demand).
Apart from economic explanatory factors, other favorable or unfavorable circumstances might affect the evolution of tourism demand. Given that tourists are highly mobile, if they perceive a destination to be risky, they can omit it from their destination choices or change decisions they have already made (Buigut and Amendah, 2016; Hall and O’Sullivan, 1996; Naudé and Saayman, 2005; Pizam and Fleischer, 2002). The impact on tourism demand depends on tourists’ risk aversion (Lepp and Gibson, 2003) and the visiting country’s stage of development (Thompson, 2011). Following the Arab Spring (AS) in North African and Persian Gulf countries, riots and revolutionary movements have generated negative publicity since the beginning of 2010 and diverted tourism from these destinations. Two circumstances might have contributed to the diversion of international tourists from nations affected by the AS to Cape Verde. First, tour operators and hotel companies that are the main investors in the tourism industry in Cape Verde are also main players 2 in the European outbound tourism market. Second, European countries have been the main source markets of international tourism to countries affected by the AS. Most studies have focused on the loss of tourism receipts in different destinations where attacks were committed. However, less attention has been paid to gains in the number of international travelers to substitute destinations that have remained safe and peaceful in contrast to European outbound tourism destinations that have suffered from social and political instability, such as countries affected by the AS.
The main contribution of the present study is to shed light on international tourism expansion in Cape Verde. First, we define and estimate explanatory factors of tourism demand as fundamental conditions for tourism expansion within a tourism demand model and using cointegration analysis. Second, we specifically take into account the gains in international tourism in Cape Verde, a destination that remained safe and peaceful in contrast to European outbound tourism destinations in the Mediterranean that suffered impacts of social unrest and terrorism. Better knowledge of the effects of determinants can help policy makers and managers in their decision-making processes not only in Cape Verde but also in other SIDSs medium-haul destinations endowed with attractive natural resources (e.g. sun, sea, and sand) for improving tourism competitiveness.
The structure of the article will be as follows. First, the article will describe the evolution of tourism on the Islands of Cape Verde and their source markets in the second section. Second, the third section will present estimates of the explanatory factors of international mass tourism within a tourism-demand framework. Finally, the fourth section will conclude.
Overview of the evolution of tourism in the islands of Cape Verde
Cape Verde (Fernandes, 2005) is one of the archipelagos that are part of Macaronesia, which also includes Azores in the southwest of Europe and the archipelagos of Madeira and the Canary Islands in the northwest of Africa (Figure 1). Population on the nine islands increased from about 200 thousand people in 1960 to over half a million in 2016 (INE, 2016, 2017). There are international airports on the two most populated islands, Santiago (where the country’s capital Praia is located) and São Vicente, and on the two main touristic islands, Sal and Boa Vista. There are also airports with domestic flight connections on the islands of Fogo, São Nicolau, and Maio.
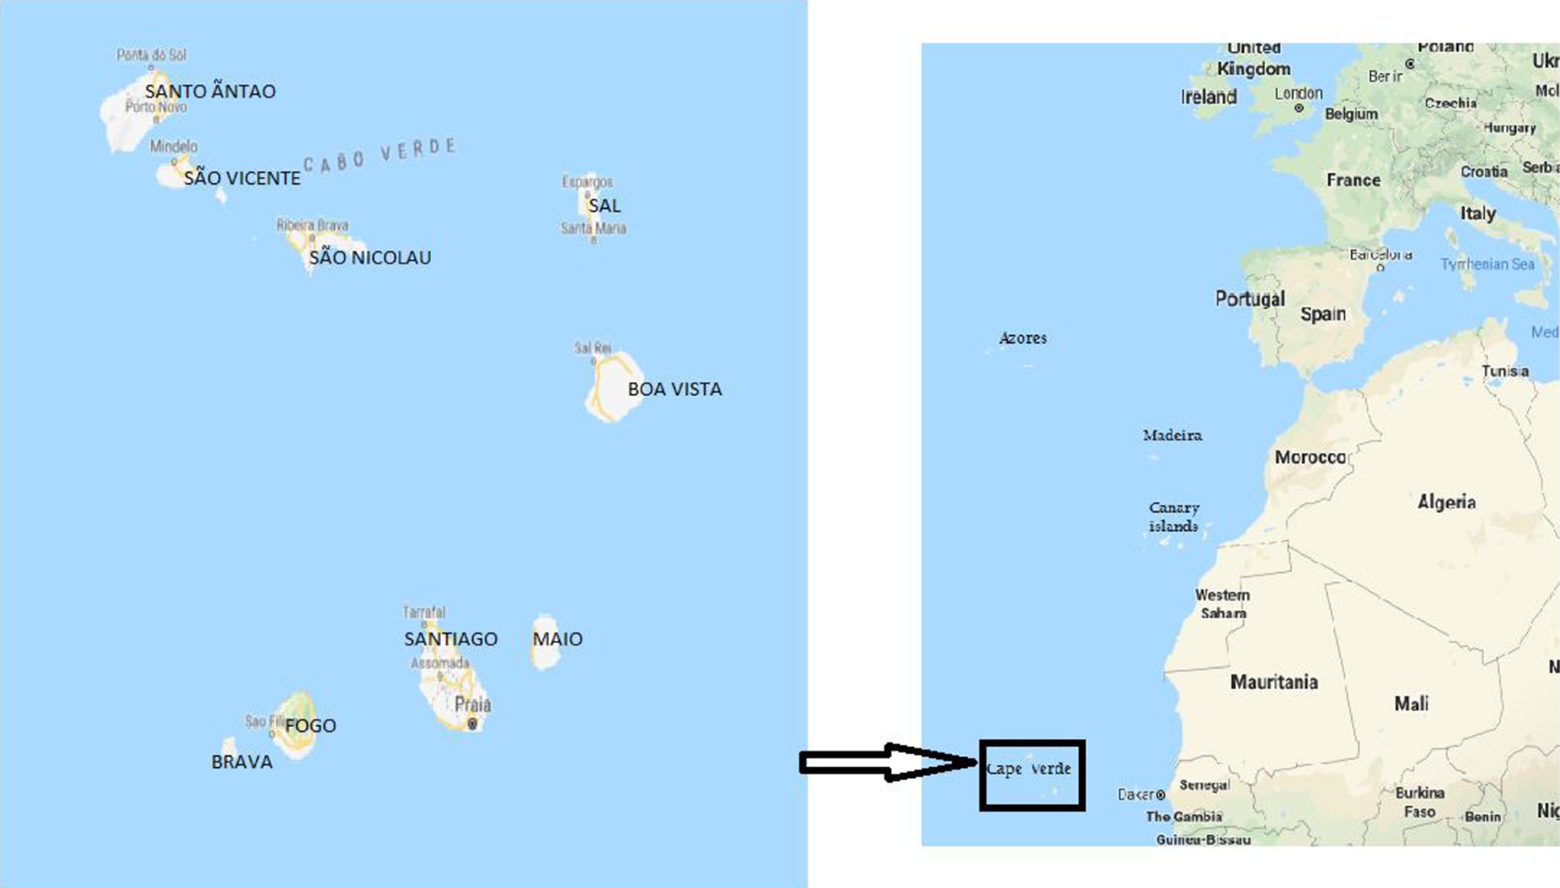
The Cape Verde archipelago.
Given the absence of sufficient domestic funds for investment, the development of tourism in Cape Verde has relied on foreign investment (UNCTAD, 2018). Figure 2 displays both the evolution of total FDI in the tourism sector and the number of tourist arrivals. FDI inflows to Cape Verde underwent a great increase from around a yearly average of 10 million euro in the 2001–2005 period to nearly 80 million in 2006–2010 and over 50 million in 2011–2019. The number of international tourists grew from approximately 152 thousand per annum in 2001 to 280 thousand in 2006, 475 thousand in 2011 and over 800 thousand in 2019. The country received these inflows after transformation from a centralized planned economy into a more open and liberalized market economy (UNCTAD, 2018). The archipelagic state was able to provide foreign investors, mainly from Europe, with sound economic policies and specific island resources to develop “all-inclusive” tourism projects. The main investors have been well-known tourism operators and hotel groups (different companies of the TUI group: TUI, Thomson, RIU; the disappeared Thomas Cook group, DER touristic group, Resort Group; Iberostar, Meliá; Barceló). Thus, a key supply side expansion of the tourism industry in Cape Verde, driven by tour operators and characterized by low priced packages and charter flights, took place.
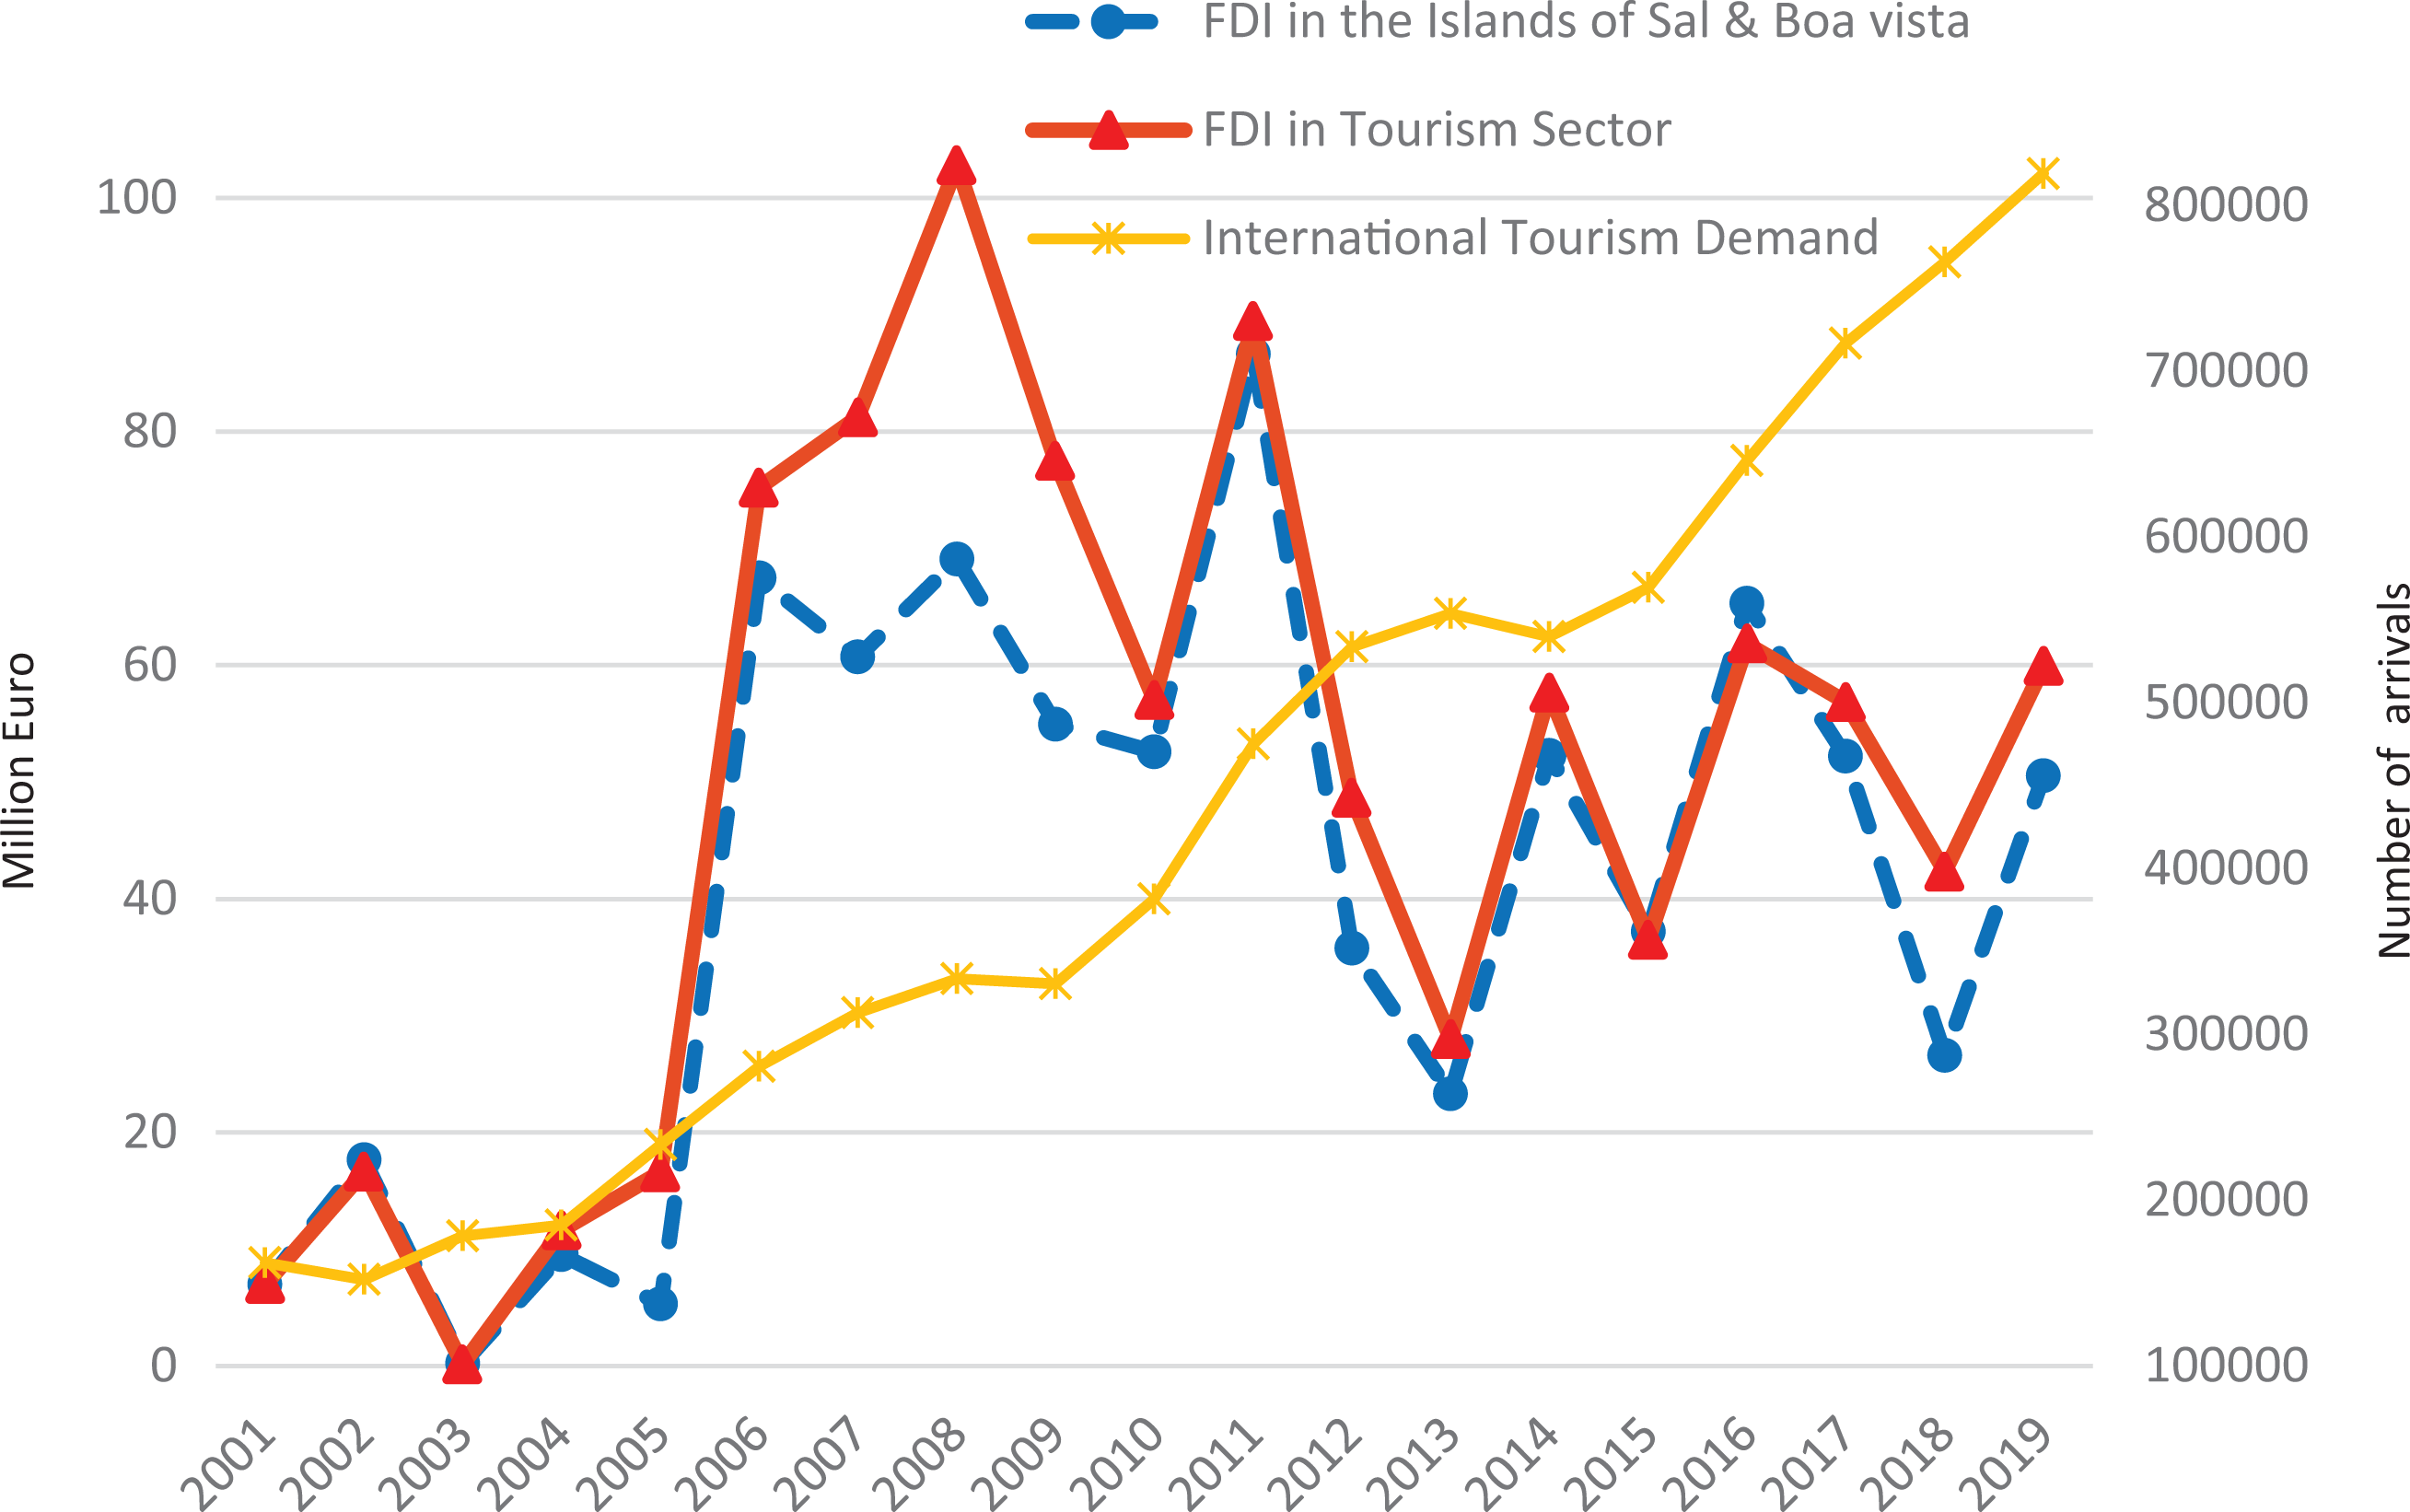
Evolution of FDI and international tourism demand in Cape Verde (2000–2019).
Source markets development
Figure 3 displays the development of international tourism demand, measured in number of nights stayed in hotels or similar accommodations in Cape Verde and separately the two main destination islands of the archipelago. From 2000 to 2019, the number of nights spent by international tourists in Cape Verde increased by around 4.4 million—more than 3.6 million of them on the islands of Sal and Boa Vista and only 0.8 million on the rest of the islands, including the more populated Santiago, São Vicente, and Santo Ãntao (see Figure 1). The islands of Sal and Boa Vista increased their share in number of nights spent by international tourists from nearly 70% in 2000 to 90% in 2019.
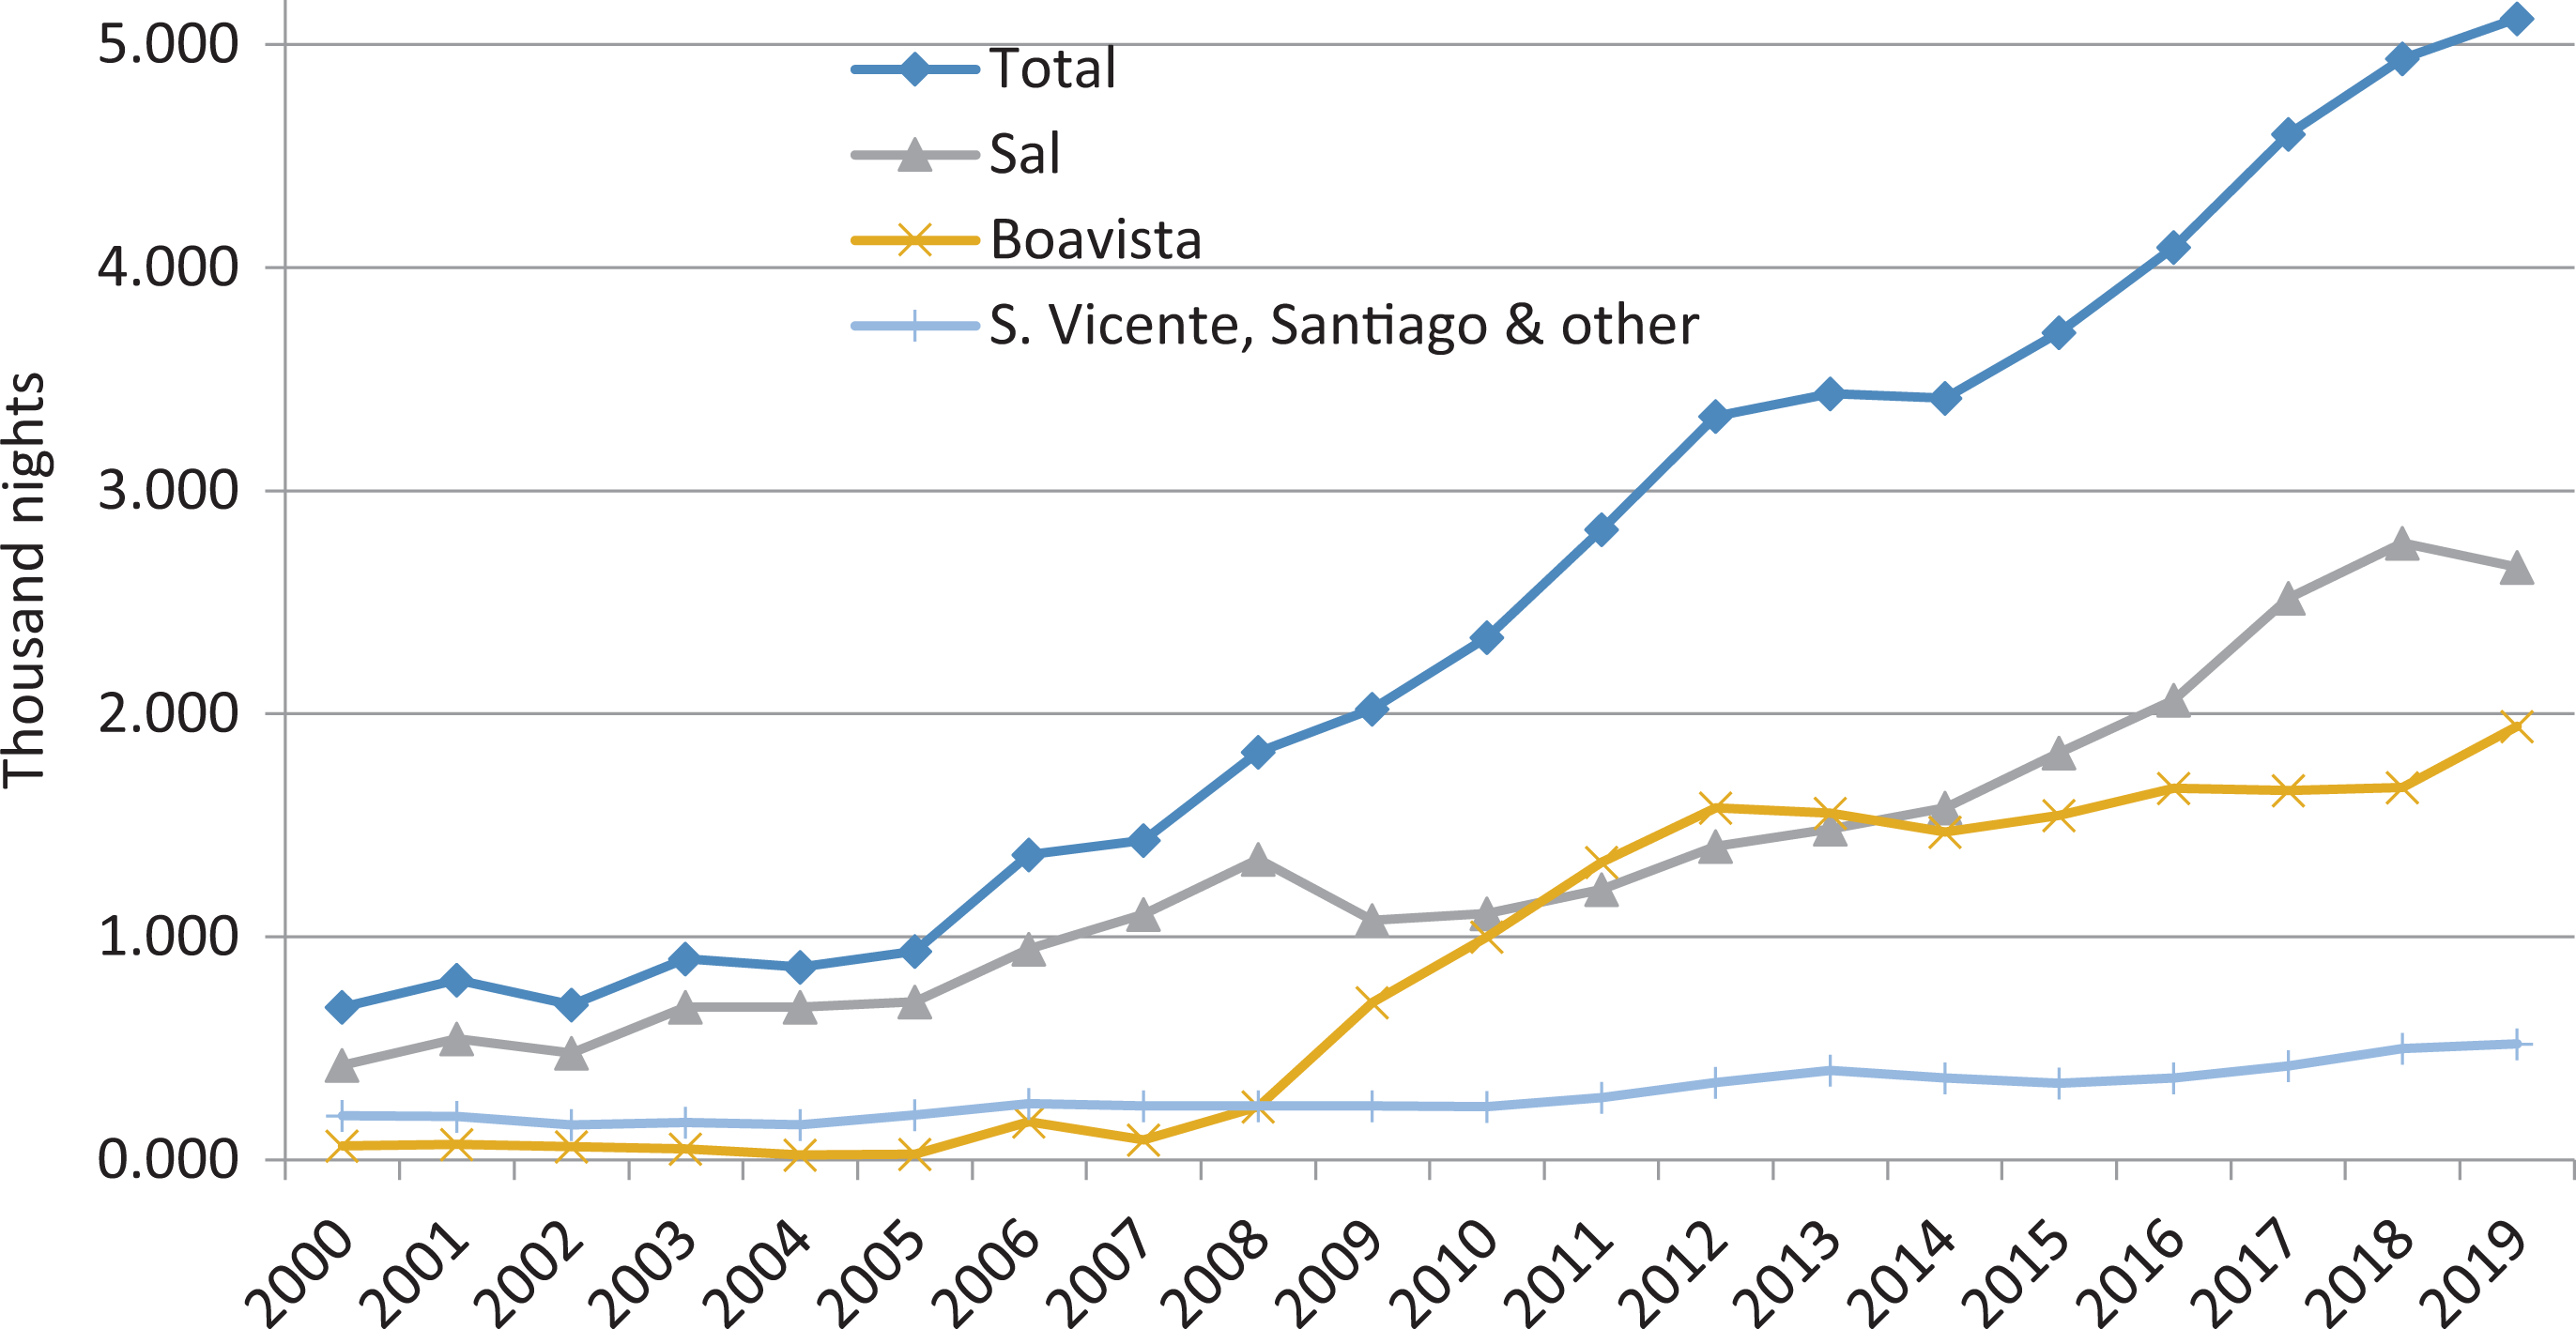
Evolution of number of nights spent by international tourists on main tourist islands (2000–2019).
Figure 3 shows the development of nights spent by international tourists from the 12 major countries of origin included separately in the tourism statistics of Cape Verde. The 10 largest European 3 source markets for tourists (Austria, Belgium, France, Germany, Italy, the Netherlands, Portugal, Spain, Switzerland, and the United Kingdom) account for over 80% of international tourism to Cape Verde. 4 The share of source markets has changed over the period of study. Italy and Portugal were the main source markets in 2000, with 20% of international tourists each (Figure 4). Although all the main source markets increased in absolute terms, the United Kingdom showed the highest growth and became the main country of origin. The share of UK residents increased 5 from fewer than 1% of the visitors arriving in Cape Verde in 2000 to over 25% in 2019. Belgium and the Netherlands showed the second-highest growth, increasing their participation from 2% to nearly 10%. Germany maintained its relative value (12%) but quadrupled its number of visitors. Finally, Portugal and Italy reduced their participation in relative terms to less than half of their values in 2000 but Portugal tripled the numbers of visitors in the same period.
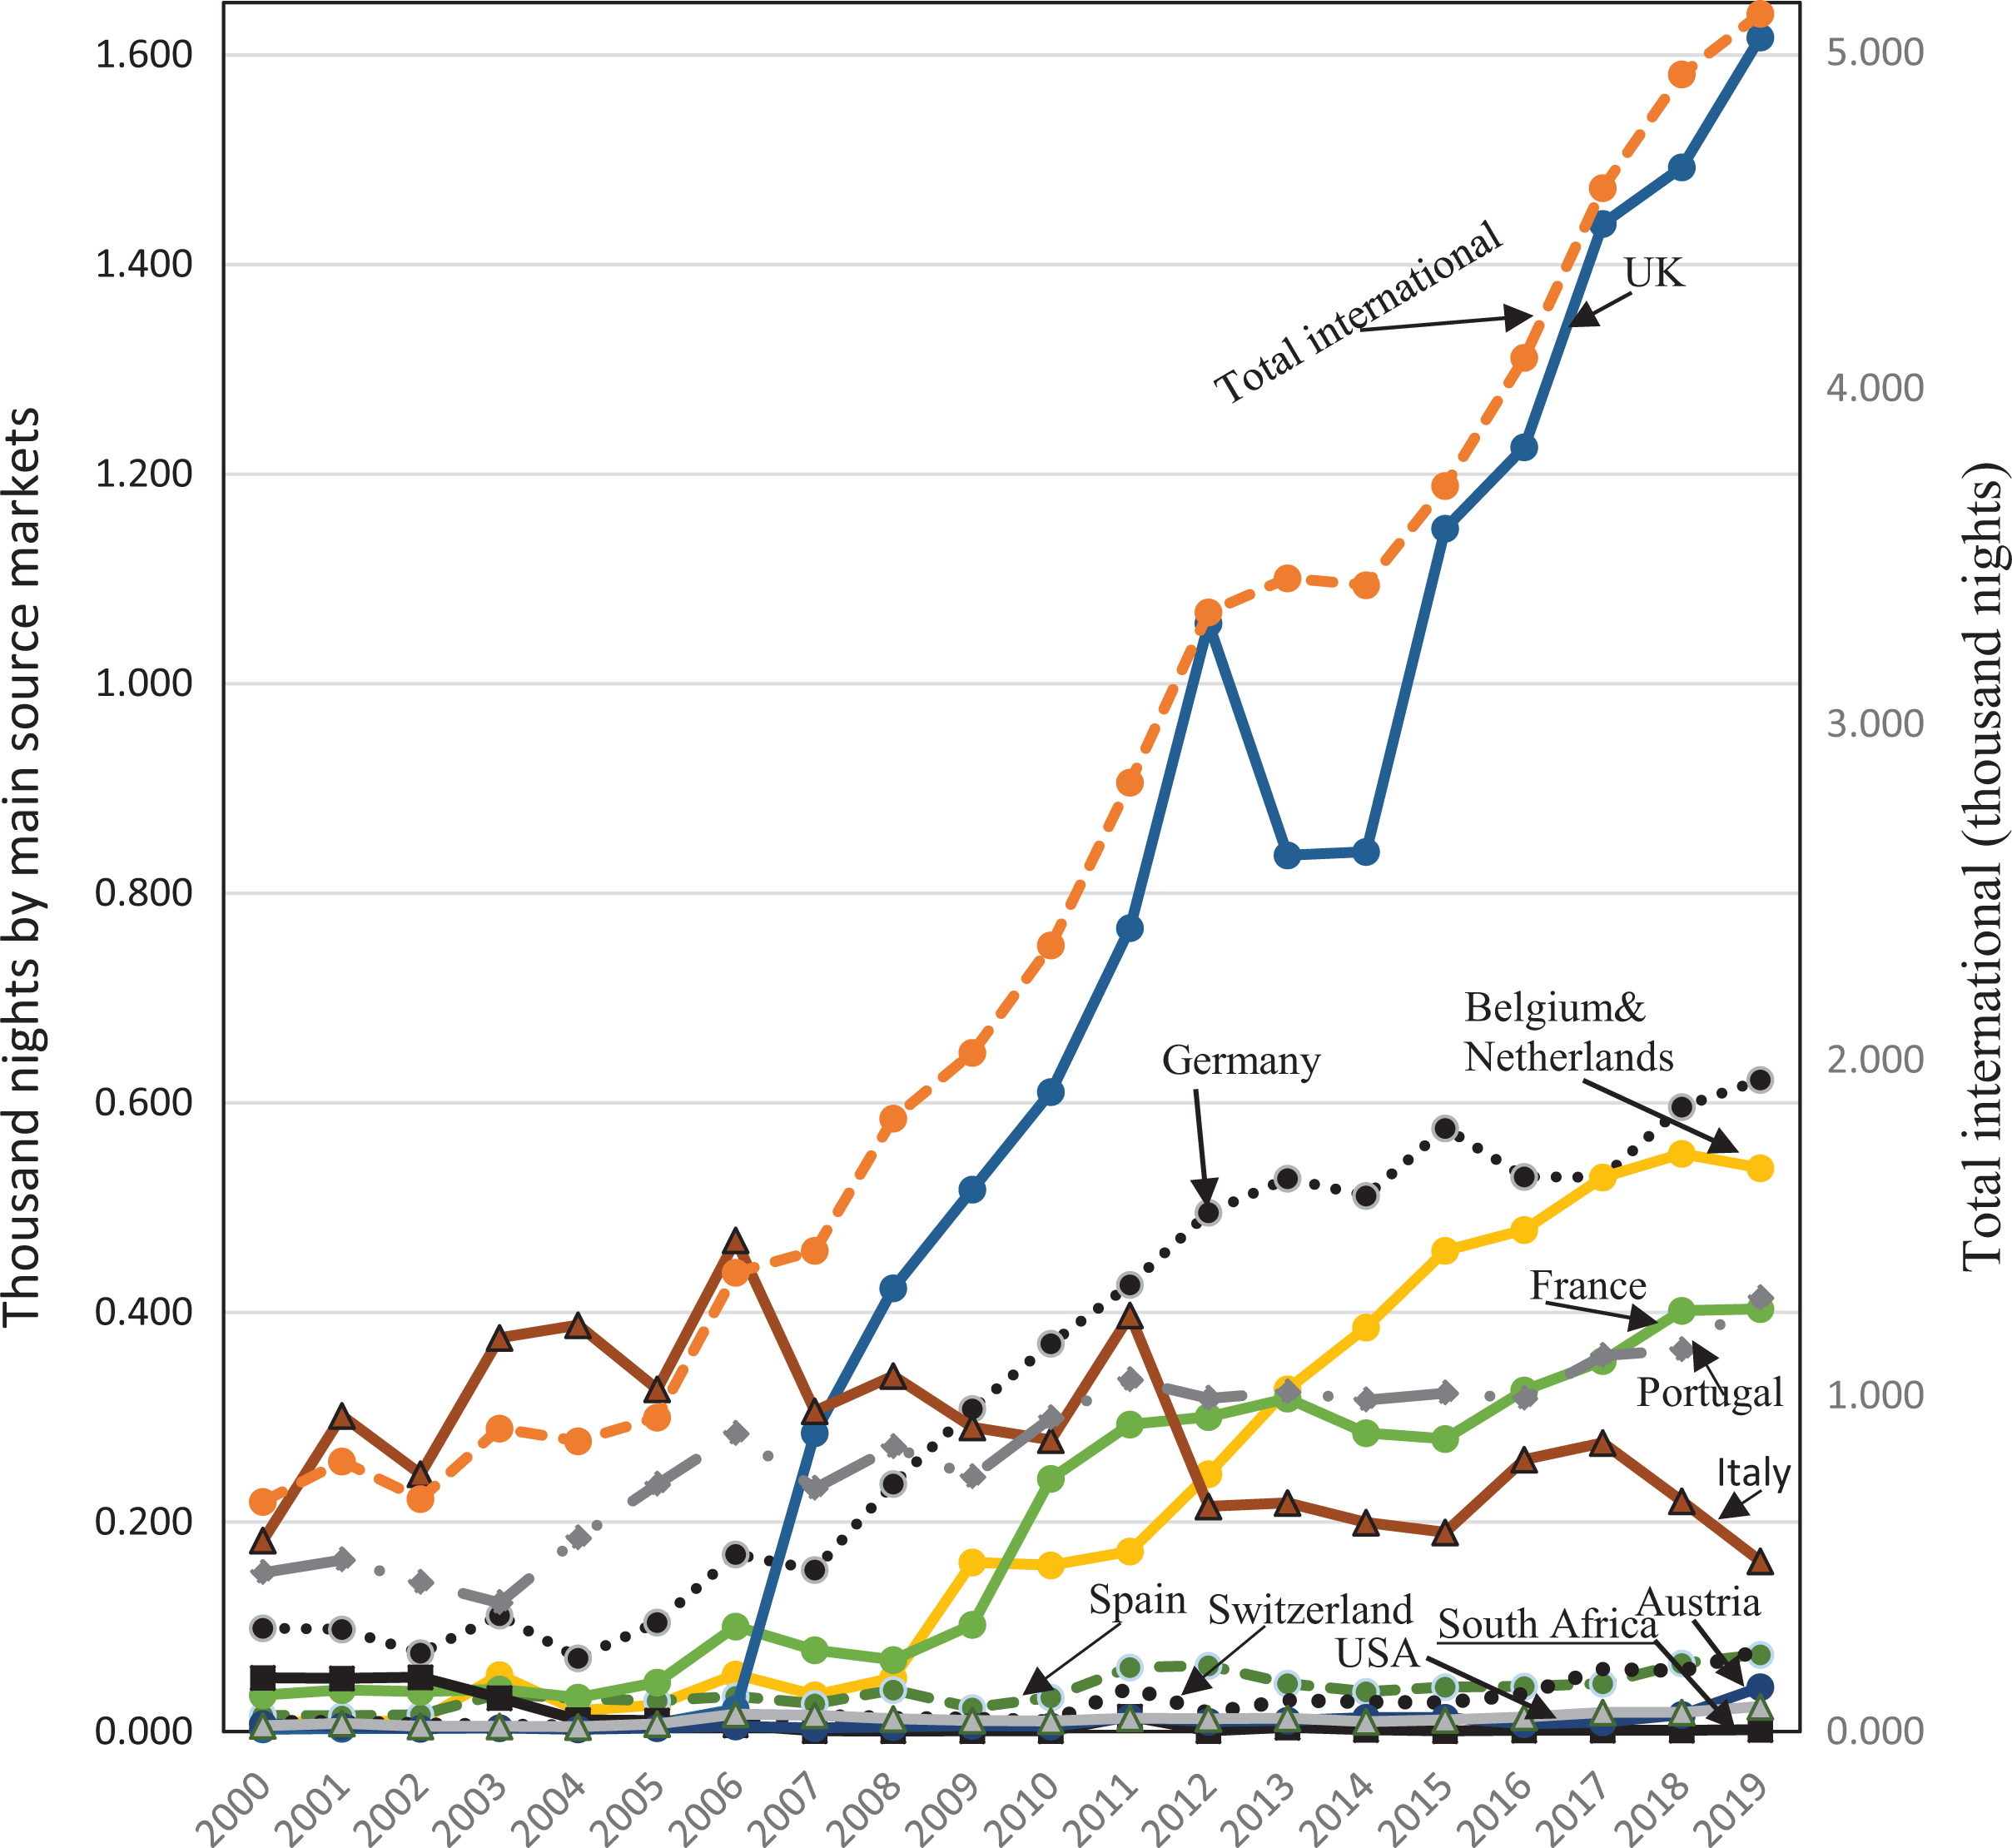
International tourists by main source markets (2000–2019).
Figure 5 shows that the average length of stay increased from 4.2 nights in 2000 to 6 in 2019. Visitors from France and Portugal showed the lowest length of stay, while the United Kingdom was the highest, followed by Belgium, the Netherlands, and Germany.

Development of average stay by country from main source markets. Source: Author’s own calculations based on data obtained from the Statistical Office of Cape Verde.
Population and gross domestic product in main tourist spots
The concentration of foreign investment and tourism on the islands of Sal and Boa Vista has affected the distribution of populations, employment, and income. First, Figure 6 shows the annual average growth rate (AAGR) of the population for the islands. Whereas Sal and Boa Vista achieved growth rates close to 9% and 17%, respectively, the archipelago of Cape Verde had an AAGR close to 1%. Some islands, such as São Nicolau, Brava, Santo Antão, and Fogo, even showed negative population growth rates. As can be seen in Figure 6, the period between 1970 and 1990, prior to the development of tourism, showed low differences in population growth among the islands. Regarding employment, Figure 7 displays the differences in employment across the islands in terms of AAGR. The islands of Sal and Boa Vista show an AAGR that is three and five times higher than Cape Verde’s average, reflecting the employment created from coastal tourism. This concentration of tourism activities, population, and employment may have caused overdevelopment migration as well as changes in transportation and mobility, environmental quality, heritage, and community values (UNCTAD, 2018).
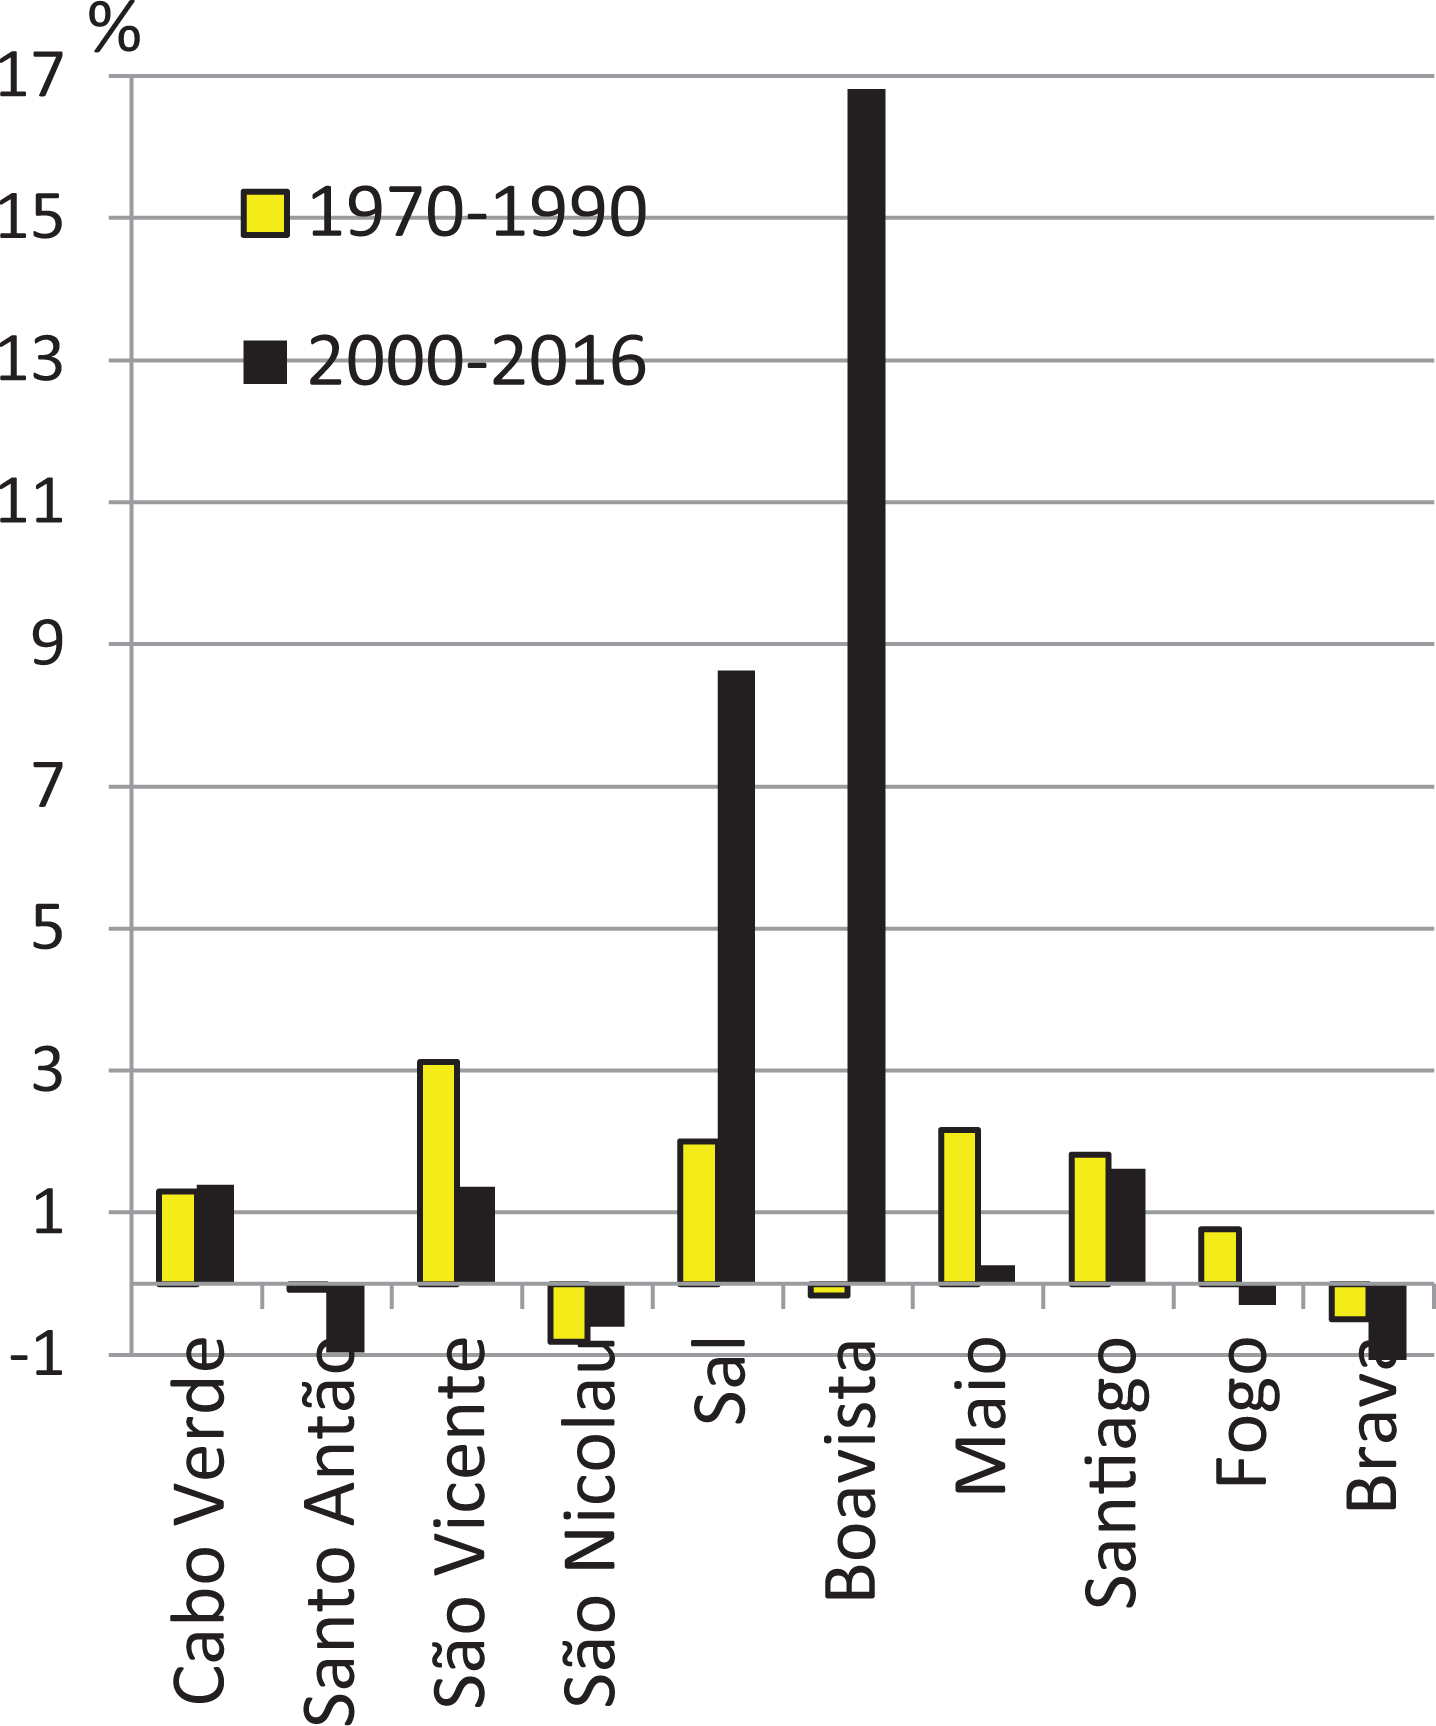
Population AAGR on the island before (1970–1990) and during tourism boom (2000–2016). Source: Author’s own calculations based on data obtained from the Statistical Office of Cape Verde. AAGR: annual average growth rate.
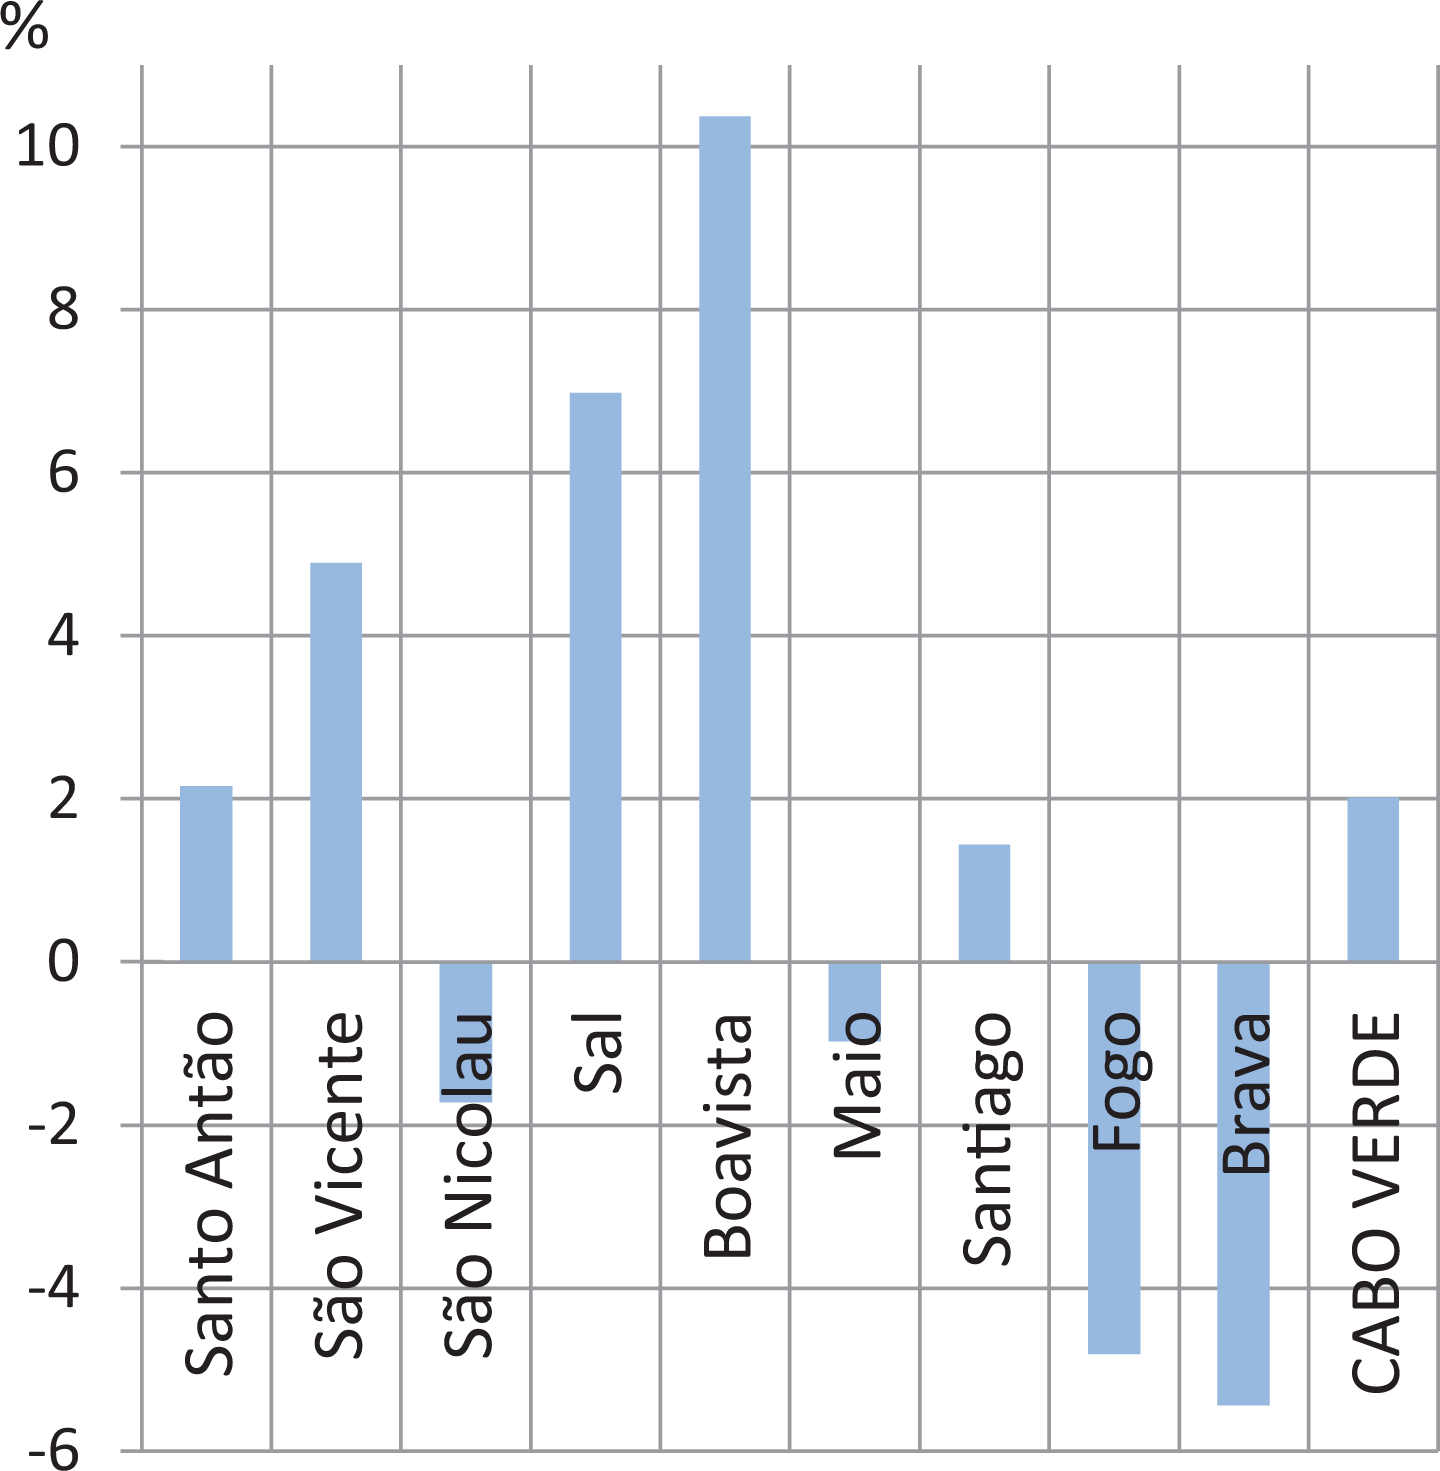
Employment AAGR for population over the age of 15 (2011–2016). Source: Author’s own calculations based on data obtained from the Statistical Office of Cape Verde. AAGR: annual average growth rate.
Finally, tourism has also effected changes in gross domestic product (GDP). The two main destination islands showed an AAGR for the period between 2007 and 2016 of up to four times the Cape Verde average (Figure 8). Moreover, people living on the tourism islands have a higher income on average—approximately US$7000 in Sal and US$5000 in Boa Vista, compared to US$3000 in Cape Verde as a whole (Figure 9). Those differences in levels of income imply that Boa Vista and Sal are in a higher income group than the rest of the Cape Verde islands, according to the World Bank’s (2018) country income classifications. Sal and Boa Vista share the income group of island states such as Grenada, Jamaica, the Maldives, the Marshall Islands, Mauritius, Saint Lucia, and Saint Vincent and the Grenadines, whereas the rest of the Cape Verde islands belong to the same income group as Sao Tome and Principe, Sri Lanka, and the Philippines.
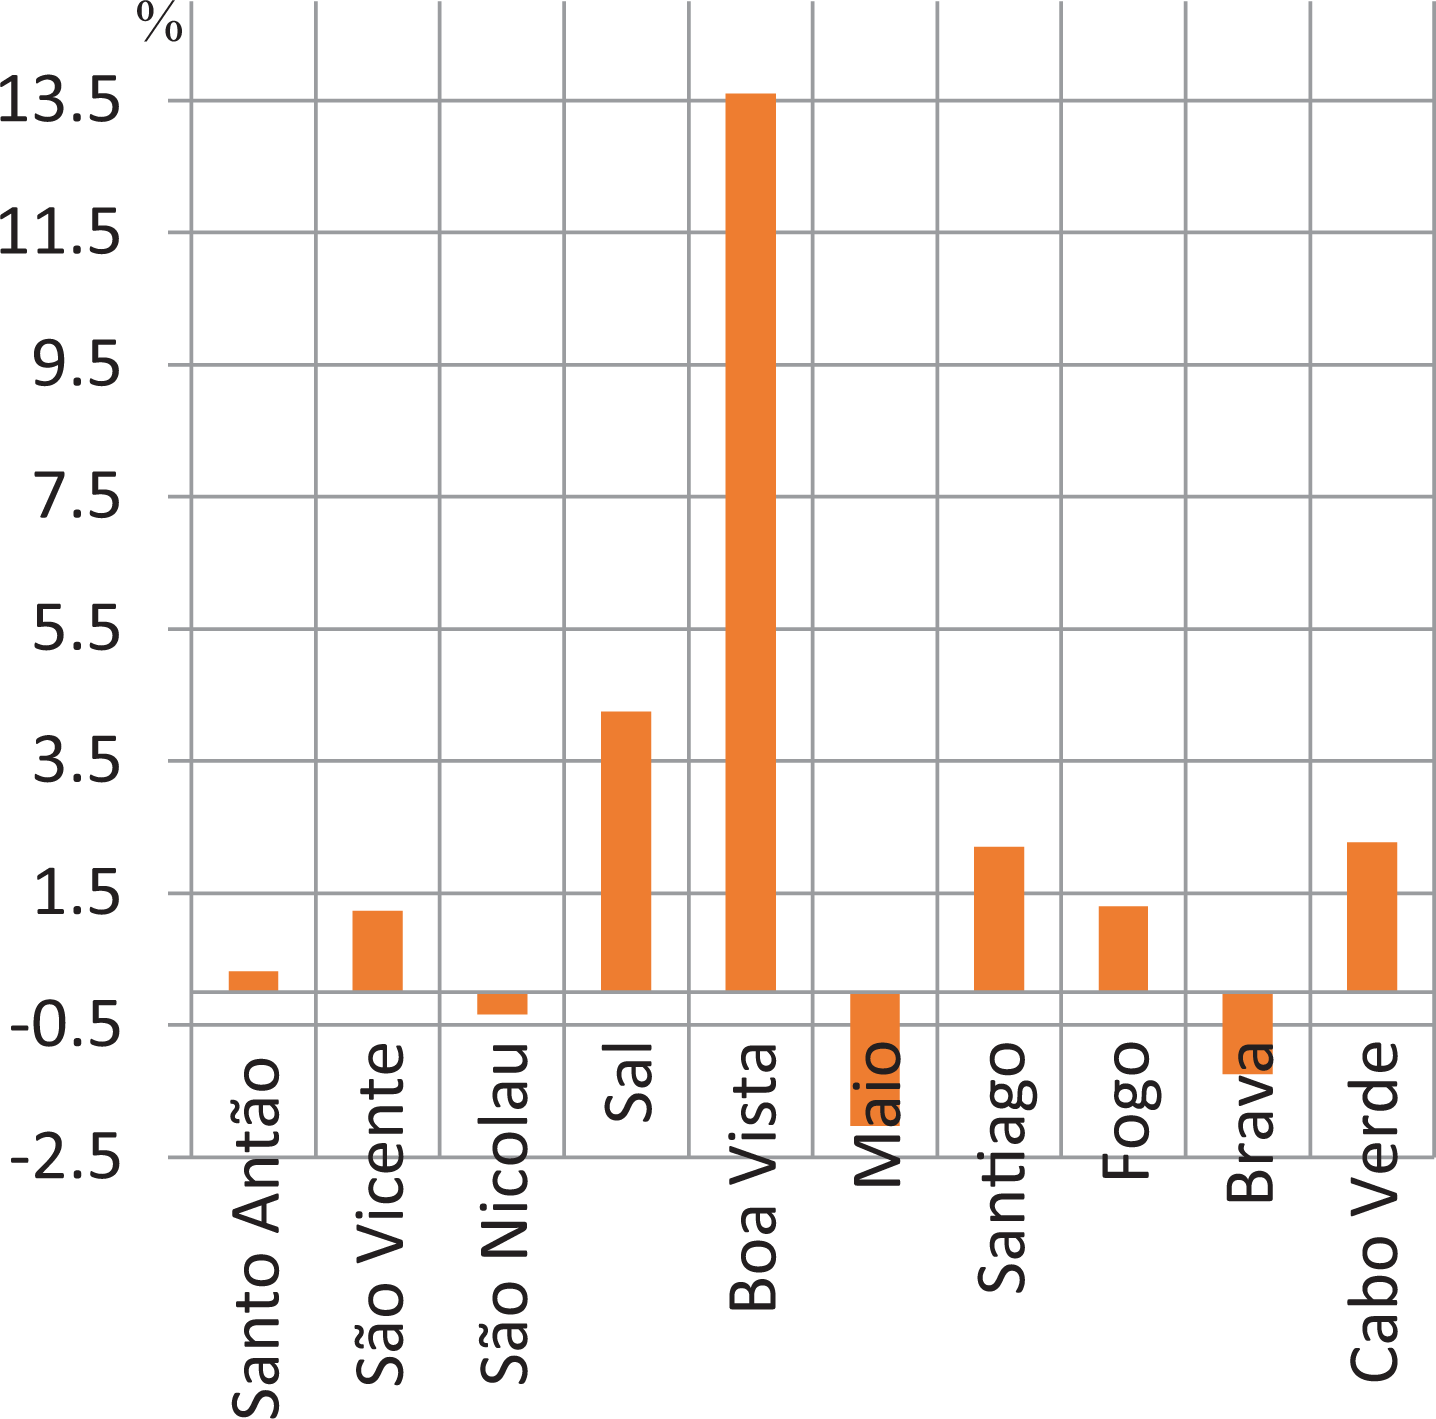
Real GDP growth* (2007–2016). Source: Author’s own calculations based on data obtained from the Statistical Office of Cape Verde. *The GDP at current prices was deflated by the GDP deflator for Cape Verde. GDP: gross domestic product.
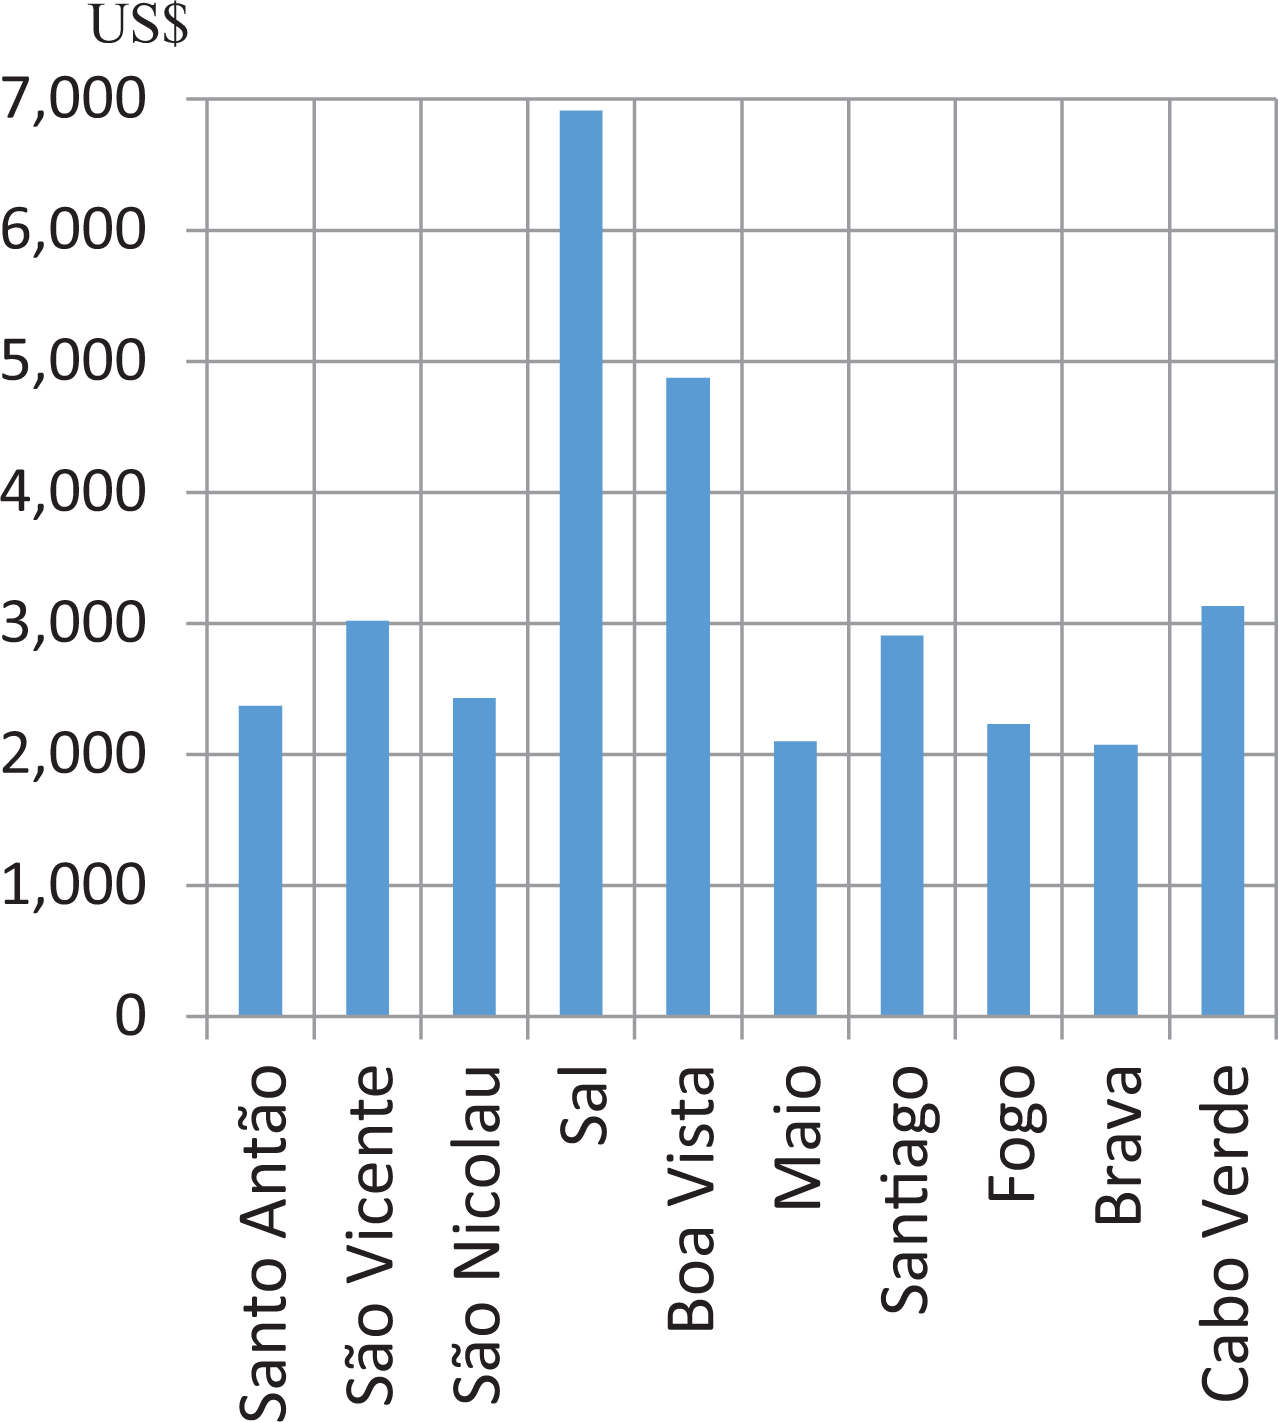
GDP per capita (US$) in 2016. Source: Author’s own calculations based on data obtained from the Statistical Office of Cape Verde. GDP: gross domestic product.
COVID-19
Tourists are afraid of catching COVID-19 while on a plane (OAG, 2020) or needing health care in foreign countries, which makes them hesitant to travel. This combined with quarantines and travel bans imposed by governments in the tourists’ countries of origin has had devastating effects on the tourism industry in Cape Verde. Many holiday resorts have remained closed in Cape Verde since March 2020 and international tourism receipts shrank by 11% and 91% during the first and second quarters of 2020, respectively, compared with the same periods in 2019 (INE, 2020; UNWTO, 2020a). Businesses in the tourism industry, including local small and medium enterprises that were viable before the pandemic, might now be vulnerable (UNWTO, 2020b). To support business survival, the government in Cape Verde has addressed liquidity shortages with assistance from international organizations. 6 Moreover, resort owners in Cape Verde (companies of the TUI group,7,8 among others) have received state loans in the countries where their headquarters are located. However, the financial resources might not be enough to protect jobs and income to mitigate the effects of the crisis on workers in this labor-intensive sector (UNWTO, 2020b). The existence of effective vaccines against COVID-19 is an important step in the fight against the pandemic, but it is too early to assess the effects of the pandemic on the tourism sector in the country. It will depend not only on the effects of the lockdown but also on when a full return to tourism activities will be possible. Stakeholders and authorities in Cape Verde and other destinations seek to restore tourists’ confidence and restart tourism, for example through the creation of safety corridors and other specific measures to stimulate international tourism. Balanced measures that avoid both delays in reopening and moving too quickly are needed. On the one side, delays in reopening might cause job losses and business closures. On the other side, moving too quickly might cause a backslide in visitors’ recovery of confidence. Cape Verde is heavily reliant on intercontinental tourism, and, according to the results of the study conducted by Kourentzes et al. (2021), long-distance travelling (e.g. from France, the United Kingdom, Germany, or the United States to South Africa and/or Mauritius) is predicted to experience longer recovery time to register similar tourist arrivals compared to before the pandemic.
Main determinants of international tourism demand
Methodology and data
Our analysis of the explanatory factors of the evolution of Cape Verde’s international tourism demand (Song and Witt, 2000; Saayman and Saayman, 2015; Seetanah et al. 2015) can be defined as follows:

where Tt is the international tourism demand variable at time t; Pt is the price of tourism in Cape Verde at time t; GDP t is the income level in the source markets at time t; AS is a dummy variable that collects the influence of the political and social instability that followed the AS in many non-European Mediterranean basin countries, CRISIS is a dummy variable that captures the effect of the international financial crisis and sovereign debt crisis in Europe, and ut represents the disturbance term.
The demand function in equation (1) can be expressed as the corresponding error correction model (ECM) using a linear transformation (Banerjee et al., 1993). This modeling representation, which is called autoregressive distributed lag (ARDL-ECM), assumes a unique model that integrates the short-run dynamics with the long-run equilibrium (Cetin et al., 2015) and has the merit of simplifying the computation of the variances of the coefficients (Balg and Metcalf, 2010). The ARDL-ECM approach entails estimating the following expression:
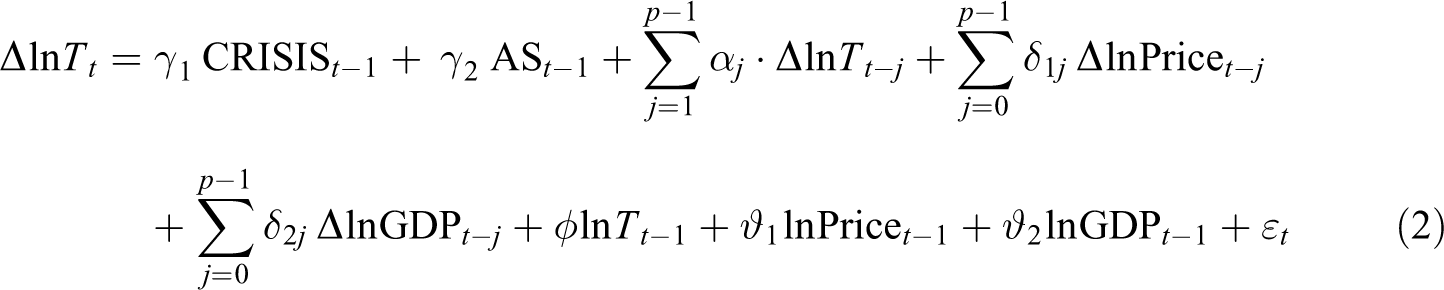
where Δ is the first-difference operator,
The justification of the chosen variables is as follows. A potential determinant of demand is income in the tourist source markets. A higher level of income in the EU countries is expected to raise the number of visitors in Cape Verde. The most common variable taken as an approximation for consumers’ income is GDP defined as
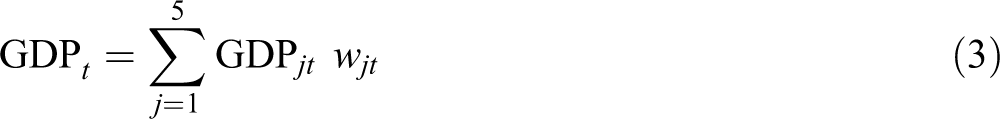
The weights wjt are the shares of source markets considered separately in the tourism statistics of Cape Verde at time t (the United Kingdom, South Africa, Switzerland, the United States, and eight Euro area member states 9 : Austria, Belgium, France, Germany, Italy, the Netherlands, Portugal, and Spain). GDP time series for South Africa and the United States come from the International Monetary Fund (IMF) database. The GDP data for the United Kingdom, Switzerland, and the Euro area were obtained from the Statistical Office of the EU (Eurostat). These time series were adjusted to control the seasonality of the data.
Second, if the price of visiting Cape Verde in the currencies of foreign visitors increases, the number of tourists will decrease and vice versa. We approximated the price at time t (Price t) by the cost of living using levels of inflation (consumer price index (CPI) 10 ), adjusted by exchange rate:
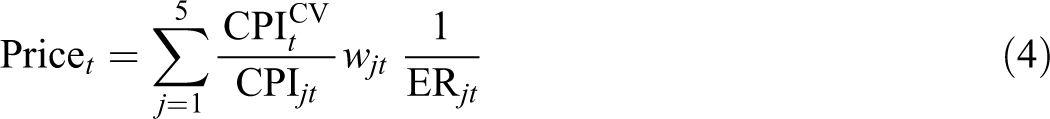
where ER jt are the nominal exchange rates between the currencies of the tourist destination and the source markets at time t, in other words, the amount of Cape Verdean escudos (CVE) needed to buy one euro (€), one pound (£), one Swiss franc (CHF), one South African rand (ZAR), or one US dollar ($). The weights wj are the share of source markets. CPI t CV and CPI jt are the CPI for Cape Verde and the major source markets at time t, respectively. The CPI for Cape Verde CPICV was downloaded from the web page of the National Statistical Office of Cape Verde. The CPI for the Euro area and United Kingdom are available on the web page of the Statistical Office of the European Union (Eurostat). CPIs for South Africa, Switzerland, and the United States come from the IMF database. The exchange rates were obtained from the Central Bank of Cape Verde (Banco Central da Republica de Cabo Verde).
Researchers agree that tourists’ decision-making, particularly the destination, can be severely affected by external shocks such as terrorist attacks, instability, or violence (Buigut and Amendah, 2016; Naudé and Saayman, 2005; Pizam and Fleischer, 2002). When considering European outbound tourism, social and political instability associated with the AS in non-European Mediterranean basin countries may have diverted European outbound tourism flows to alternative destinations, including Cape Verde. Two circumstances may have contributed to the diversion of international tourists from nations affected by the AS to Cap Verde. On the one hand, the main investors in tourism projects in Cape Verde are also key players in the flows of European outbound tourism (TUI group, DER Touristik group, Resort group, Meliá, Iberostar, Barceló). On the other hand, European countries have been traditionally the main source markets of visitors to African and Asian Mediterranean basin countries. AS is a dummy variable that aims to consider the effects of the rebellion waves that began in Tunisia and spread with speed and magnitude to other countries of the Mediterranean basin. The dummy takes the value 1 for the period between April 2010 and December 2019 and 0 for the period between January 2001 and March 2010. The global financial crisis that started 2007/2008 hit Europe hard. According to the European Commission (2017), the GDP fell by more than 5% from the last quarter of 2007 to the last quarter of 2008. The recovery from the sovereign debt crisis that followed the financial crisis started in 2013. Different studies have analyzed tourists’ behavior and economizing strategies under crisis times. Papatheodorou et al. (2010) and Campos-Soria et al. (2015) state that under crisis it is more likely that tourists stay closer to home and scale back their expenditure per night or their total holiday expenditure. The dummy variable CRISIS is included to account for the effects of this deep recession in the source markets on outbound tourism (ETC, 2009; ONS, 2017) to Cape Verde. The variable takes a value of 1 for the period 2008: Q1-2013: Q1 and 0 the rest.
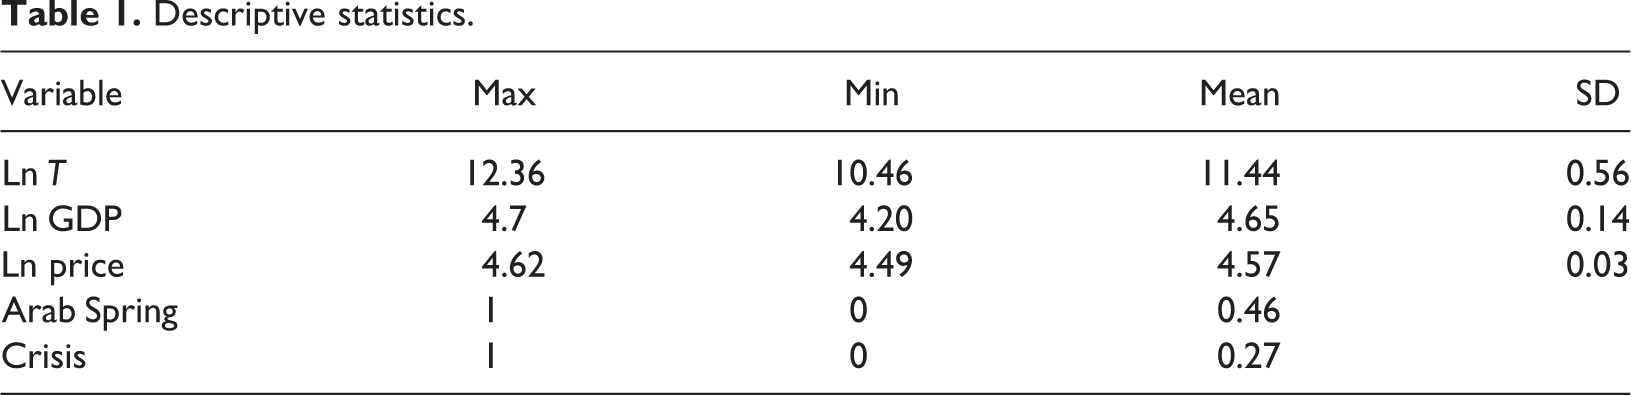
The variables have been transformed using a logarithm to reduce the variability of the data and to interpret the estimated coefficients of the explanatory variables as elasticities. Table 1 shows main statistics descriptive of the variables. The study is based on 76 quarterly observations and covers the period from 2001: Q1 to 2019: Q4.
Descriptive statistics.
Results
We considered different cointegration techniques to study the existence of a long-run equilibrium relationship between the variables included in the tourism demand. We made use of the ARDL approach to cointegration developed by Pesaran et al. (2001) because this methodology offers advantages in comparison with the traditional cointegration techniques (El Engle and Granger, 1987; Johansen and Juselius, 1990). First, the ARDL approach can be used irrespectively of whether the underlying explanatory variables are I(0), I(1), or a mixture of both (De Vita and Abbott, 2002). Second, this technique has been used in time series analyses in a number of fields (e.g. tourism: Saayman and Saayman, 2015; finance: Belke and Polleit, 2006); agriculture: Muchapondwa, 2009; energy: Narayan and Smyth, 2005). Third, the ARDL model takes a sufficient number of lags to appropriately represent the data-generating process and different variables can be assigned different lag-lengths. Another reason that justifies the use of this approach is that even with small or finite sample data sizes, it is consistent and more efficient than the traditional cointegration techniques (Pesaran and Shin, 1999). However, despite this great advantage, it is necessary to check that the variables are not I(2). If this were the case, the approach would produce spurious results.
Therefore, it is necessary to know the order of integration of the variables included in the estimation (Pesaran et al., 2001). Table 2 shows the results of the ADF and KPSS unit root tests. In our observations, the tests provide clear evidence that none of the variables are I(2) and, consequently, the ARDL bounds testing approach to cointegration is applicable for studying the existence of a cointegration relationship between the variables defined in equation (2).
ADF and KSPSS unit root tests results.

Note: GDP: gross domestic product. The symbol *** means rejection of the null hypothesis at the 1%, level. For the KPSS tests, the number of bandwidth are shown in brackets according to the Newey–West Criterion using Bartlett Kernel. For the ADF test, the number of lags are shown in brackets according to the Schwarz information Criterion.
However, we must first determine an appropriate lag length p for the ARDL model represented in equation (2). Pesaran and Shin (1999) recommended choosing a maximum of eight lags when the periodicity of the data is quarterly. In our study, the optimal number of lags is selected according to the Schwarz Bayesian information criterion, which is found to be (3, 1, 0).
The cointegration procedure is based on two tests to check the null hypothesis that the variables are not cointegrated (Pesaran et al., 2001). First, an F-statistic to test the joint nullity of all long-run regression coefficients
Table 3 shows the values of the F and tI statistics and the corresponding critical value bounds for two explanatory variables represented in Pesaran et al. (2001). As we can see, the F-statistic is F = 3.95 and t-statistic is |t| = 9.04, which in both cases are above their respective critical bounds at the 5% and 1% significance level, respectively. Therefore, the null hypotheses on no cointegration is rejected and there is conclusive evidence of a long-run relationship between the number of visitors to Cape Verde and the explanatory factors (e.g. GDP, Price, AS, and CRISIS).
Critical values and bound test for cointegration.
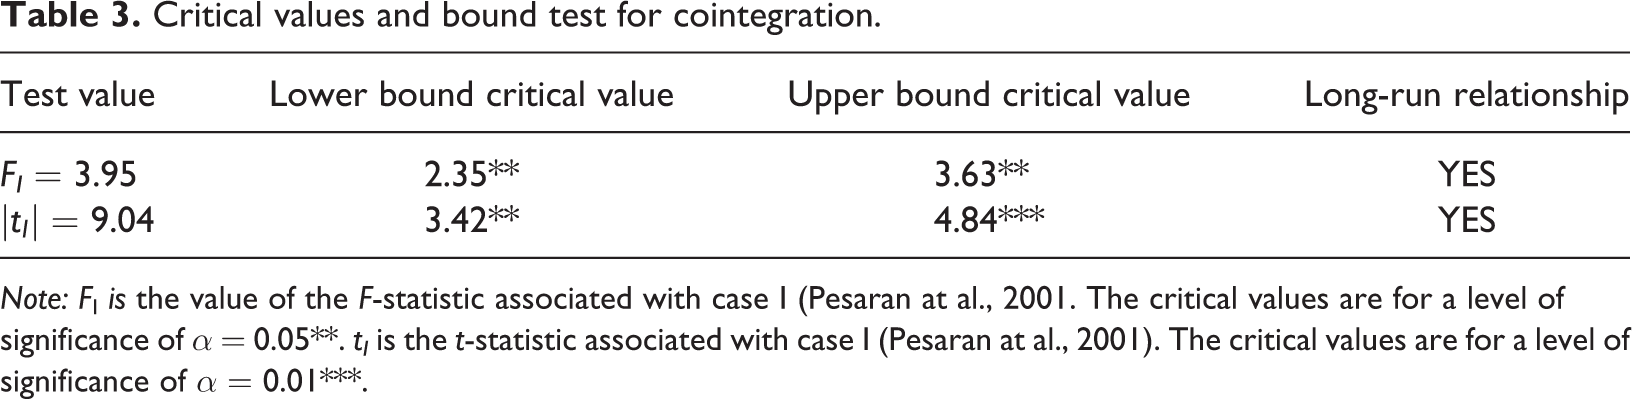
Note: FI is the value of the F-statistic associated with case I (Pesaran at al., 2001. The critical values are for a level of significance of α = 0.05**. tI is the t-statistic associated with case I (Pesaran at al., 2001). The critical values are for a level of significance of α = 0.01***.
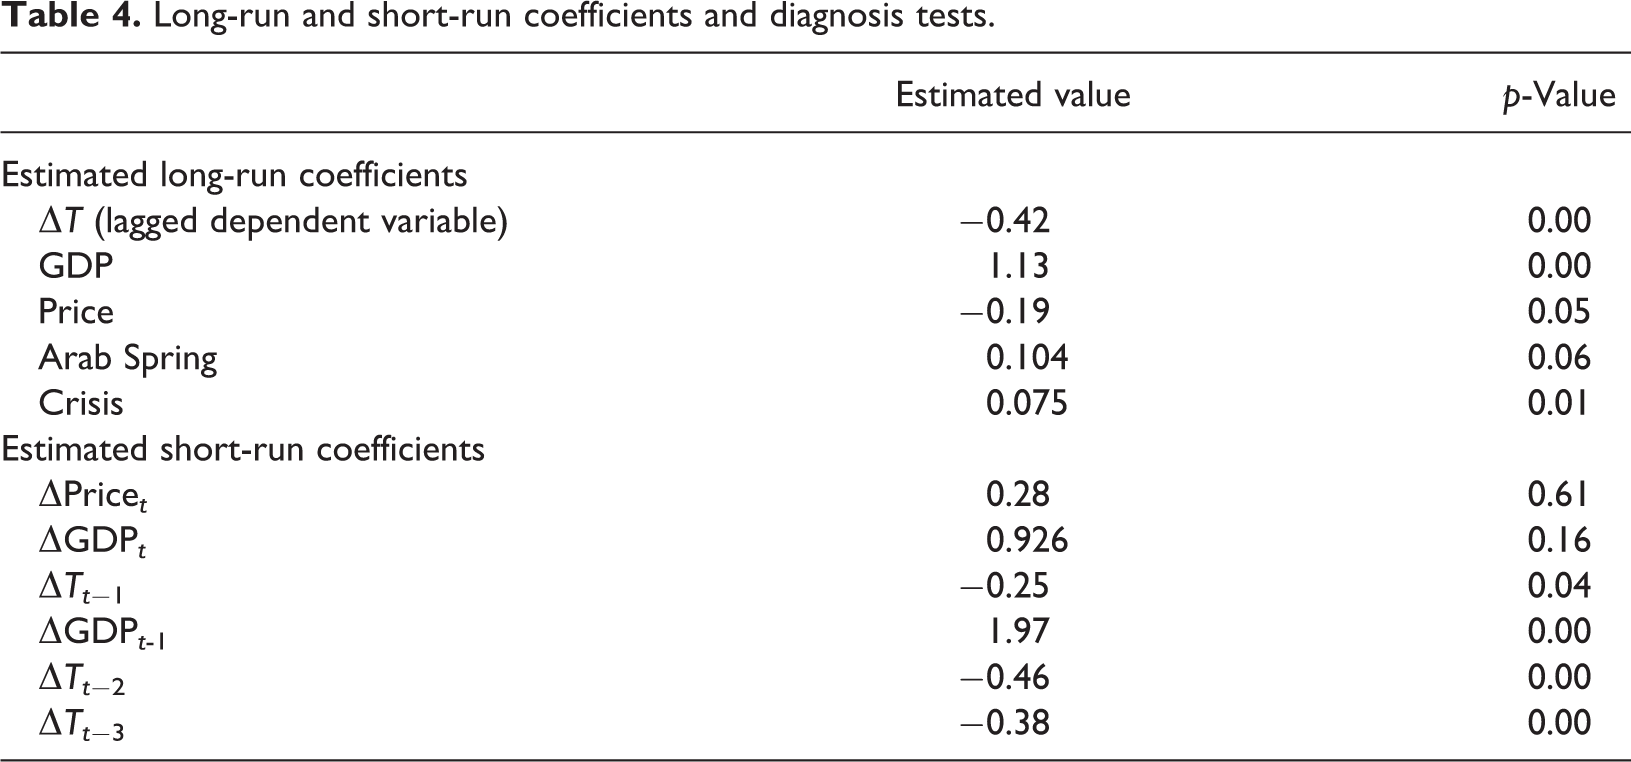
Table 4 provides the ARDL-ECM that captures this relationship. The signs of the long-run coefficients are consistent with the economic theory and are statistically significant. They are estimated to be −0.19 and 1.13 for price (Price) and income (GDP), respectively. Moreover, the coefficients of the dummy variables AS and CRISIS are also statistically significant and show the expected signs. First, the less stable political and social background in these competing non-European Mediterranean tourism destinations has lent a sizable advantage for European outbound tourism to Cape Verde and its competitive advantage relative to them has improved. Terrorist attacks and political and social unrest have affected some traditional European outbound tourism destinations, mainly Tunisia and Egypt, whereas there has been a lack of security concerns in Cape Verde. Second, the variable CRISIS has a statistically significant positive impact on European inbound tourism to Cape Verde, indicating that more European tourists chose this tour operator driven market destination characterized by low priced packages and charter flights during the crisis. This suggests that Cape Verde fitted the needs of European tourists, who opted to cut back on holiday expenditures during the crisis period. These results are in line with previous literature that found evidence that tourists economize in holiday expenditures rather than take fewer holidays. (Campos-Soria et al., 2015; Eugenio-Martin and Campos-Soria, 2014; Papatheodorou et al., 2010).
Long-run and short-run coefficients and diagnosis tests.
Finally, the estimated coefficient
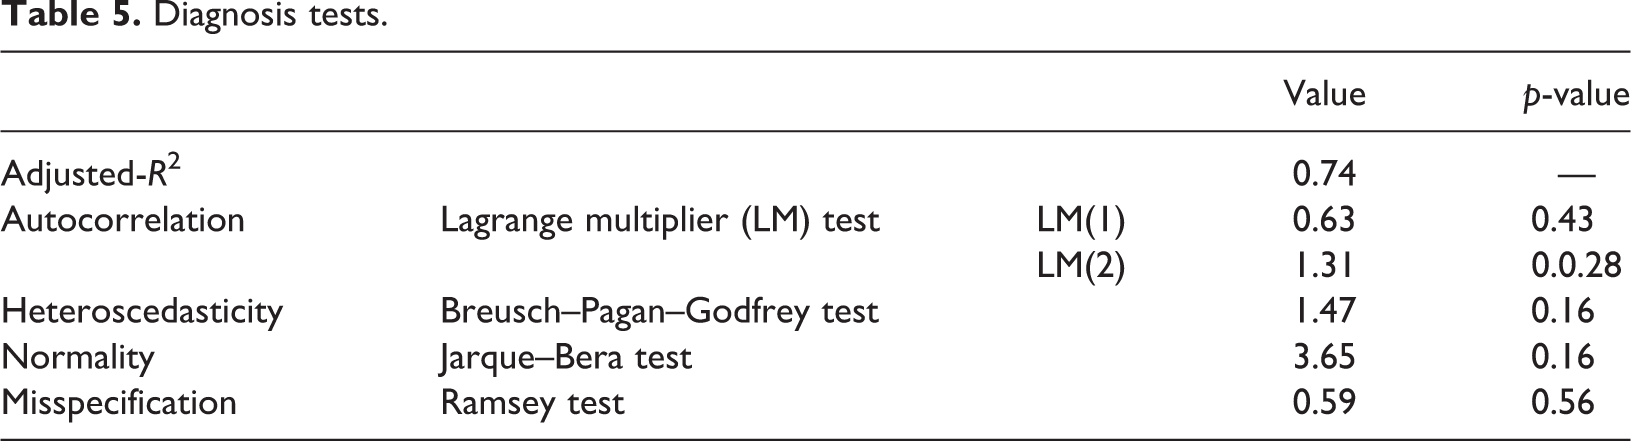
Table 5 also shows the diagnostic tests that verify the econometric validity and strength of the estimated coefficients. Based on tests commonly used in the literature, the null hypothesis on homoscedasticity (Breusch–Pagan–Godfrey test), no serial correlation (LM test and Ljung–Box Q tests), normality (Jarque–Bera test), and no misspecification (Ramsey test) were rejected. Furthermore, the goodness of fit (adjusted R2 = 0.74) was relatively high.
Diagnosis tests.
To quantify the effects, we calculate the point estimates of the elasticities using the expression (equation (5)) proposed by Bardsen (1989):
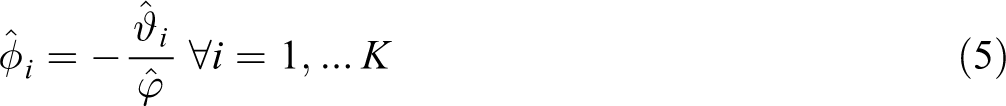
where
The price elasticity tells us that a 1% price increase reduces international tourism to the archipelago by 0.45%, indicating a price inelastic international tourism demand for Cape Verde. Khandaroo and Seetanah (2008) and Saayman and Saayman (2015) among others have also found a relatively price inelastic demand for tourism destinations in Africa.
The calculated price elasticity also indicates that the fall in revenue caused by a price decline in holiday packages would be higher than the revenue increase due to the greater number of tourists (Song et al., 2003), unless the price decline raised the international tourism revenue by extending the length of guests’ stay as Song et al. (2010) reported.
The coefficients of the price variable in the short run are not statistically significant. This implies that short-run price does not play a major role in determining the demand for Cape Verde international tourism and may suggest that tourists cannot fully adjust their behaviors in the short run when the price changes (Li et al., 2004).
Regarding the dummy variables, turmoil in the Mediterranean basin countries of North Africa and Asia has led to a 10.4% increase in international tourism to Cape Verde and the number of arrivals increased by 7.5% during the 2008–2013 crisis period.
Concluding remarks
The aim of this empirical study was to shed light on the determinants of European tourism arrivals in Cape Verde as one of the most recent SIDSs to experience expansion of international tourism demand. Consequently, tourism has become its main source of tax revenue, job creation, GDP-per-capita growth, and foreign exchange supplies. The main results and practical implications derived from our study can be summarized in the following points: As expected, our findings reveal that income in visitors’ country of origin of has a long-run effect on the number of arrivals. It is a main explanatory variable of European tourism arrivals to Cape Verde. This result could be helpful for the design of more efficient operational strategies; for example, the estimated income elasticity can be useful to assess how economic cycles in the source markets affect future international tourism to Cape Verde. The relatively price inelastic demand is also in line with previous studies for destinations in Africa. Despite this price inelastic demand, authorities should be aware of inflation differentials with respect to the source markets adjusted by the exchange rates that despite the price inelastic demand would cause declines in European tourism arrivals to Cape Verde. The calculated price elasticity provides information for professionals in the tourism industry and policy makers to maximize tourism revenue. It is important to note the stable macroeconomic background with low inflation rates during the period of analysis. Consequently, macroeconomic stability has successfully helped to attract foreign investment to the tourism sector. Moreover, given that inflation rate in Cape Verde shows a similar development as in the tourist’s origin countries, there was no need for a depreciation of the domestic currency (Cape Verdean Escudo) against the currencies of the tourists’ source markets, mainly euro and pound, to offset the lost tourism price competitiveness of Cape Verde relative to other destinations. The depreciation of the own currency against currencies of tourist’s origin countries could have harmed the revenue of inbound tourism, as Chao et al. (2013) reported. In addition, according to previous studies, exchange rate volatility can affect visitor’s expenditure and arrivals (Saayman and Saayman, 2013). Qualitative factors were found to be relevant in explaining tourism arrivals to this medium-haul destination. First, we found a positive effect of the years of deep economic crisis in the source markets of tourists. This suggests that European tourists, who economized in holiday expenditures, chose the destination of Cape Verde characterized by low priced packages and charter flights. Second, results indicate that the instability that followed the AS in many non-European Mediterranean basin countries accelerated the expansion of international tourism in Cape Verde. The political and social instability in those countries appears to be the most relevant determinant of international tourism to Cape Verde. Three circumstances might have played a key role in taking advantage of the diversion of international tourists from non-European Mediterranean basin countries to Cape Verde. The first circumstance is the country’s relative geographical closeness to Europe (Viljoen at al., 2019). Second, the main investors in Cape Verde tourism projects are key players (UNCTAD, 2018) in the flows of European outbound tourism (DER Touristik group, Meliá, Iberostar, Resort Group, TUI group). Third, European countries are also the main source markets of international tourism arrivals to Mediterranean basin countries of North Africa and Asia. Investments have already been undertaken, and multinational firms have now been operating in Cape Verde for many years. Therefore, it is difficult to foresee how the possible restoration of tourism destinations affected by the AS will influence international demand for tourism to Cape Verde. Nevertheless, hotels and governments should undertake measures to create a safe environment for tourists and avoid crime or social unrest that could hurt the tourism industry.
The absence of time series data for the period of analysis constitutes the main limitation of this study, for example, CPI for package holidays, tourism demand time series by country or region of origin, and qualitative factors that were found to be relevant in explaining tourism arrivals to African destinations such as infrastructure, level of development, or health risk (Adeola et al., 2018; Naudé and Saayman, 2005; Saayman and De Klerk, 2019; Viljoen et al., 2019). It might be worthwhile for further research to overcome these limitations when data availability makes it possible.
COVID-19 brought the tourism expansion in Cape Verde to a halt. The effects of the pandemic are devastating on this medium-haul developing destination. The existence of effective vaccines is an important step to recover tourists’ confidence. However, vaccination will take time and people might be afraid of flying or needing health care in foreign countries. This makes medium-haul destinations less likely to be selected for traveling. Under these circumstances, stakeholders have no other option but to reduce this uncertainty brought by COVID-19 by reassuring travelers that both flying to and staying in Cape Verde on holidays is safe. The findings reported in our study provide information that helps to characterize the demand and can be of great assistance for different actors in the tourism sector to encourage tourists back to visit the islands.
Footnotes
Acknowledgments
The author thanks both the University of Cape for the invitation to teach in the doctoral program that was the starting point for this study and the support from the Statistical National Office of Cape Verde for the facility to access the data. He also acknowledges the sabbatical year granted by his employee, which gave him the opportunity to devote full time to research.
Declaration of conflicting interests
The author(s) declared no potential conflicts of interest with respect to the research, authorship, and/or publication of this article.
Funding
The author(s) disclosed receipt of the following financial support for the research, authorship, and/or publication of this article: The study was funded by University of Capetown.