
Abstract
In this article, we analyse the extent of the spillover from international tourism demand on tourism sector equity indices and find that the magnitude of the spillovers are quite dispersed across different markets, which is in line with previous studies. Novel to the literature, we examine the impact of solvency and profitability positions of the firms in the tourism equity indices on evaluating the magnitude of the spillovers from tourism demand to sector equity indices. Firms that have better solvency ratios and operated in deeper financial markets find their stock returns are affected less from the fluctuations in tourism demand. Profitability positions of the firms, however, do not have significant impact on explaining the spillovers.
Highlights
We identify the spillovers from tourism demand to tourism sector indices. Magnitude of the spillovers is not same across counties. Spillovers depend of the depth of the market. Firms that have strong liquidity position have affected less from tourism demand shocks.
Introduction
Growth in the tourism industry outperformed the growth of the global economy in recent years. For instance, in 2016, the tourism industry contributed US$7.6 trillion to the global economy, which was a significant 10.2% of the global Gross Domestic Product, and generated 292 million jobs, which meant 1 in 10 jobs on the planet (World Economic Forum, 2017). Subsequently, tourism-based industries have also emerged all around the world and have generated substantial amounts of income. Particularly, the developed economies created good opportunities for firms operating under the tourism and leisure sectors and they are listed under national equity indices. The tourism sector mostly invites a substantial amount of domestic and foreign investment, and the stocks in these sectors are becoming increasingly attractive to all types of investors (Jalkh et al., 2020; Nunkoo et al., 2020). Similar to other economic sectors, the tourism sector equity indices have been greatly influenced by main macroeconomic and global factors, including economic growth, interest rates, economic policy uncertainty (EPR) and geopolitical policy uncertainty (GPR) (Balli et al., 2018, 2019). Previously the impact of the international tourism demand – through economic policy uncertainties – on the tourism equity indices had been researched in various studies. Demir and Gözgör (2018) discussed the impact of policy uncertainty on outbound tourism demand, suggesting that the higher uncertainty level resulted in lower outbound tourism. Balli et al. (2018) investigated how economic policy uncertainties affected tourism demand. Their results indicated that the impacts of EPU on tourism were different in various countries. Madanoglu and Ozdemir (2018) examined the link between policy uncertainty and hotel operating performances, stating that there existed negative influences between hotel performances and EPUs. Tiwari et al. (2019) explored the relationships between policy uncertainty, tourist arrivals and geopolitical risks. The results indicated that geopolitical risks exerted greater impacts on tourist arrivals than policy uncertainty.
Literature has a consensus that economic and geopolitical policy uncertainties have an impact on tourism equity indices; however, the previous studies are silent on identifying the direct relationship between tourism demand and tourism equity indices. In this study, we explore this nexus and find that tourism demand has impact on the tourism equity sectors but not uniformly across countries. We performed spillover analysis followed by Diebold and Yilmaz (2012) and Barunik and Krehlik (2018) to explore the spillovers from tourism demand to tourism equity sector indices. Figures 1(a) contain the results and indicate that spillovers from tourism demand to equity markets are not equivalent among countries. Interestingly magnitudes of the impact change with the duration of the tourism demand shocks. The differences among the magnitudes of the spillovers motivate us to go one step further. We observe that firms’ (sectors) solvency positions are quite helpful in explaining the magnitude of the spillovers. We find that when firms from the tourism sector have higher debt and interest expense, the extent of the spillovers from international tourism demand to sector equity indices increases. The profitability positions of the firms, however, do not have significant impact on explaining the extent of spillovers from tourism demand to the sector indices. Total Net spillovers from tourism demand to tourism sectors (a) total spillovers (b) short-term spillovers (c) medium-term spillovers (d) long-term spillovers.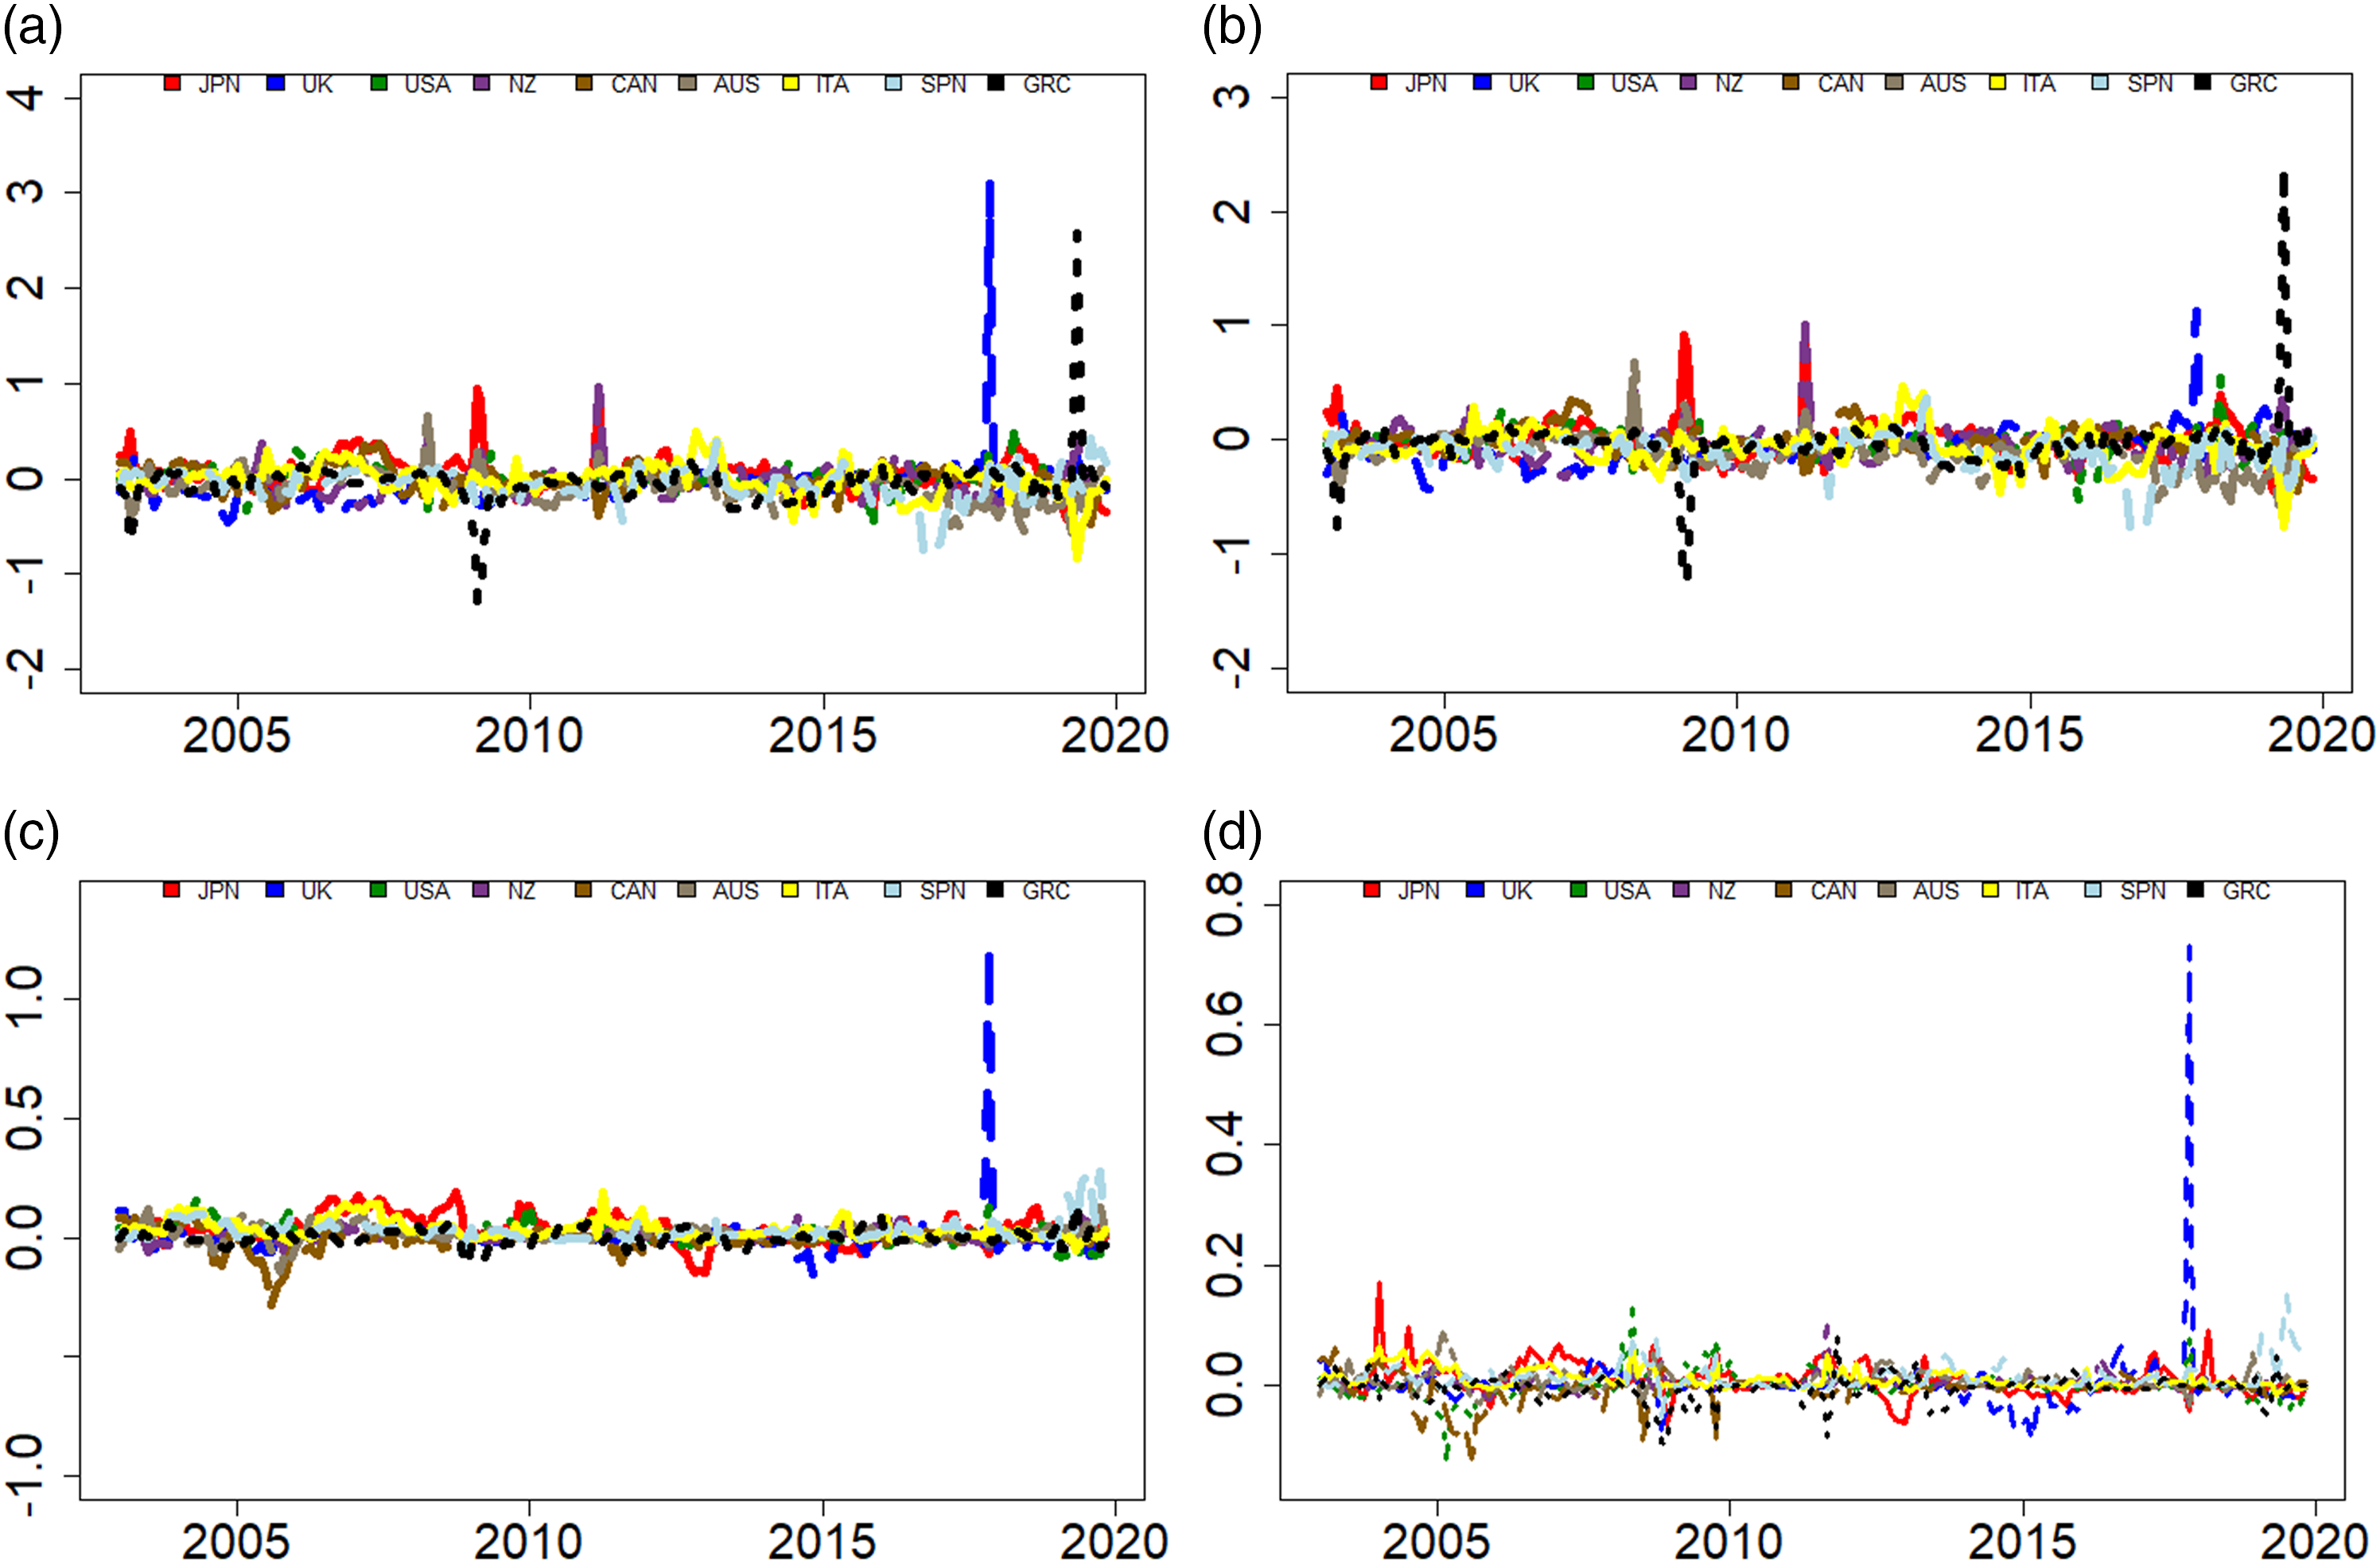
Data and spillovers
We obtained the monthly data of tourism arrivals from each country from their official websites over a period from January 2000 back to November 2019. Additionally, we obtained the monthly price for travel and leisure sectors along with the solvency and profitability positions from Datastream. The choice of countries solely depended upon the availability of data. Tourist arrival series were seasonally adjusted.
We employ the spillover methodology of Diebold and Yilmaz (2012), which facilitates understanding of the connectedness between tourism demand and equity sector. Based on the generalized vector autoregression framework of Koop et al. (1996). Consequently, a series

Utilizing the Baruník and Křehlík (2018) framework of frequency connectedness, we then quantify the spillovers over short-, medium- and long term.
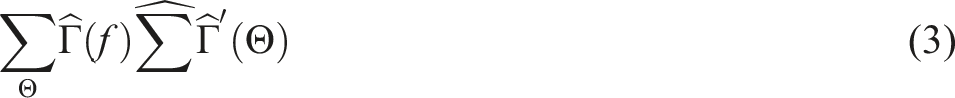
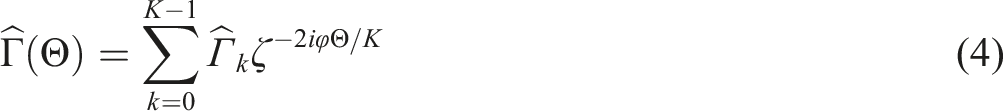
Accordingly, the Fourier transform of the coefficients

Following Barunik and Krehlik (2018), the cross-spectral density of the interval,
Where the loss degree of freedom adjustments is represented with

A rolling window of 36 months is used to estimate the daily connectedness. We convert daily connectedness into an annual average for regression as the financial position variables are available annually. The Diebold-Yilmaz (2012) and Baruník and Křehlík (2018) models are implemented to obtain the spillovers from tourism demand to tourism equity indices, and results are presented in Figure 1(a)–(d). Not only the time varying connectedness of the tourism demand with tourism equity indices but also short-run and medium-run models reveal significant differences among different countries. The different reactions of equity markets to international tourism demand shocks made us investigate further. In particular, this finding might be crucial for portfolio holders who want to internalize the tourism demand effect on sector indices. Next, we looked for the factors that underline the differences between markets.
Determinants of the spillovers
Identifying the magnitude of spillovers from international tourism to tourism sector equity indices, we have observed that the extent is quite dispersed. Novel to the literature, the determinants of the magnitude of the spillovers are explored in the next step. A hypothesis was advanced that the impact of the tourism demand shocks on sectoral markets was linked to the depth of the equity market (market capitalization; MCAP), the solvency positions of the firms, that is, net debt

Here, the dependent variable,
DY spillovers from international tourism demand to tourism sector equities.
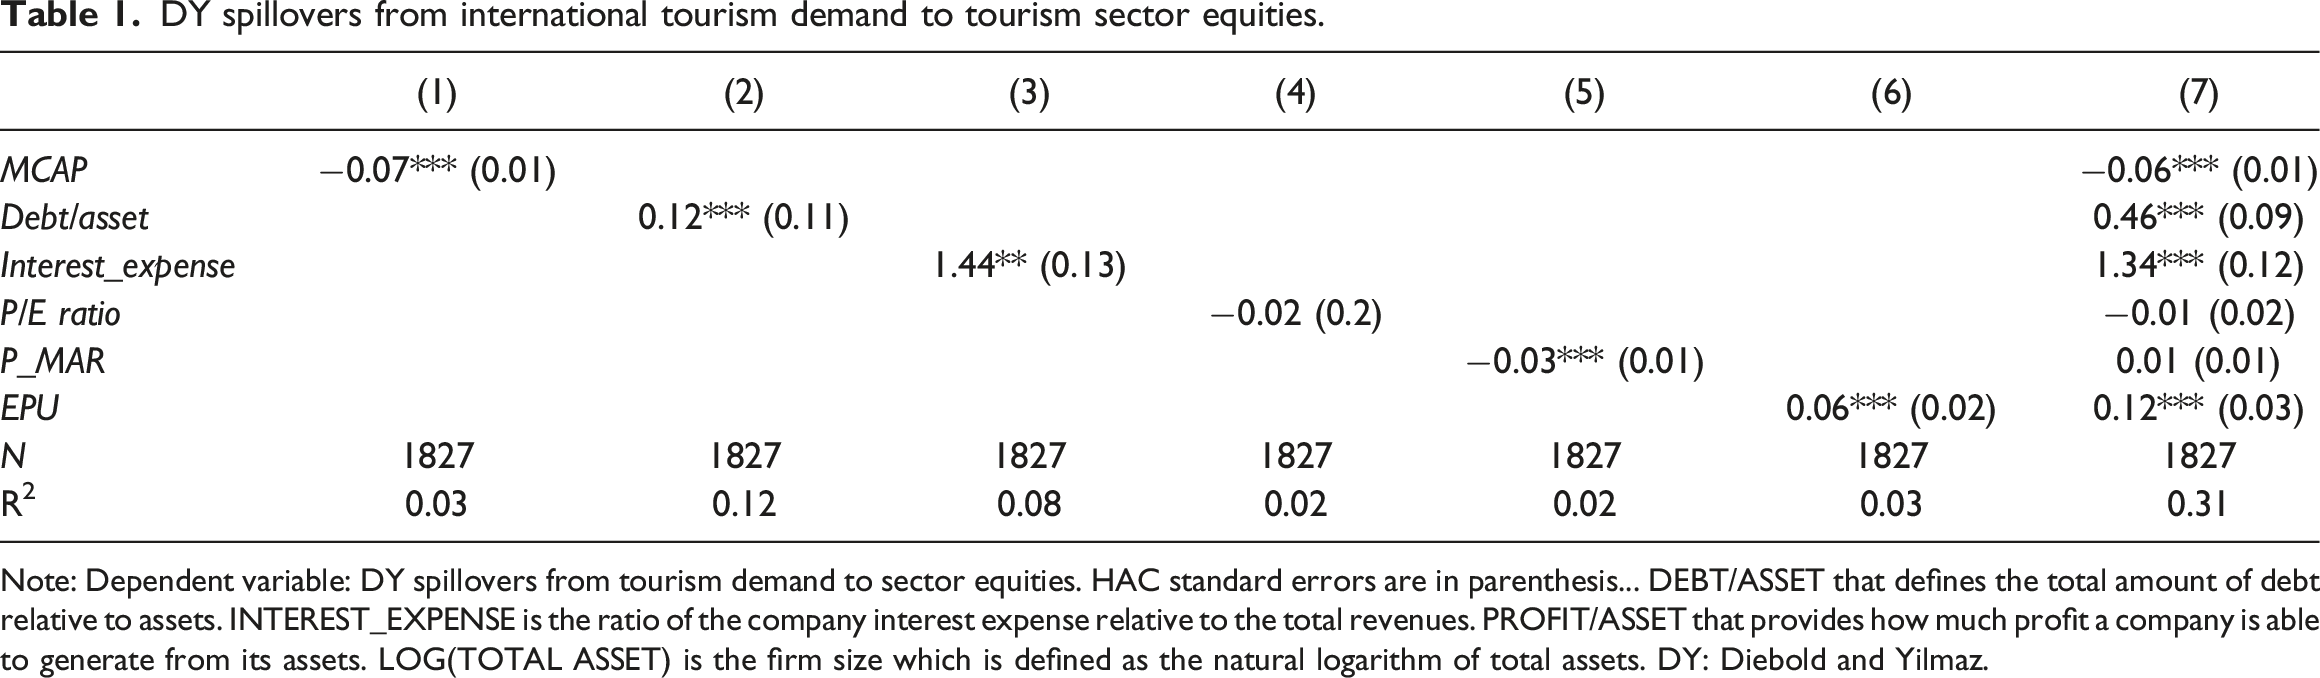
Note: Dependent variable: DY spillovers from tourism demand to sector equities. HAC standard errors are in parenthesis... DEBT/ASSET that defines the total amount of debt relative to assets. INTEREST_EXPENSE is the ratio of the company interest expense relative to the total revenues. PROFIT/ASSET that provides how much profit a company is able to generate from its assets. LOG(TOTAL ASSET) is the firm size which is defined as the natural logarithm of total assets. DY: Diebold and Yilmaz.
Baruník–Křehlík spillovers from international tourism demand to tourism sector equities.
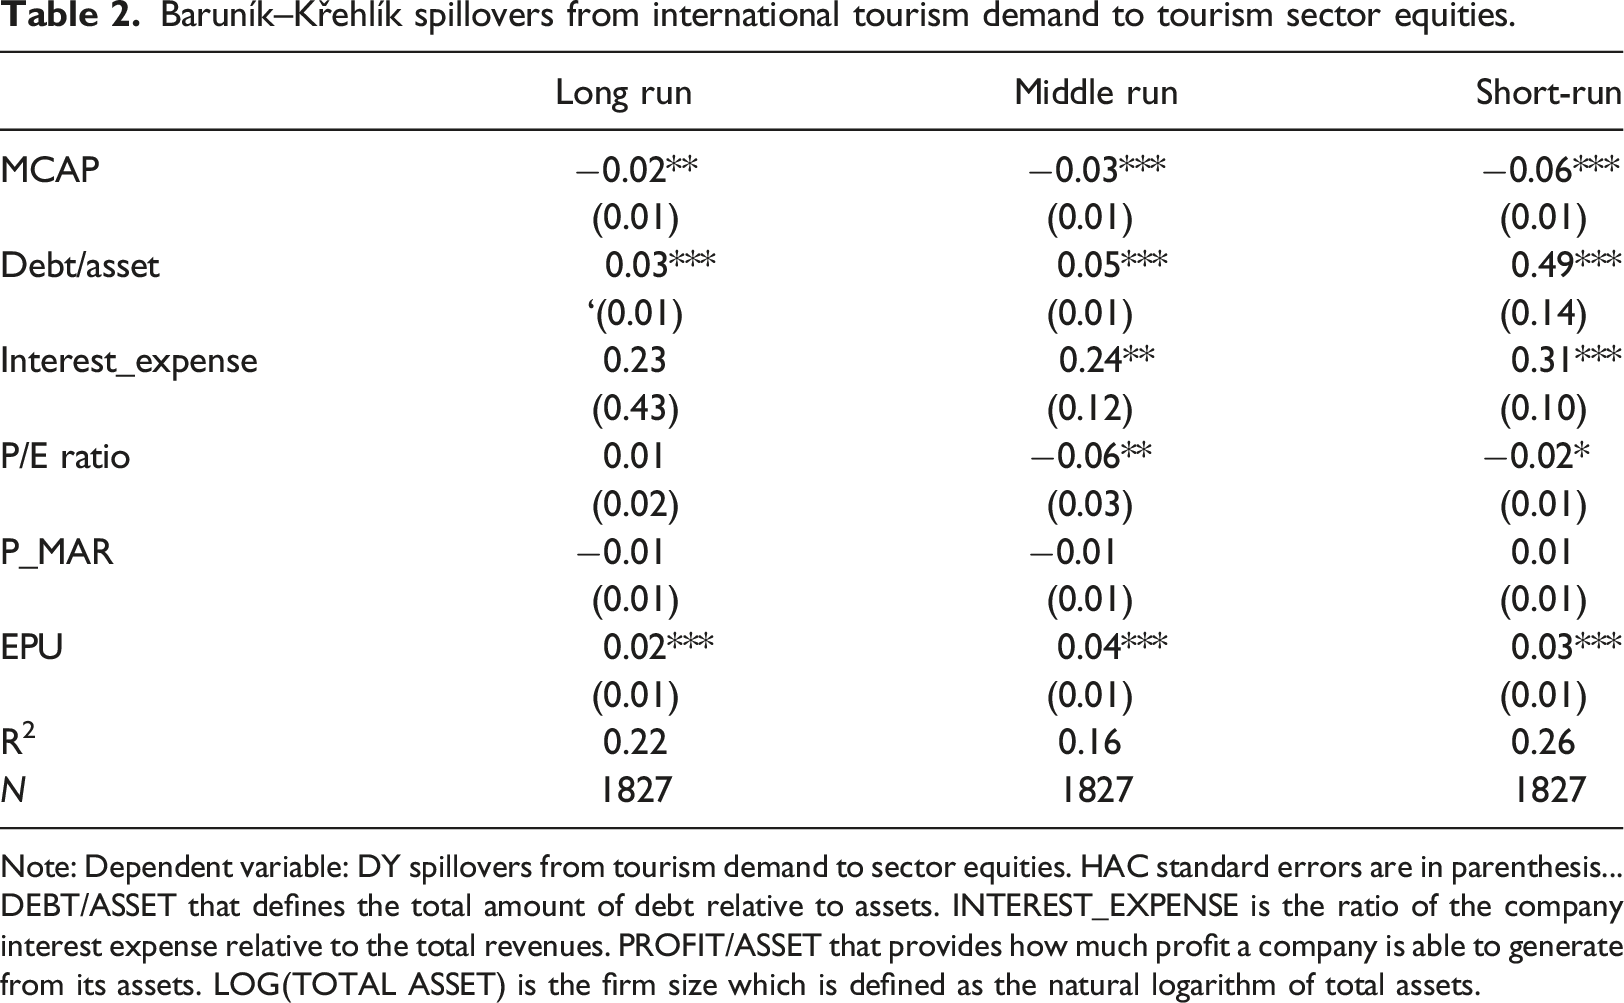
Note: Dependent variable: DY spillovers from tourism demand to sector equities. HAC standard errors are in parenthesis... DEBT/ASSET that defines the total amount of debt relative to assets. INTEREST_EXPENSE is the ratio of the company interest expense relative to the total revenues. PROFIT/ASSET that provides how much profit a company is able to generate from its assets. LOG(TOTAL ASSET) is the firm size which is defined as the natural logarithm of total assets.
Univariate estimations are provided between columns 1–6, and the complete model is presented in column 7 of Table 1. Almost all variables were statistically significant at the 1% or 5% levels. Column 1 states a significant impact of the country level of capitalization rate on the spillovers, indicating that bigger tourism sector equity markets are affected more from tourism demand shocks. In columns 2–6, we have tested the financial and solvency positions of the firms. The magnitude of spillovers is affected positively with an increase in debt to asset ratio but negatively with interest expense coverage and profit margins. Positive debt to asset coefficients indicates that, for sectors having more debt, more vulnerable sectors get more tourism demand shocks. We have observed a positive impact on interest expense ratio on the spillovers. Interest expense is the ratio of interest expense to total revenue, another variable for the solvency position of the sector. As it is expected, higher interest expense (relative to revenues) might make sectors more vulnerable; therefore, higher spillovers from tourism demand to equity indices are observed. Hence, for the firms in the tourism indices, the lower interest expense and debt to asset ratios, the firms’ equities will be more immune to the tourism demand fluctuations. We also control for the depth of the financial market that firms are operating in with the MCAP variable. This variable is highly significant in both univariate and multivariate models, suggesting that higher market capitalization in a country or region is associated with a greater magnitude of shocks to other sectors. Profitability margin has a significant and negative impact in column 5 but not in the last column and not in Table 1, indicating that profit margin is not a detrimental factor in explaining spillovers from tourism demand to tourism indices. In order to control for global economic shocks, we employed the global EPU index and presented the results in columns 6 and 7. Both estimations indicate the importance of the EPU shocks on explaining the spillovers. As the global economy becomes more uncertain (i.e., higher EPU), just like pandemic effect, there will be more spillovers from tourism demand to tourism equity indices. In other words, tourism equity indices will not be independent from tourism demand shocks under uncertainties.
In Table 2, we have used short-, medium- and long-run spillovers following Barunik and Krehlik (2018) as a robustness check. We have employed the same model, only the dependent variables being calculated as long-, short-, or medium-term spillovers. Our empirical model in equation (6) is also valid when it explains the determinants of the short-term and medium-term spillovers from tourism demand to equity indices. Solvency positions, financial depth and EPU are also significant in the short term and medium term as well. On the other hand, the determinant factors lose power in explaining the long-run spillovers.
Conclusion
In this study, we investigated the extent of the spillovers from international tourism demand on sector equity indices and we found that the impacts of international tourism demand on tourism equity indices is strong but not equivalent across countries (or markets). Firms that had stronger solvency positions (i.e. lower interest expense and debt to asset ratios) and operated in deeper financial markets, their equity market returns were affected less from the fluctuations in international tourism demand. Profitability positions of the firms, however, did not have significant impact on explaining the magnitude of the spillovers. Lastly, the EPU shocks made equity returns more vulnerable to tourism demand fluctuations.
Portfolio managers would be interested in our findings since when they hold tourism equity indices, they would consider that those indices would be more immune to global shocks like tourism demand and EPU when the indices have better solvency ratios. Accordingly, those equity indices can be used as better diversifier assets in the portfolios. Particularly, in the global shock periods (like the COVID-19 era) where tourism demand might decrease substantially, portfolio holders would like to know tourism indices that would be affected less from the global shocks and can be good diversifying instruments.
Footnotes
Declaration of conflicting interests
The author(s) declared no potential conflicts of interest with respect to the research, authorship, and/or publication of this article.
Funding
The author(s) disclosed receipt of the following financial support for the research, authorship, and/or publication of this article: Muhammad Abubakr Naeem gratefully acknowledges the support of Science Foundation Ireland under grant number 16/SPP/3347.