
Abstract
The scope of this study is to unravel possible convergence clubs regarding the occupancy rates of the hotel industry in the US states in the aftermath of the first COVID-19 pandemic wave. For this reason, the underlying paper resorts to the application of the generic convergence algorithm developed in Phillips and Sul (2007) for a sample of 50 US states over the daily period ranging from 01.12.2019 to 26.07.2020. The empirical analysis supports the identification of two primary convergence clubs consisting of an equally distributed number of regions (states). However, the two clubs can be merged into one after the implementation of the Phillips and Sul (2009) methodology, revealing that the first pandemic wave has eliminated any distinct (economic) characteristic between the different US states.
JEL codes:
Introduction
Since the dawn of 2020, the global hotel industry has been hit hard by the COVID-19 disease see among others, (Assaf and Scuderi, 2020). The coronavirus (SARS-CoV-2), which was first reported in China back in December 2019, has been declared a pandemic by the World Health Organization on the 11th of March 2020. This pandemic crisis has posed unprecedented health, social, and economic restraints, affecting every sector of the economy including the hotel industry. The present ongoing crisis represents one of the greatest challenges for the hotel industry. The response to such a challenge is not an easy task for policymakers and stakeholders (hotel managers, market participants, other related professionals, etc.) due to the dynamic “profile” of the pandemic.
Several studies analyze the effect of the pandemic crisis on the performance of the hotel industry (Boto-García and Leoni, 2021; Kock et al., 2020; Lee et al., 2020; Payne et al., 2021; Tsionas, 2020) by employing several econometric techniques. However, the investigation of convergence/divergence patterns in the hotel industry amid the pandemic crisis has been nearly overlooked by the existing studies since most of them focus solely on the convergence of tourism demand (Mérida et al., 2016). To draw sharp inferences concerning the convergence behavior of the US hotel industry and offer some primary policy strategies considering the gradual recovery of the sector, this study lends support to the application of the Phillips and Sul (P-S) algorithm to identify several convergence clubs (clusters) among the spatial units of the US sample.
The relevant study has several novelties. First, and foremost, this is the first attempt to our knowledge’s best for the investigation of possible convergence clusters in the US hotel industry during the first pandemic wave. Second, the econometric analysis relies on a high-frequency aggregated panel dataset consisting of daily data to better capture the related volatility of the sample variables compared with most of the existing studies that use monthly or even annual data. Third, the convergence analysis employs the occupancy rate as the key influential factor that directly reflects consumers' demand and hotel revenues (Yeon et al., 2020) compared to most of the related studies that rely on prices and hotel revenues to quantify hotel performance.
Data description and methodological framework
Sample and variables
We utilize a sample of hotel occupancy rates (OCC) at a U.S. state level over the first pandemic wave period. The sample consists of a balanced daily panel dataset comprising 50 US states over a 9-month period starting from 01.12.2019 to 26.07.2020 yielding 11,950 observations (N = 50 and T = 239). The sample variable of this study is obtained by the Smith Travel Research (STR) hotel database which tracks global hotel supply and demand and is widely used by related studies (see for example Assaf et al., 2020; Assaf and Tsionas, 2018; Assaf et al., 2017; Hall and Parker, 2020). 1 The sample covers the first pandemic wave that hit the US states during the first months of 2020 until the end of the summer. The sample reports the average occupancy rate from all the available hotel categories (luxury, midscale, upper midscale, upper upscale, and upscale) per U.S. state.
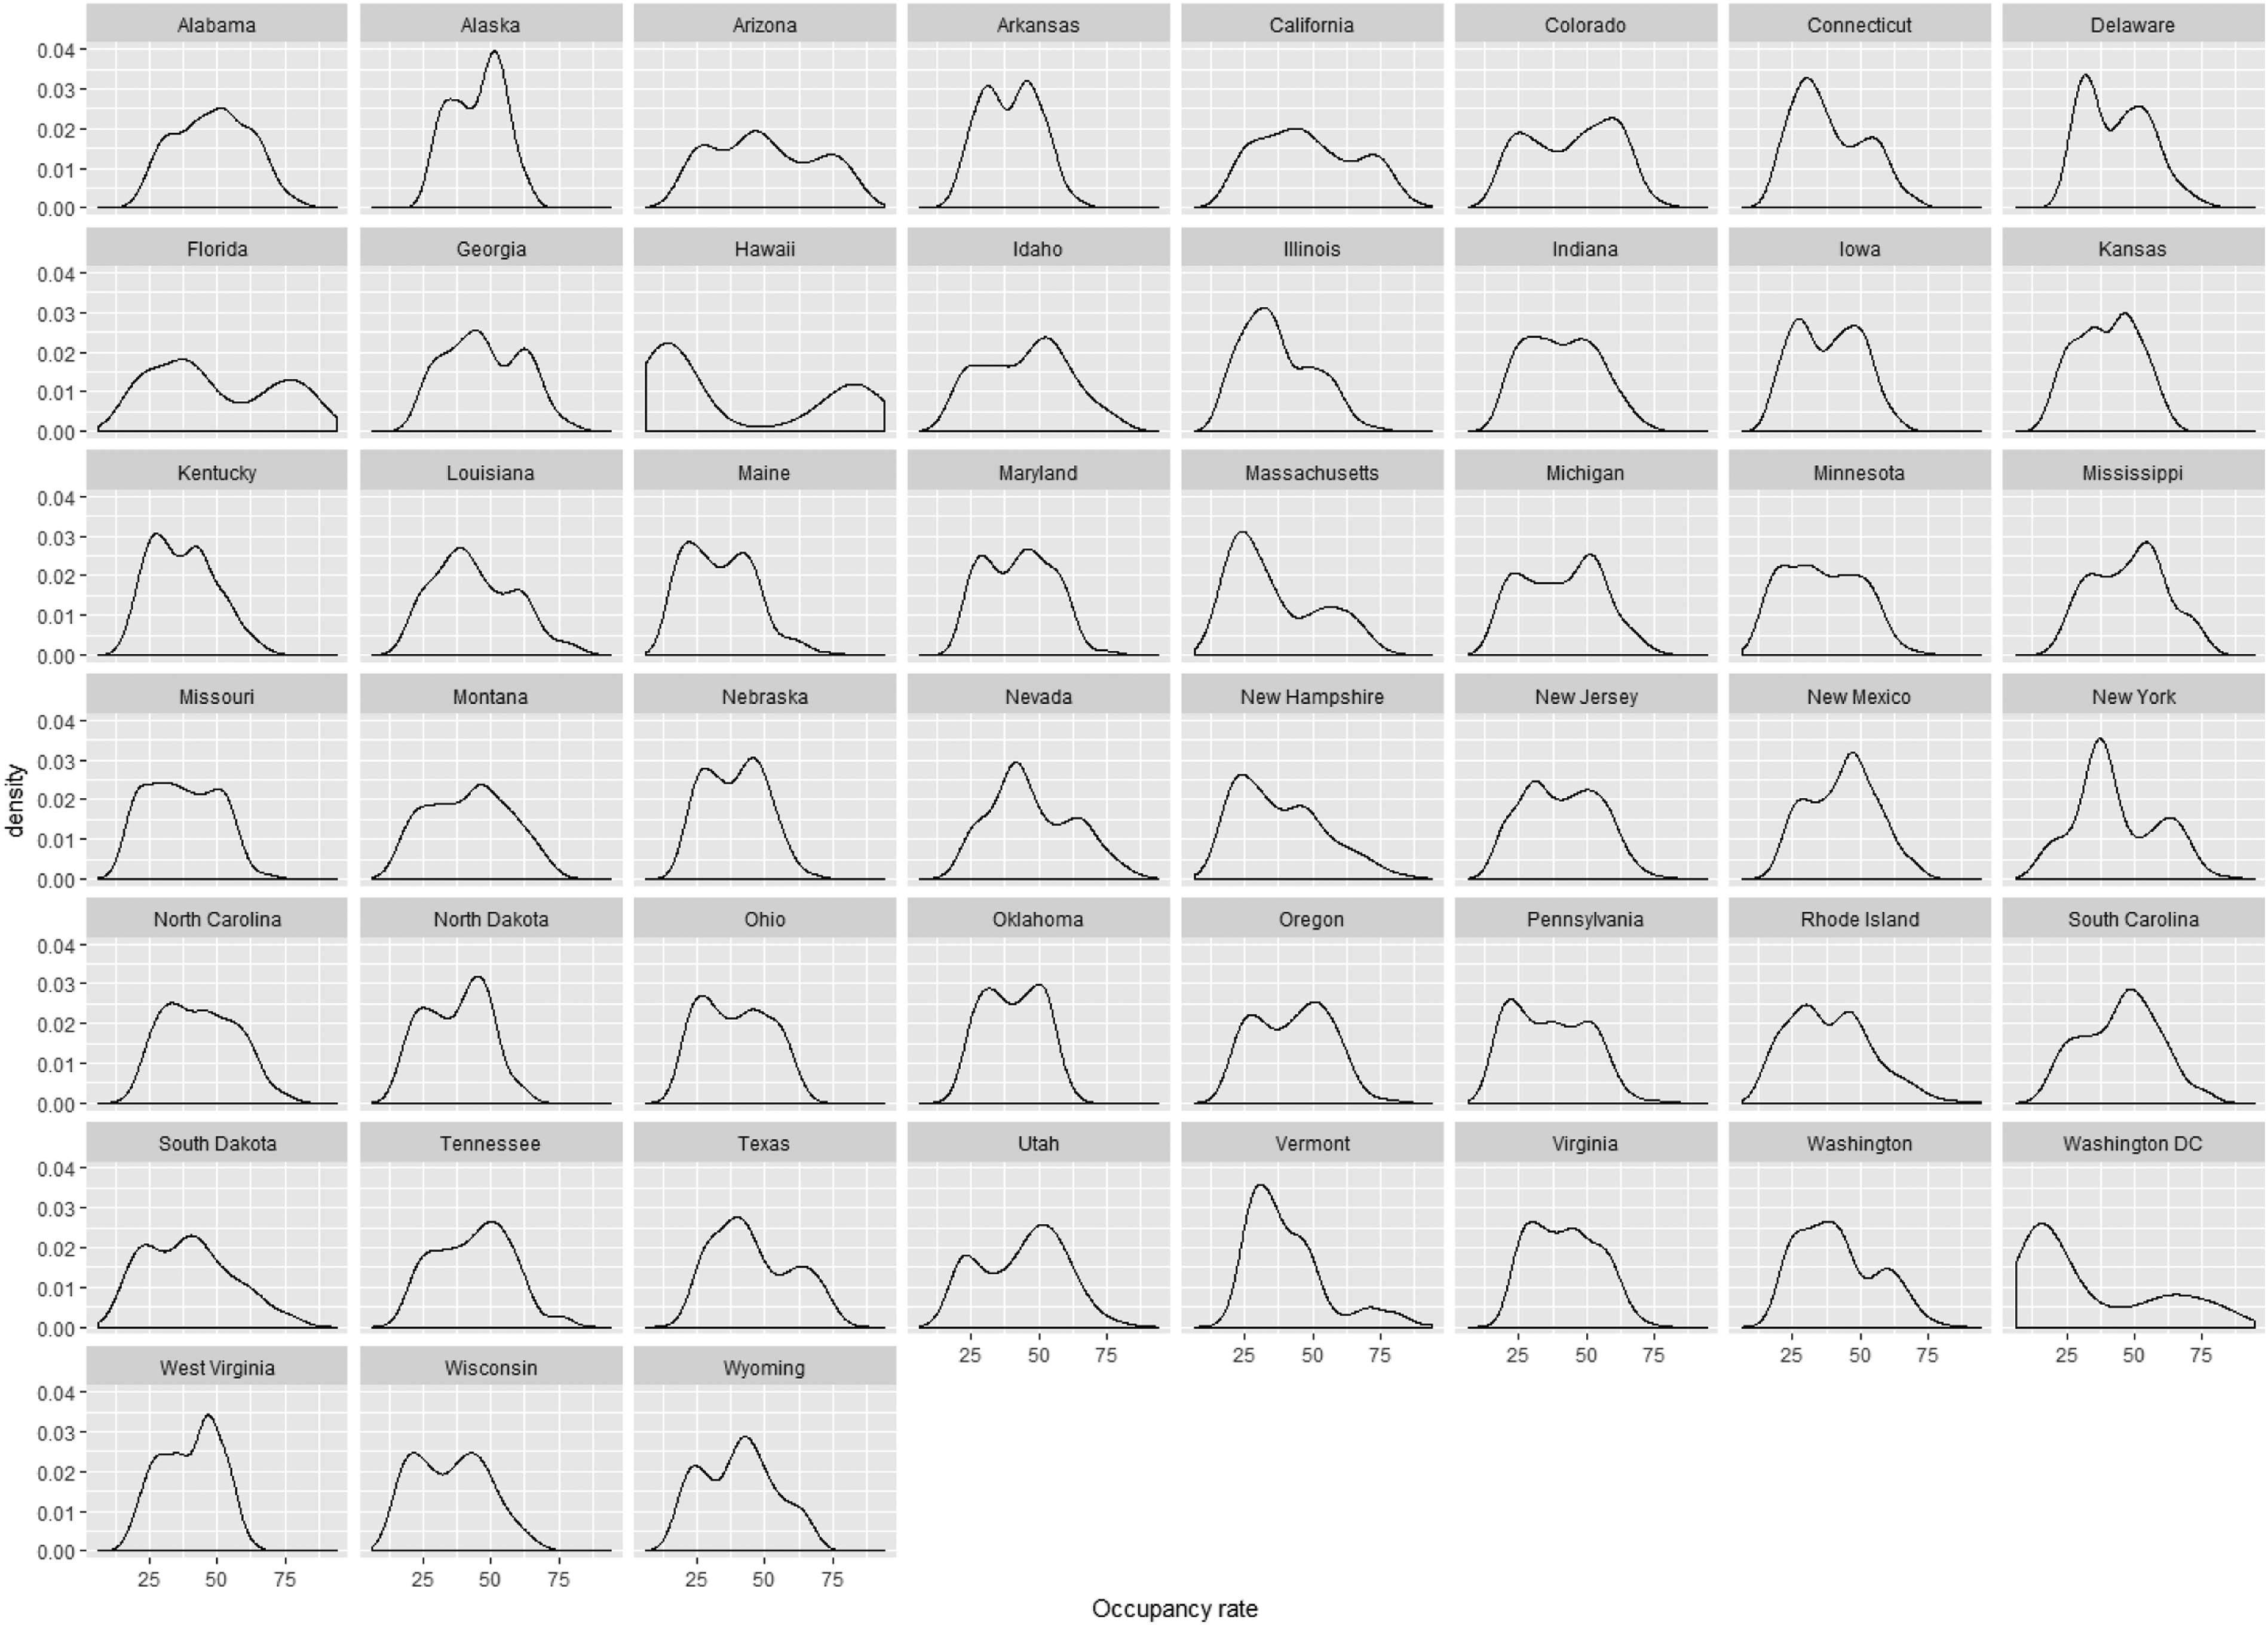
As it is evident, from the occupancy rates, there is a non-linear “N-shaped” curvature trend over the sample period in nearly all 50 US states (see Figure 1). This finding is mainly attributed to the dramatic changes in airline schedules and operations during March 2020 and April 2020. According to the Bureau of Transportation Statistics, there was a 96% annual passenger decline from April 2019 and a 51% decline from March 2019. However, a closer look at the density plots of the occupancy rates uncovers some differences between the US states (see Figure 2). Specifically, for some states (see, e.g.,, Alaska, Arkansas, Connecticut, Delaware, Illinois, Indiana, Idaho, Michigan, Mississippi, Oklahoma, Oregon, Tennessee, and West Virginia), a bi-modal distribution is revealed. On the contrary, a multi-modal distribution of the OCC density plots is traced for the following states: Alabama, Arizona, California, Massachusetts, New York, and North Dakota. Occupancy rate trends (%). Density plots of the occupancy rate.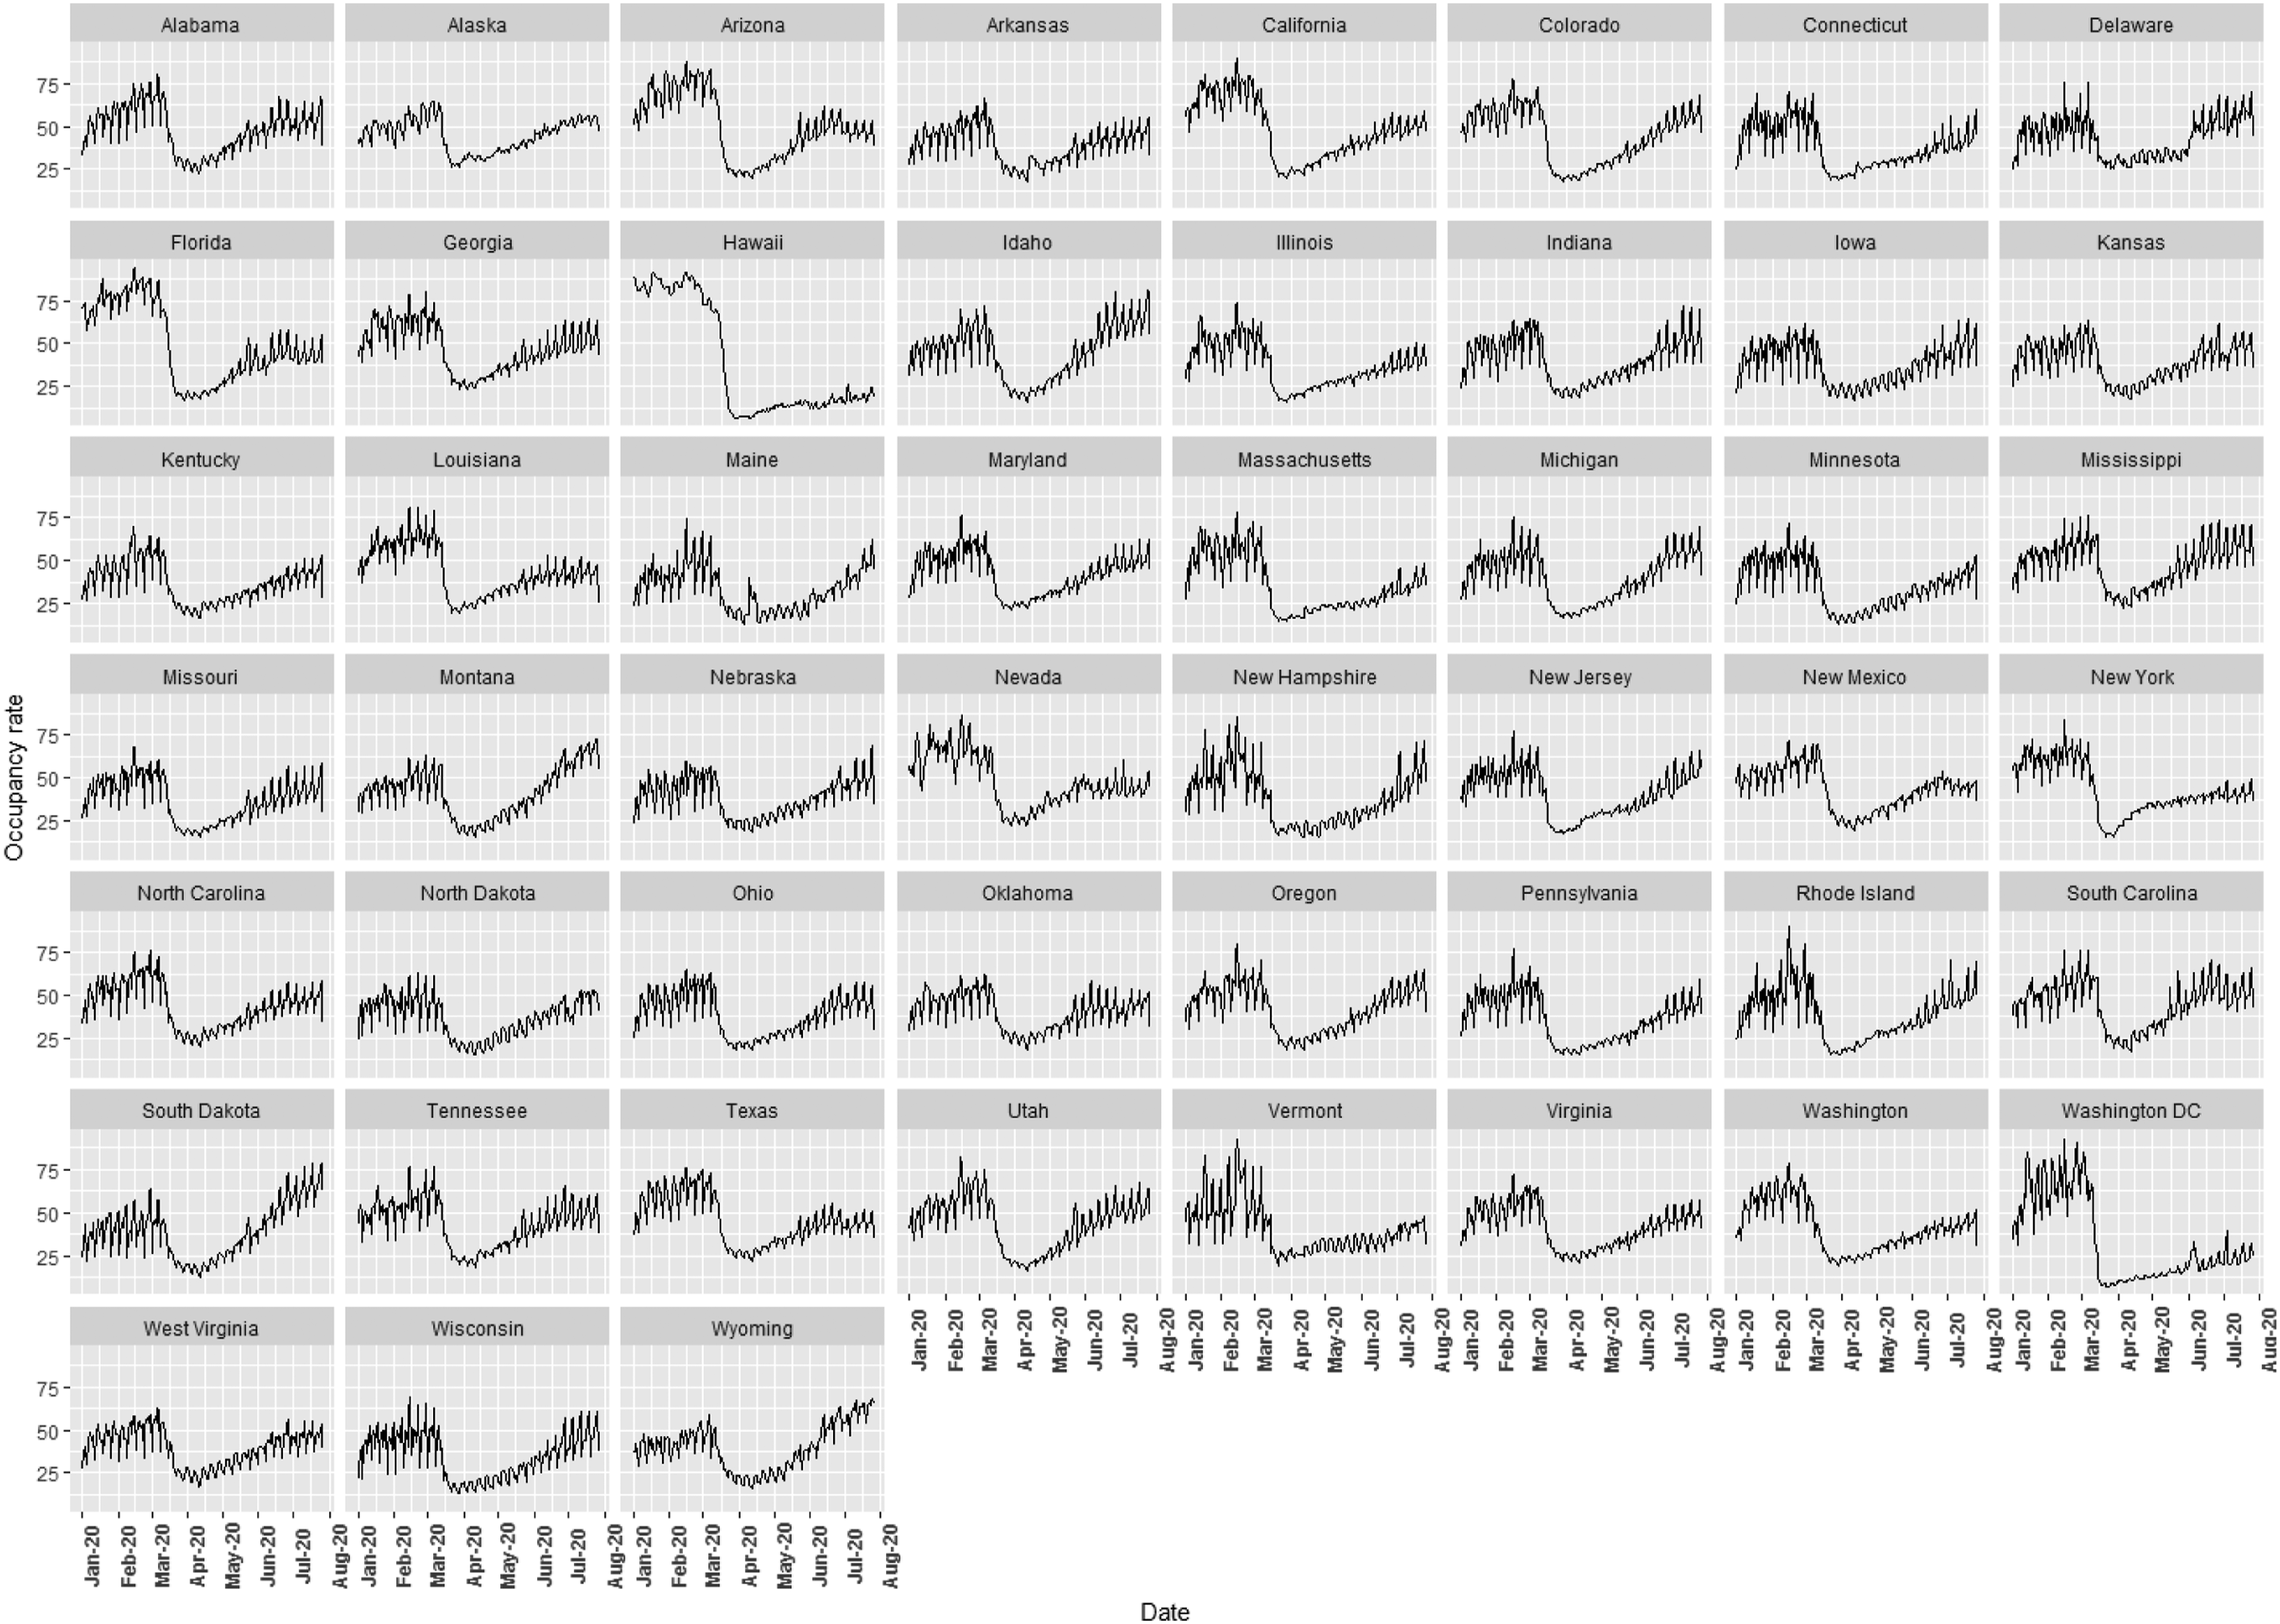
Methodology
To analyze the convergence rates of OCC at the US state level, we apply the Phillips and Sul (2007, 2009) methodology. The relevant analysis consists of two stages. First, we define a single factor model as


According to Phillips and Sul (2007), the transition coefficient can be expressed as


The
We can then define the cross-sectional variance ratio

Finally, the

In the regression below, we follow Phillips and Sul (2007), having
Results and discussion
Results from club convergence classification.
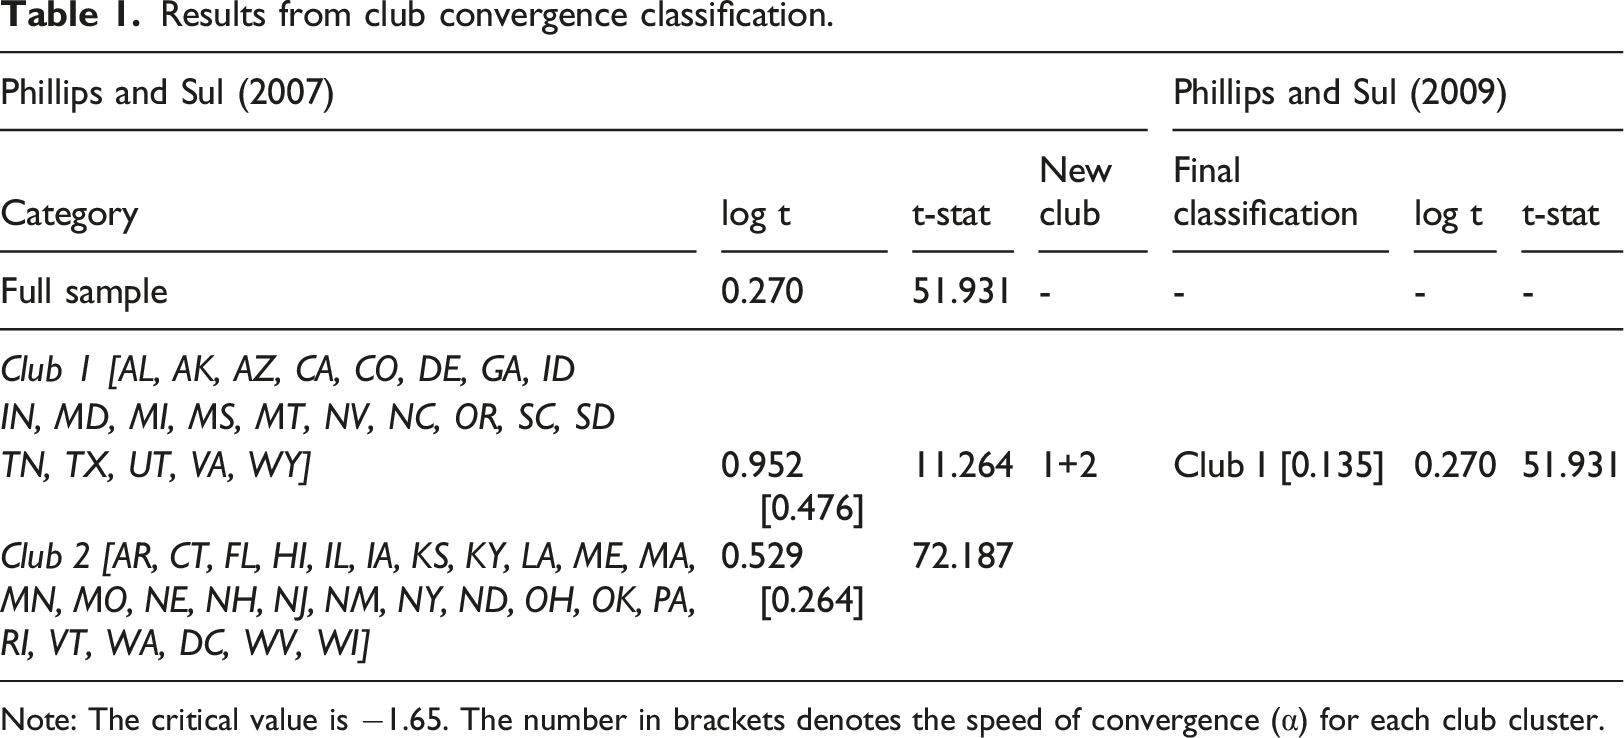
Note: The critical value is −1.65. The number in brackets denotes the speed of convergence (α) for each club cluster.
The results of the primary P-S algorithm do not indicate rejection of the null hypothesis (convergence) for the full sample since the estimated t-statistic (51.931) is greater than the critical value of −1.65. This implies the existence of full convergence for the whole sample. However, we must check for the existence of different club clusters since based on Phillips and Sul (2007, p. 1798) “[…] Examples include the possible existence of convergence clusters around separate points of equilibria or steady-state growth paths.” From our analysis, we have identified two convergence clubs. Specifically, Club one consists of Alabama, Arkansas, Arizona, California, Colorado, Denver, Georgia, Idaho, Indiana, Maryland, Michigan, Mississippi, Montana, Nevada, North Carolina, Oregon, South Carolina, South Dakota, Tennessee, Texas, Utah, Virginia, and Wyoming, while Club two includes the rest 28 US states. As in the case of the full sample, the P-S algorithm fails to reject the null hypothesis of convergence for the two initial formulated clubs since the estimated t-statistics are greater than the critical value.
Having delineated the primary convergence clubs based on P-S (2007) generic algorithm, the analysis proceeds with the interpretation of the speed of convergence (α) among the formulated clubs. 2 Our findings suggest that the speed of convergence is positive in both clusters, though its magnitude varies across the two formulated clusters. Specifically, the first club records an absolute value of α = 0.476, indicating a higher adjustment speed to convergence than the other club (α = 0.264). It is noteworthy that this value is almost two times greater than the one that appears in Club 2. This means that the 28 US states formulating Club 2 are approaching one another more slowly in relative terms compared to the rest US states, uncovering a different demand pattern.
Our findings when utilizing Phillips and Sul (2009) methodology uncover that we fail to reject the null hypothesis of convergence in two cases (Club 1 and Club 2), revealing that the two initial convergence clubs can be merged into one covering the full sample (50 US states). We notice that the newly formulated club (Club I) has a low estimated convergence speed equal to α = 0.135. This result is in alignment with our previous findings, unraveling a slow path to full convergence.
Finally, Figure 3 illustrates the transition path of the two identified convergence clubs under the assumption of the sample’s overall convergence to unity. The transition curves displayed reveal whether the identified clubs converge or diverge from below or above unity over the examined period. Our findings suggest that the transition path of Club one consisting of 22 states, exhibits a convergent behavior approaching cross-sectional average (unity) from above. On the contrary, the other club including the rest of 28 US states (Club 2) follows a different convergent pattern approaching cross-sectional average (unity) from below. From the shape of the relevant curvatures, it is evident that the transition paths confirm the convergence test results. Transition paths based on the P-S (2007) algorithm.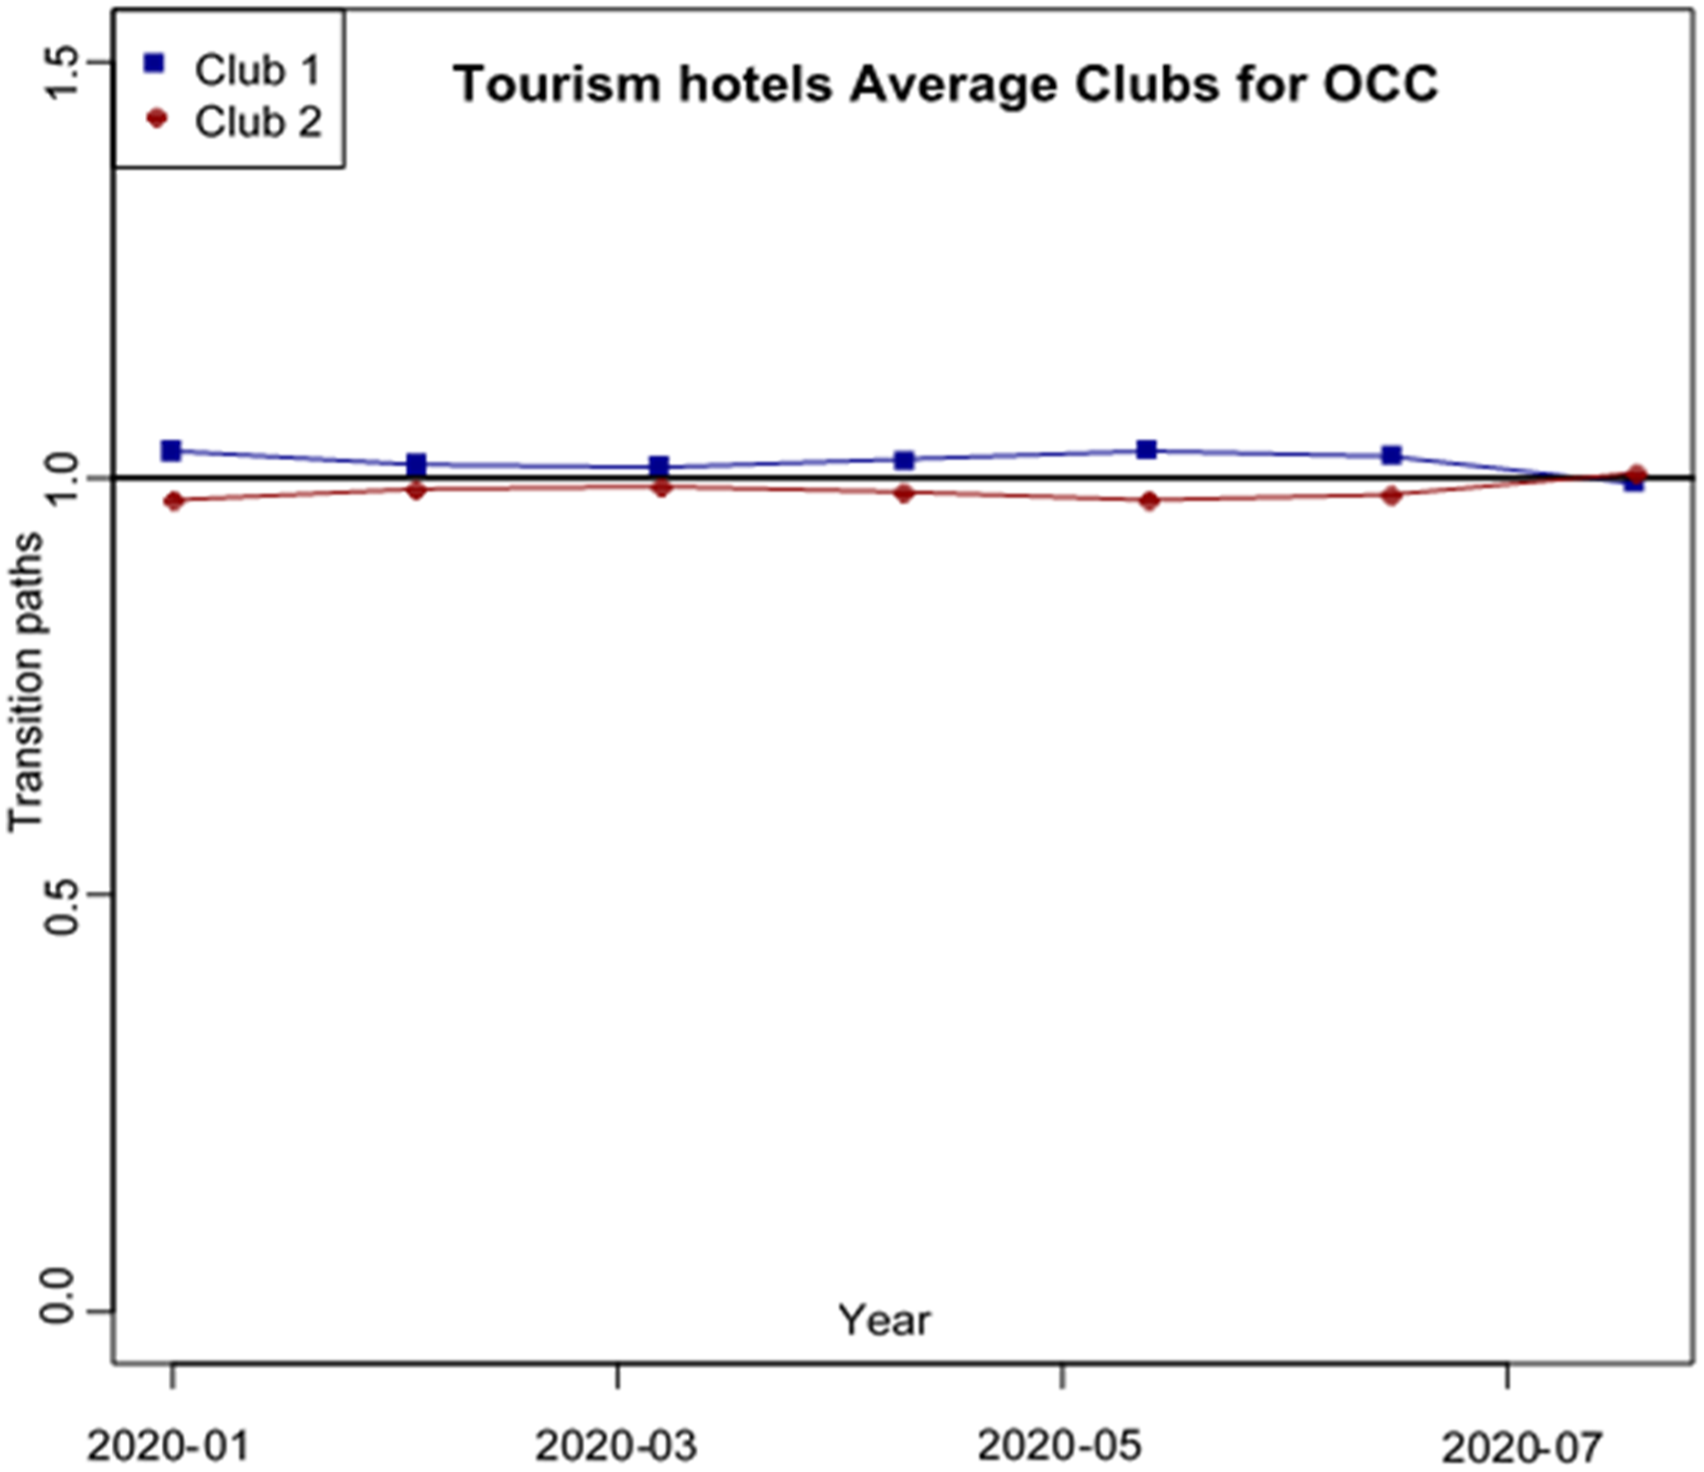
Conclusions
The present study applies the convergence methodological framework developed by Phillips and Sul (2007, 2009) to assess for the first time in the empirical literature the convergence patterns of occupancy rates in the 50 US states over the first pandemic wave. By utilizing daily data over the period December 2019 to July 2020, the empirical evidence suggests that the null hypothesis of full convergence for the whole sample cannot be rejected. Moreover, we have identified two initial convergence clubs with a relatively moderate convergence speed, alongside their transition paths that can be merged into one after the implementation of the Phillips and Sul (2009) methodology. The results clearly illustrate the existence of a convergence pattern in the hotel occupancy rates throughout the COVID-19 first wave.
The empirical findings unfold how different methodological approaches can be applied by policymakers and hoteliers to trace the different consumers’ demand patterns of the hotel industry and better fine-tune their policies/strategies. The existence of a fully convergent behavior approaching cross-sectional average (unity) for both initial clusters (Club one and Club 2) indicates that the first pandemic wave has eliminated any distinct (economic) characteristic between the different US states (natural beauty and destination characteristics, travel promotion, branding, state support, regional income, number of international arrivals, etc.) distorting to a large extent the performance of the US hotel industry. The results from the convergence analysis support the study by Plzáková and Smeral (2021) emphasizing the dramatic decrease in tourism demand due to containment measures. Plzáková and Smeral (2021) assert that restrictions in transportation and mobility, alongside the closure of hotels and restaurants can initiate in the post-pandemic period price increases or quality declines on tourism services. In addition, due to the economic crisis initiated by the pandemic and the containment measures, there is a strong possibility that the tourism industry will not be able to reach breakeven occupancy levels at pre-crisis prices. Such an outcome encompasses useful (horizontal) strategies to hoteliers and market participants to better adjust their services and facilities provided, considering the gradual reopening of the industry in the aftermath of the pandemic crisis. This in turn will provide the policymakers with the ability to target and respond more efficiently to the dynamic nature of the COVID-19.
One of the most vital managerial strategies that should be implemented to mitigate the negative impact of the COVID-19 pandemic crisis is not only to rely on the necessary infrastructure measures including inter alia cleaning, sanitizing, and air handling systems but to invest in more flexible technologies such as artificial intelligence, which will allow contactless processes and mobile hospitality. The future challenge for managers and policymakers of the tourism industry is the identification and the adjustment to the new segments of demand emerged by the COVID-19 crisis.
Footnotes
Acknowledgments
The authors would like to thank Professor Albert Assaf (the Editor) and an anonymous referee of this journal for fruitful comments and suggestions that enhanced the merit of the paper. All errors belong to the authors. The usual disclaimer applies.
Declaration of conflicting interests
The author(s) declared no potential conflicts of interest with respect to the research, authorship, and/or publication of this article.
Funding
The author(s) received no financial support for the research, authorship, and/or publication of this article.