




Abstract
To control the COVID-19 pandemic, various policies have been implemented to restrict the mobility of people. Such policies, however, have resulted in huge damages to many economic sectors, especially the tourism sector and its auxiliary services. Focusing on Cambodia, this study presents a system dynamics (SD) model for assessing and selecting effective policy responses to contain the spread of COVID-19, while maintaining tourism development. Policies targeted in this study include international and domestic transportation bans, quarantine policy, tourist-centered protection measures, and enterprise-led protection measures. Two types of scenario analyses are conducted: one targets each policy separately and the other combines different policies. Among all scenarios, quarantine policy is evaluated to be the most effective policy as it balances the containment of the spread of COVID-19 and support for tourism development. This study provides a new way of guiding COVID-19 policymaking and exploring effective policies in the context of tourism.
Highlights
• A system dynamics model is built to derive effective COVID-19 policy responses. • Policy scenarios balancing pandemic control and tourism development are designed. • Both single policies and packaged policies by different stakeholders are compared. • The early stages of the COVID-19 pandemic in Cambodia are targeted. • Quarantine policy should be implemented together with tourism protection measures.
Introduction
The COVID-19 pandemic has resulted in more than 242 million infections and more than 4.9 million deaths as of 19 October 2021. 1 The pandemic has resulted in tremendous damage to all economic sectors. Tourism industry is a key economic sector in many developing countries. For instance, in countries like Palau and the Maldives, more than 40% of the gross domestic product (GDP) is from international tourism revenues (Abiad et al., 2020). In Cambodia, the target country of this study, international tourism receipts constitute 26% of its total exports and 12% of GDP (WTTC, 2018).
The emergence or re-emergence of infectious diseases is strongly associated with global tourism and mobility (Richter, 2003). During the COVID-19 period, tourism also brought health risks to local people. To combat the current pandemic, most tourism-dependent developing countries have restricted human-to-human interactions, isolated those persons found to be infected, banned the use of public transportation, and closed borders with other countries. For instance, on 12 March 2020, Vietnam temporarily suspended its unilateral visa waiver for citizens of eight countries: Denmark, Norway, Finland, Spain, Sweden, the United Kingdom, Germany, and France. On 16 March 2020, Malaysia closed borders to all foreigners. Fiji introduced travel restrictions on all foreign nationals and banned international events on 17 March 2020. However, these restriction strategies have resulted in serious economic disruptions for the tourism sector and other related sectors. As indicated by Thomas (2020), the number of deaths caused by the economic disruption of long-lasting lockdowns may be greater than that avoided by COVID-19.
It is therefore important to quantify the infection risks and loss of tourism revenue to minimize the negative impacts of COVID-19-related policies on human health and well-being in developing countries with popular tourism destinations. As reviewed in the next section, previous studies investigated the relationships between epidemics and tourism, epidemics and transportation policy, as well as transport policy and tourism. However, little has been done to explore effective policy scenarios that can achieve a balance between the control of the COVID-19 pandemic and tourism development.
In this study, a system dynamics (SD) model will be developed, which consists of three subsystems that capture the relationships and feedbacks including disease transmission, transportation, and tourism. The following elements are simultaneously incorporated: relationships between the spread of COVID-19 and tourism, tourism activities and revenue, hospitality services, employment, international and domestic transport (volume, income, and investment), public health investment, protective measures by enterprises and tourists, economic measures by government, etc. The variables used in every subsystem are selected based on a comprehensive literature review. As a country which is highly dependent on tourism, Cambodia is the target country for this study. Policy scenarios are designed by focusing on the role and effectiveness of each policy independently and by incorporating effects of packaged policies, in terms of both controlling infection cases and maintaining tourism development, from a stakeholder perspective. Five single-policy scenarios are selected: international transportation bans, domestic transportation bans, quarantine policy, tourist-centered protection measures, and enterprise-led protection measures. These policies consider the efforts of three types of stakeholders, governments, tourists, and enterprises, in achieving a balance between economic development and control of the virus spread. This reflects the roles of key stakeholders in tourism development, as highlighted by Ritchie (2008). Several simulations are further conducted to support more effective COVID-19 policymaking.
The remaining part of this paper is organized as follows. First, a literature review is presented to better position this study in the literature. Second, the target country, Cambodia, is briefly introduced. Third, SD models are described and an SD model is built for this study. Fourth, data used in this study are presented. Fifth, the model test and simulation results are explained with respect to various scenarios, which are used to derive effective policy packages which can balance the control of virus spread and tourism development. Finally, this study concludes with a summary of major findings, policy implications and future challenges.
Literature review
The impacts of the COVID-19 pandemic
On 23 January 2020, Wuhan became the first city in China to be locked down, and by 27 January 2020, all cities in China were locked down. Because of such strict measures, infection cases dropped quickly in China and the confirmed infection cases reached almost zero by the first week of March. However, the massive movement of people across the world led to the COVID-19 pandemic (Anzai et al., 2020; Boto-García and Leoni, 2021; Chinazzi et al., 2020), as declared by the World Health Organization (WHO) on 11 March 2020. Sao Paulo and Rio de Janeiro were locked down in the earlier stages of the pandemic in Brazil, which initially resulted in fewer deaths in Brazil than in other countries, such as Italy, Spain, and the United Kingdom; however, the waves of COVID-19 which followed led to an explosion of infections (Nadanovsky and Santos, 2020).
The global pandemic has had severe impacts on global economic growth and tourism (United Nations, 2020a). Many countries have observed a decline in both GDP and employment, further reducing production and exports/imports as well as household income (Maliszewska et al., 2020). One of the biggest negative shocks was the sharp downturn in tourism services affected by the pandemic (Maliszewska et al., 2020). The consequence of social distancing as well as the increase in tourism tax caused by changes in trade costs led to lower demand for global travel. The fear of being infected during travel or group gatherings and the uncertainty accompanying the COVID-19 pandemic also heavily hit global tourism flows (Bilsland et al., 2020). According to Gossling et al. (2020), international travel bans restricted over 90% of global travel. This resulted in a decline in tourism as well as related services and supplementary industries, the closure of restaurants, cafés and hotels, and the cancellation of hotels and flights. According to the UNWTO, 2 tourism has been seriously impacted by the COVID-19 pandemic. Globally, international tourist arrivals were reduced by 91%–97% in April-June 2020, and since July 2020, international arrivals were still 14%–21% of the 2019 level at the end of 2021, suggesting a very gradual recovery. For 2021, international arrivals between January and May were 12%–18% of the 2019 level.
According to a report by the United Nations (2020b), the number of confirmed cumulative cases per capita is much lower in developing countries, especially least developed countries, than in other countries (although this varies greatly across countries). However, the economic damage has been enormous: for example, globally, international tourist arrivals dropped by more than 80% between April and December 2020, while international tourist arrivals in Cambodia, the target country in this study, declined by 95%–99%. Europe suffered a similar decline of 95%–97% in April–May 2020, while the decline percentage decreased to 65%–88% between June and December 2020. The above UN report attributed the lower cases per capita in part to the strict measures taken to restrict entry in the least developed countries.
Pandemic-control policies in the context of tourism
In addition to the aforementioned lockdown, common pandemic-control policies include border closures, international/domestic travel bans and restrictions, quarantine via entry screening, self-isolation, prohibition of large-scale gatherings, keeping social distance, hand washing, and use of face masks (Jazeera, 2020; WHO, 2020). Nadanovsky and Santos (2020) emphasized the importance of identifying infected persons and their social contacts through tests and confirmed the necessity of quarantine for two to 3 weeks. Restricting human-to-human interactions and limiting susceptible exposure were mentioned by Xiao and Torok (2020). The roles and responsibilities of different actors are important for controlling the pandemic (Zhang et al., 2020). The actions of governments, NGOs, and private companies are critical during this period (Pak et al., 2020). Zhang (2020) proposed a PASS approach (Prepare-protect-provide, Avoid-adjust, Shift-share, Substitute-stop) as a policymaking framework to guide the transport and related sectors in the battle against COVID-19. This approach argues that various stakeholders have different but connected roles.
Other policies were implemented to address the possible labor shortage caused by mobility restrictions (Sy et al., 2020). For example, teleworking can assure the social distance requirement and business continuity during the epidemic (Martin, 2020) but is also sometimes problematic (e.g., work–family conflict, stress, loneliness, burnout, turnover intentions, ineffective communication, procrastination, and lower job satisfaction) (Kaduk et al., 2019; Wang et al., 2021). It still seems difficult to say that telework will be an appropriate solution to the issues faced by the tourism industry, as the guest–host interaction is an important component affecting tourists’ experience and satisfaction (Chen et al., 2020; Harkison, 2017).
Financial support policies
The preventive behaviors of individuals and the transmission control policies of governments result in significant economic costs (Brahmbhatt and Arindam, 2008). Financial support is required for polymerase chain reaction (PCR) tests, quarantine, face masks, alcohol sanitizers, thermometers, and support for small businesses. For instance, on 19 March 2020, the government of South Korea provided a USD 39 billion financial package for emergency financing for small-sized enterprises, loan guarantees, and other stimulus measures (KPMG, 2020). By 20 April 2020, the Japanese government had announced JPY 11.7 billion to support the production of respirators and masks, etc. (excluding a JPY 23.3 billion bill to distribute fabric masks to all households) and JPY 149 billion for urgent comprehensive grants (Statista, 2020). In addition, many developed countries had to finance COVID-19-related activities in their own countries, leading to a shortage of relief funds for developing countries, especially those in Africa (Ataguba, 2020). There are around 1.5 billion tourists traveling internationally each year; such tourists are believed to have been a key factor in the spread of the COVID-19 virus (Iaquinto, 2020; Qiu et al., 2020). This points to the need to minimize tourism’s negative impacts on the spread of the virus. At the same time, the economic impacts of COVID-19 on tourism should also be addressed in the fight against COVID-19. In this regard, the World Travel and Tourism Council (WTTC) emphasizes the importance of the following three types of policies: protecting the livelihoods of workers, fiscal support, and injecting liquidity and cash. 3 UNTWO further summarized fiscal and monetary measures, measures of enhancing employment opportunities and skills training, intelligent marketing measures, governance via public-private partnerships, tourism resumption measures, and measures of promoting domestic tourism. 4
Modeling research on tourism and pandemics
Christidis and Christodoulou (2020) estimated the ratio of infected passengers to total passengers in the context of air transport. However, their approach cannot be applied after countries implemented travel bans. Karabulut et al. (2020) regressed country-level tourist arrivals on the World Pandemic Uncertainty Index, GDP, ratio of sum of exports and imports to GDP, and domestic currency per US dollar, by using a panel data from 129 countries for the period of 1996–2018 based on a single-equation fixed-effect tourism demand model. Single-equation models can also be found with respect to infection-related analyses, such as social contacts (Jahedi and Yorke, 2020), capability of public health system in reducing the morbidity and mortality of COVID-19 (Moss et al., 2020), efficiency of lockdown policy and social distancing interventions (Mate et al., 2020; Silva et al., 2020), and future requirement of hospitalization (Fox et al., 2020). Single-equation models cannot be used to capture multiple relationships involved in the tourism-pandemics dynamics.
McKibbin and Fernando (2021) integrated a dynamic stochastic general equilibrium model and a computable general equilibrium model to examine the impacts of different epidemiological scenarios, in terms of attack rate, case-fatality rate and mortality rate for China, on macroeconomic outcomes and financial markets. Their study showed that more investments should be made in public health systems, especially in least developed countries. However, this hybrid model does not incorporate tourism decision-making mechanisms. Moreover, the above models cannot incorporate the spread of COVID-19, tourism, and transportation as well as various relevant policies, within a unified modeling framework.
Considering the complicated and uncertain relationships between the COVID-19 pandemic, tourism, transportation, and other related elements, this study applies the popular system dynamics (SD) approach, which can visualize and examine complex dynamic feedback systems with an improved representation of fundamental system behavior and structure (Perk and Wolstenholme, 1990). Several scholars have applied it to simulate policy development during the COVID-19 pandemic. Saadat et al. (2020) simulated the effects of seasonality, contact density, intensive care unit (ICU) bed availability and lockdown measures for infection cases in Pakistan. Sy et al. (2020) evaluated the policy development for COVID-19 responses by addressing causalities existing in the spread of COVID-19, individual human behavior, healthcare capacity, pandemic-control policies, and economic pressure.
However, no study can be found on developing countries with a high dependence on tourism from the perspective of balancing the control of the spread of the virus and tourism development. After reviewing the roles of modeling in COVID-19 policy development, McBryde et al. (2020) first observed that more and more researchers are interested in modeling from a policymaking perspective. They then pointed out that modeling efforts have been mainly applied to high-income countries and that more modeling research should be conducted to assist policy decisions in low- and middle-income countries. This also confirms the originality and significance of the current study.
Study area
This study focuses on Cambodia because of the following considerations. First, Cambodia is highly dependent on tourism, which accounts for 32.7% of the GDP in 2019 (increased from 14.9% in 2000).
5
It is estimated that 26% of the population is working in the tourism sector.
6
Second, data available in Cambodia is feasible to run the developed SD model. Third, the impacts of COVID-19 on tourism in Cambodia are serious, with international tourist arrivals in 2020 reaching only 20% of that in 2019 (Figure 1).
7
Fourth, at the time of modeling analysis, there were very limited infections (only 119 cumulative cases on 9 April 2020,
8
which is the end time point of the empirical data used in this study). Such a relatively low rate of infections can help check the sensitivity and usefulness of the SD model to represent actual situations and simulate future situations. In other words, if the developed SD model is applicable to Cambodia, it is expected to be more applicable to other countries with more infections. Temporal changes in international tourist arrivals in Cambodia.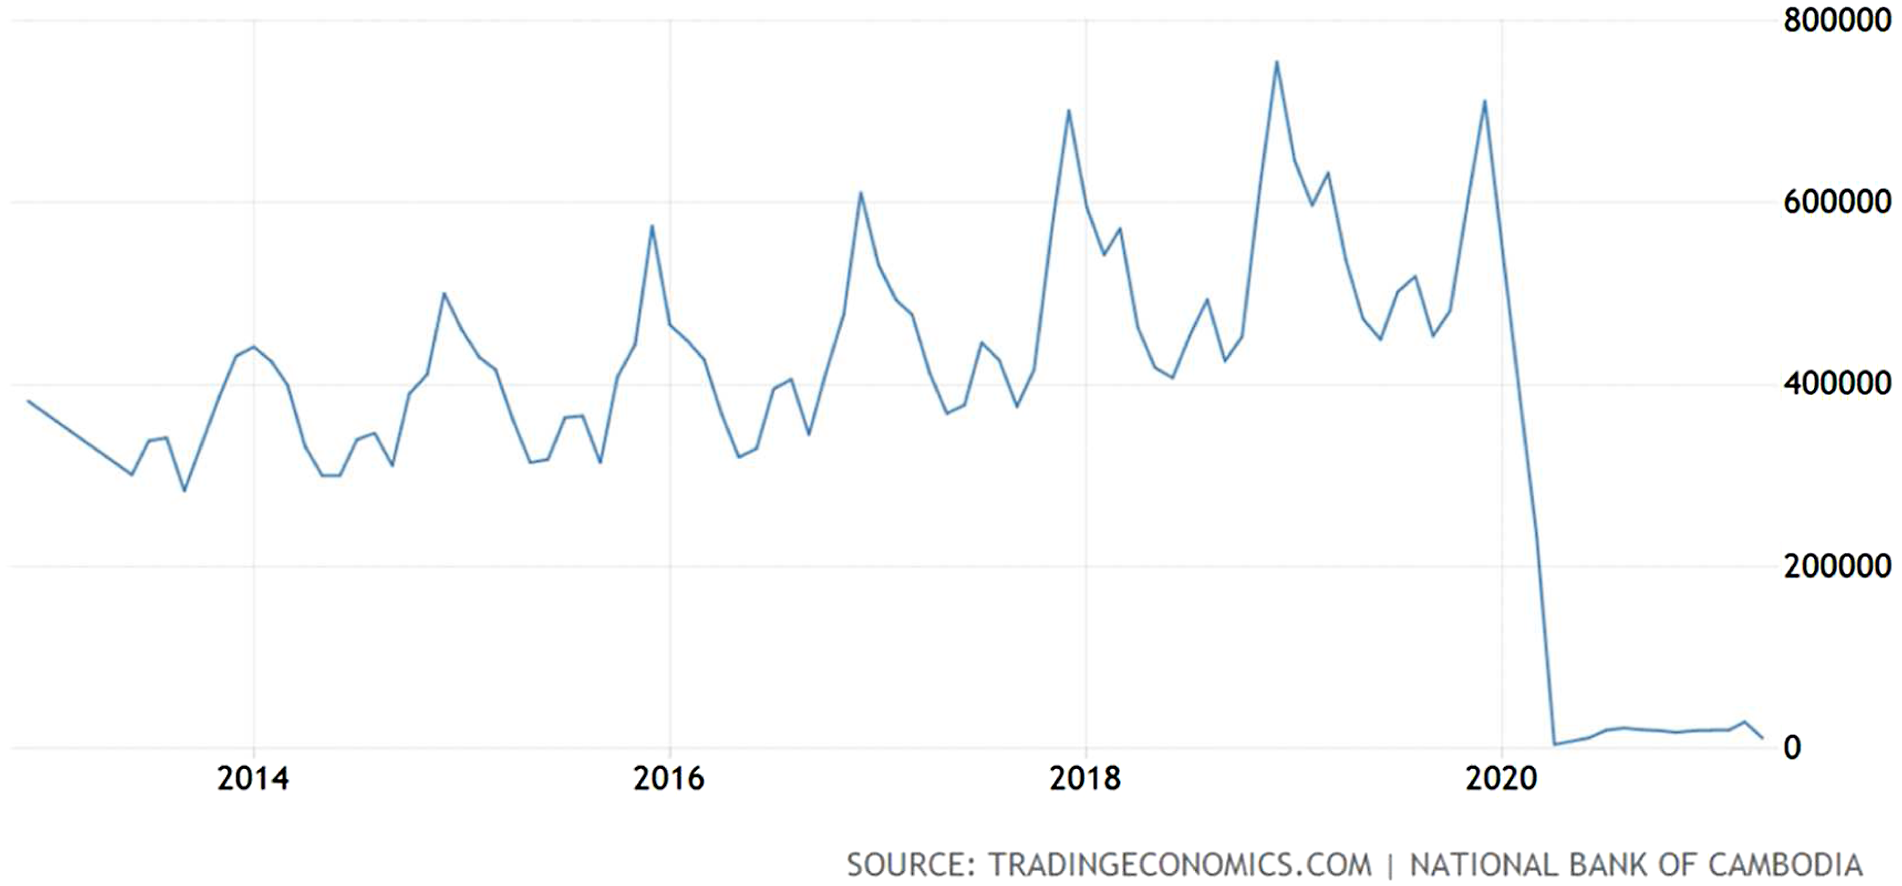
The first case of COVID-19 was diagnosed on 27 January 2020. Soon after this date, Cambodia migrants were required to self-quarantine until 22 March 2020. From March 30, the issuance of tourist and entry visas was stopped and travelers with valid visas were allowed to enter with proof of a negative PCR test. From April 3, mass gatherings were prohibited. On April 9–16, travel was banned between districts and across provinces. Figure 2 illustrates the cumulative infection cases and daily new confirmed cases from January 27 to mid-April 2020 in Cambodia, together with main policies related to tourism and transportation. Infections and main national policies regarding tourism and transportation in Cambodia from the time the first case appeared to the end of the study period.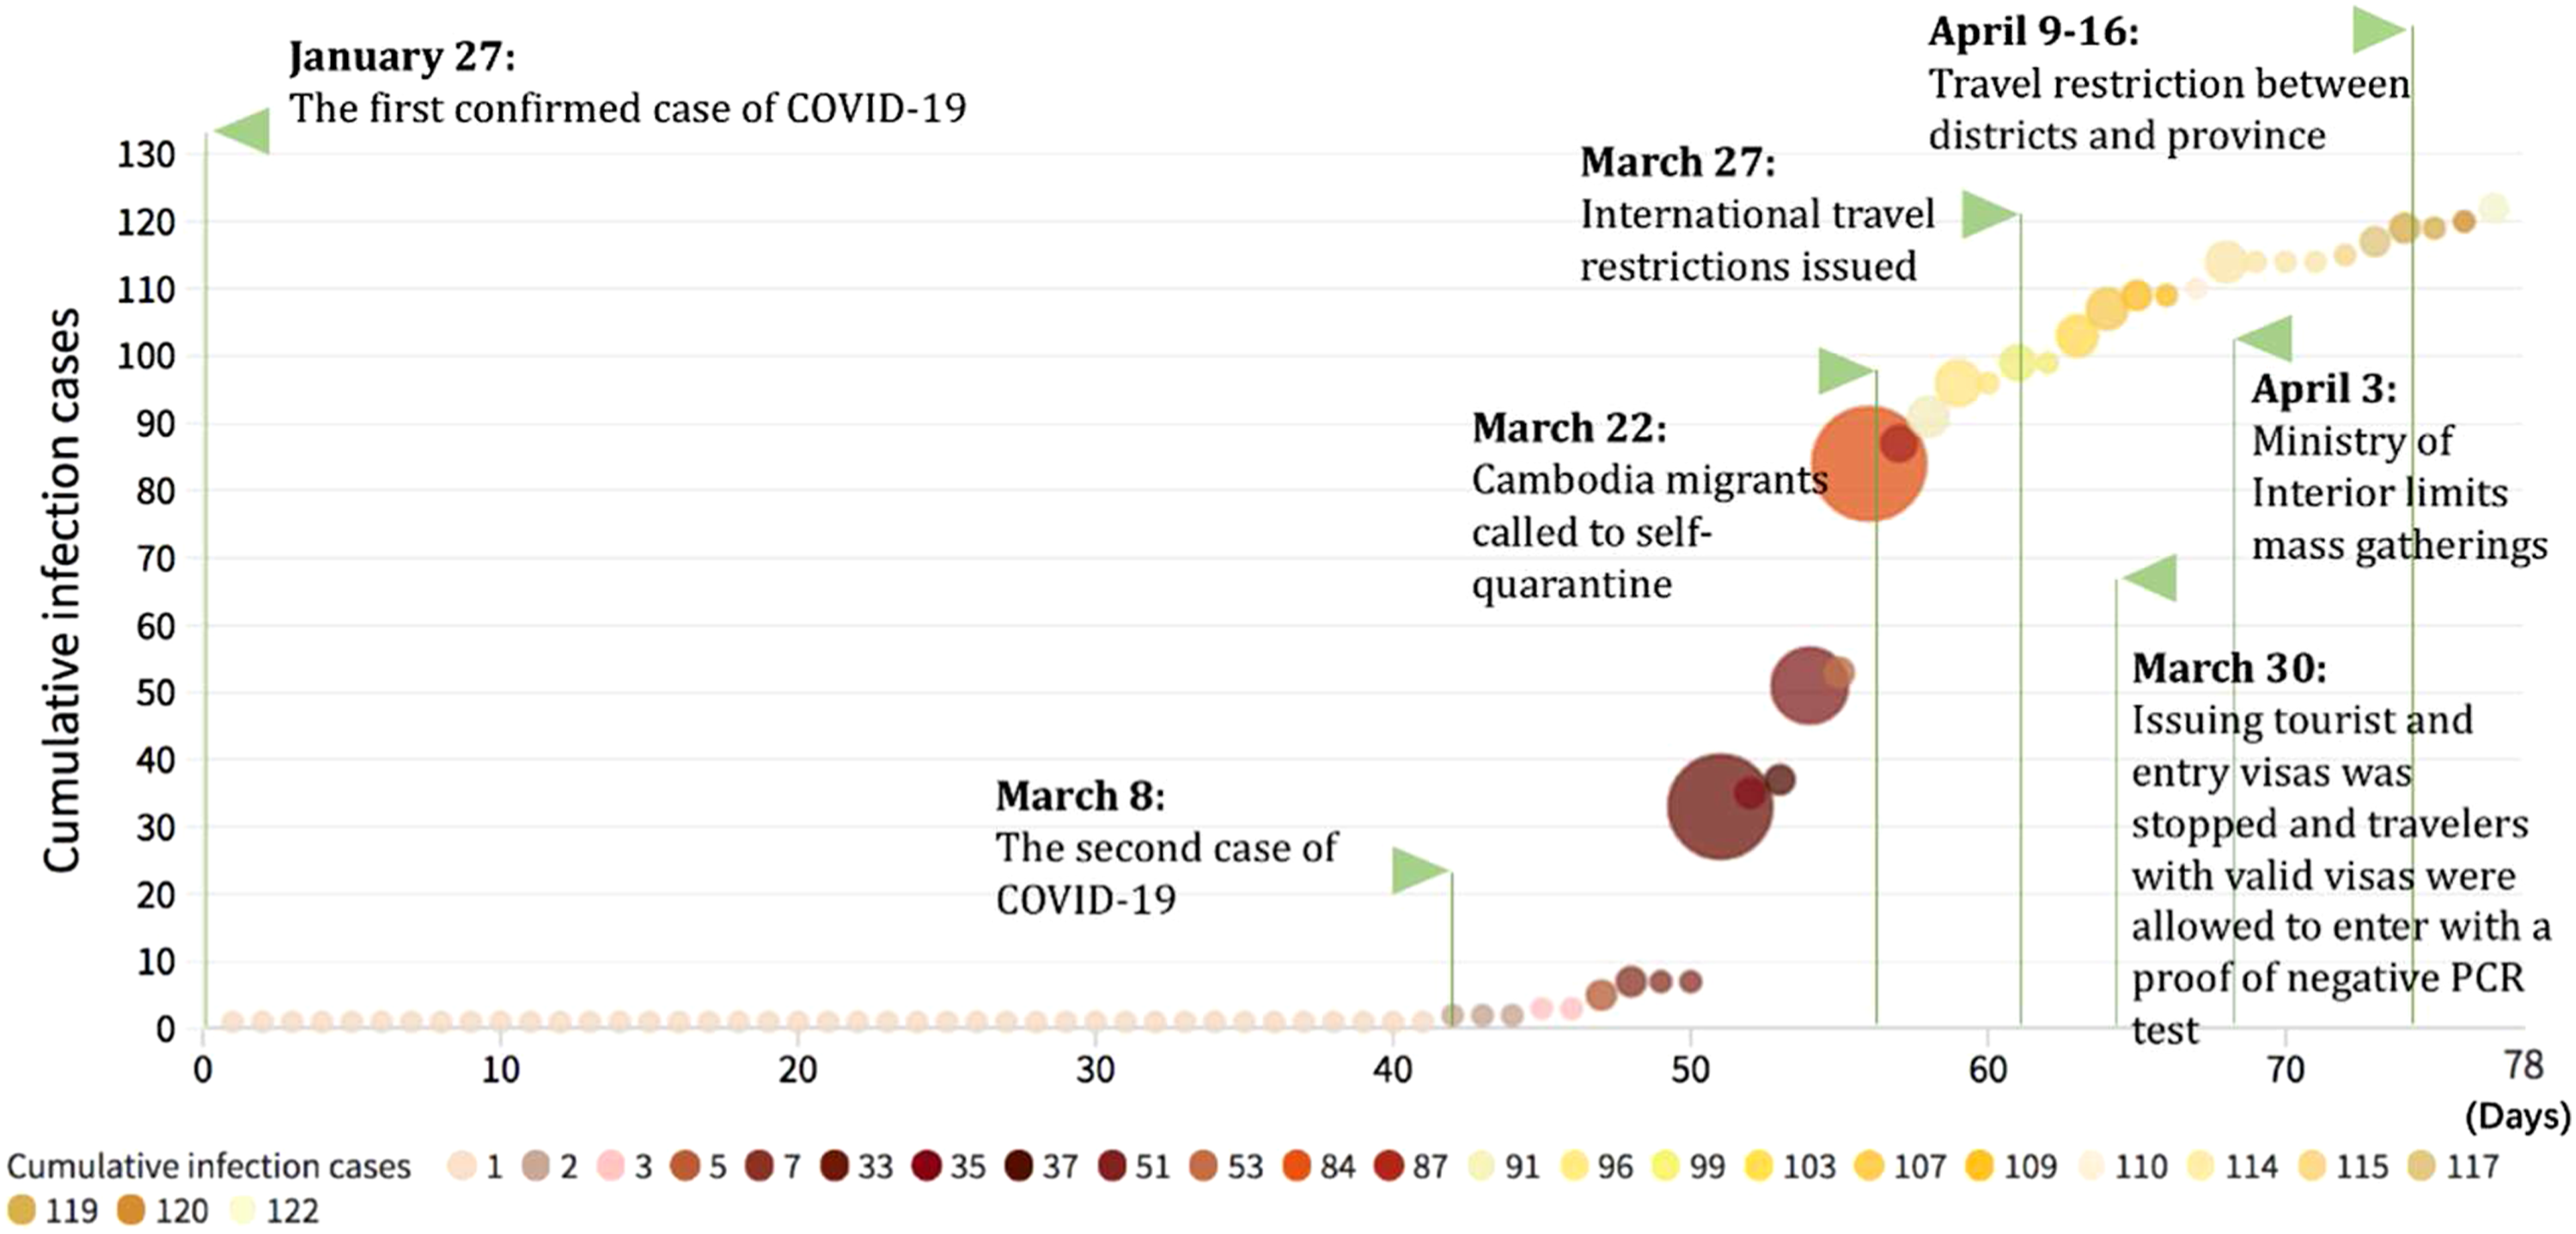
Developing a system dynamics (SD) model
SD models (Perk and Wolstenholme, 1990) are particularly suitable for understanding complex systems via comprehensive and quantitative simulations allowing more robust and reliable outcomes (Wolstenholme, 2005). Different from other models, the SD used in this research can better address the following issues. First, there are many factors that influence the spread of COVID-19, where complicated influencing mechanisms may be involved. For this issue, causal loop diagrams can be used to accommodate a variety of causalities related to COVID-19 transmission, transportation, and tourism. Second, the above causalities are highly nonlinear and further connected with many policies, making the modeling tasks difficult. SD models can dynamically simulate a complex nonlinear system associated with various policies. It is also very flexible for conducting policymaking scenario analyses.
SD modeling boundaries and hypotheses
This study targets Cambodia, which has an economy highly reliant on tourism. Before implementing scenario analyses, modeling boundaries should be better determined and hypotheses should be made reasonable. To simulate policymaking scenarios, we studied a total of 37 days between March 6 (2 days before the second case of COVID-19 was confirmed in Cambodia) and April 11 (2 days after the central government first restricted travel between districts and provinces). The first 2 weeks between March 6 and March 19 are used to do model testing.
Due to the lack of available data regarding various factors, the following assumptions are made in this study. First, the total number of people using domestic transportation only reflects tourists and people employed by the tourism sector; it does not include the total population of local residents. Second, tourist activities mainly comprise two parts: (1) shopping, catering, and entertainment activities and (2) using domestic transportation. Third, it is assumed that there are no false negatives of tests for infection.
Causal loop diagram and stock flow diagram
The symbols identified in the causal feedback loops in this study are illustrated in Figure 3. These causal feedback loops consist of several variables which close back on themselves, with the arrows reflecting the direction of causation. Figure 3 shows the important attributes affecting the policy simulation. These attributes are: the number of international flights; total population of domestic transportation; number of tourists; shopping, catering, and entertainment activities; exposure; tourist activities in the fight against COVID-19; tourism income; employed population; enterprise investment on virus prevention; government investment in medical sector; government subsidy for virus prevention; government investment in virus prevention; transmission rate; quarantine policy; rehabilitation; number of infection cases; international transportation bans; and domestic transportation bans. Causal feedback loops in the SD model.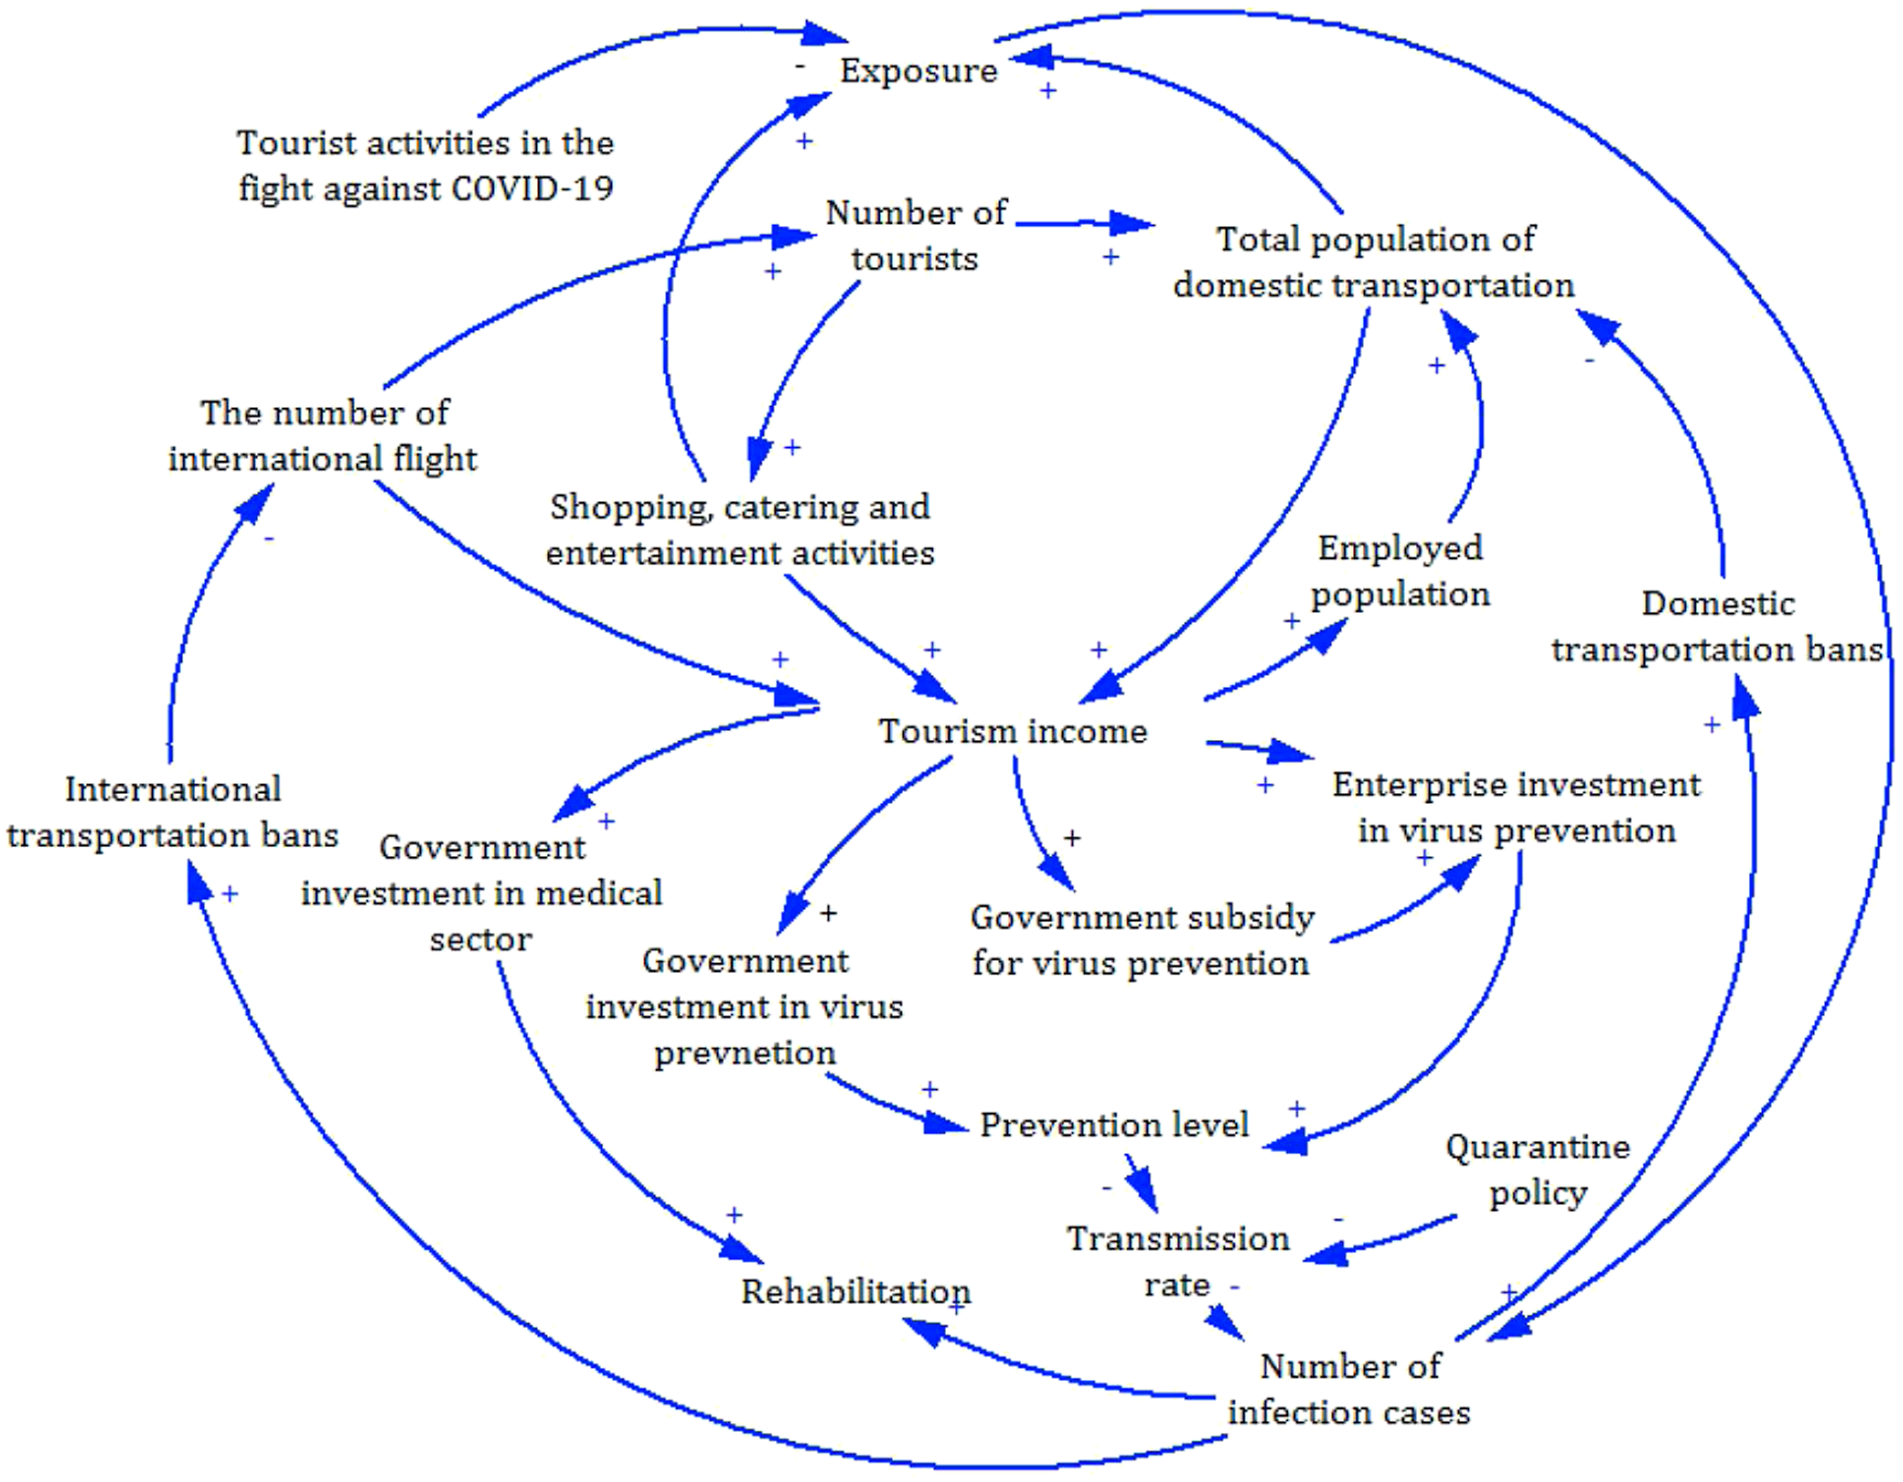
The SD model includes a few feedback loops communicating with each other through the tourists. More specifically, when the number of international flights goes up, it brings more tourists. The increase in tourists increases the total population of domestic transportation and shopping, catering, and entertainment activities. As the total population of domestic transportation and the shopping, catering, and entertainment activities go up, the exposure increases; then the number of infection cases also increases significantly. Increasing infection cases lead to increasing international transportation bans; then the number of international flights go down (Figure 4(a)). Seven typical feedback loops of the system dynamics model.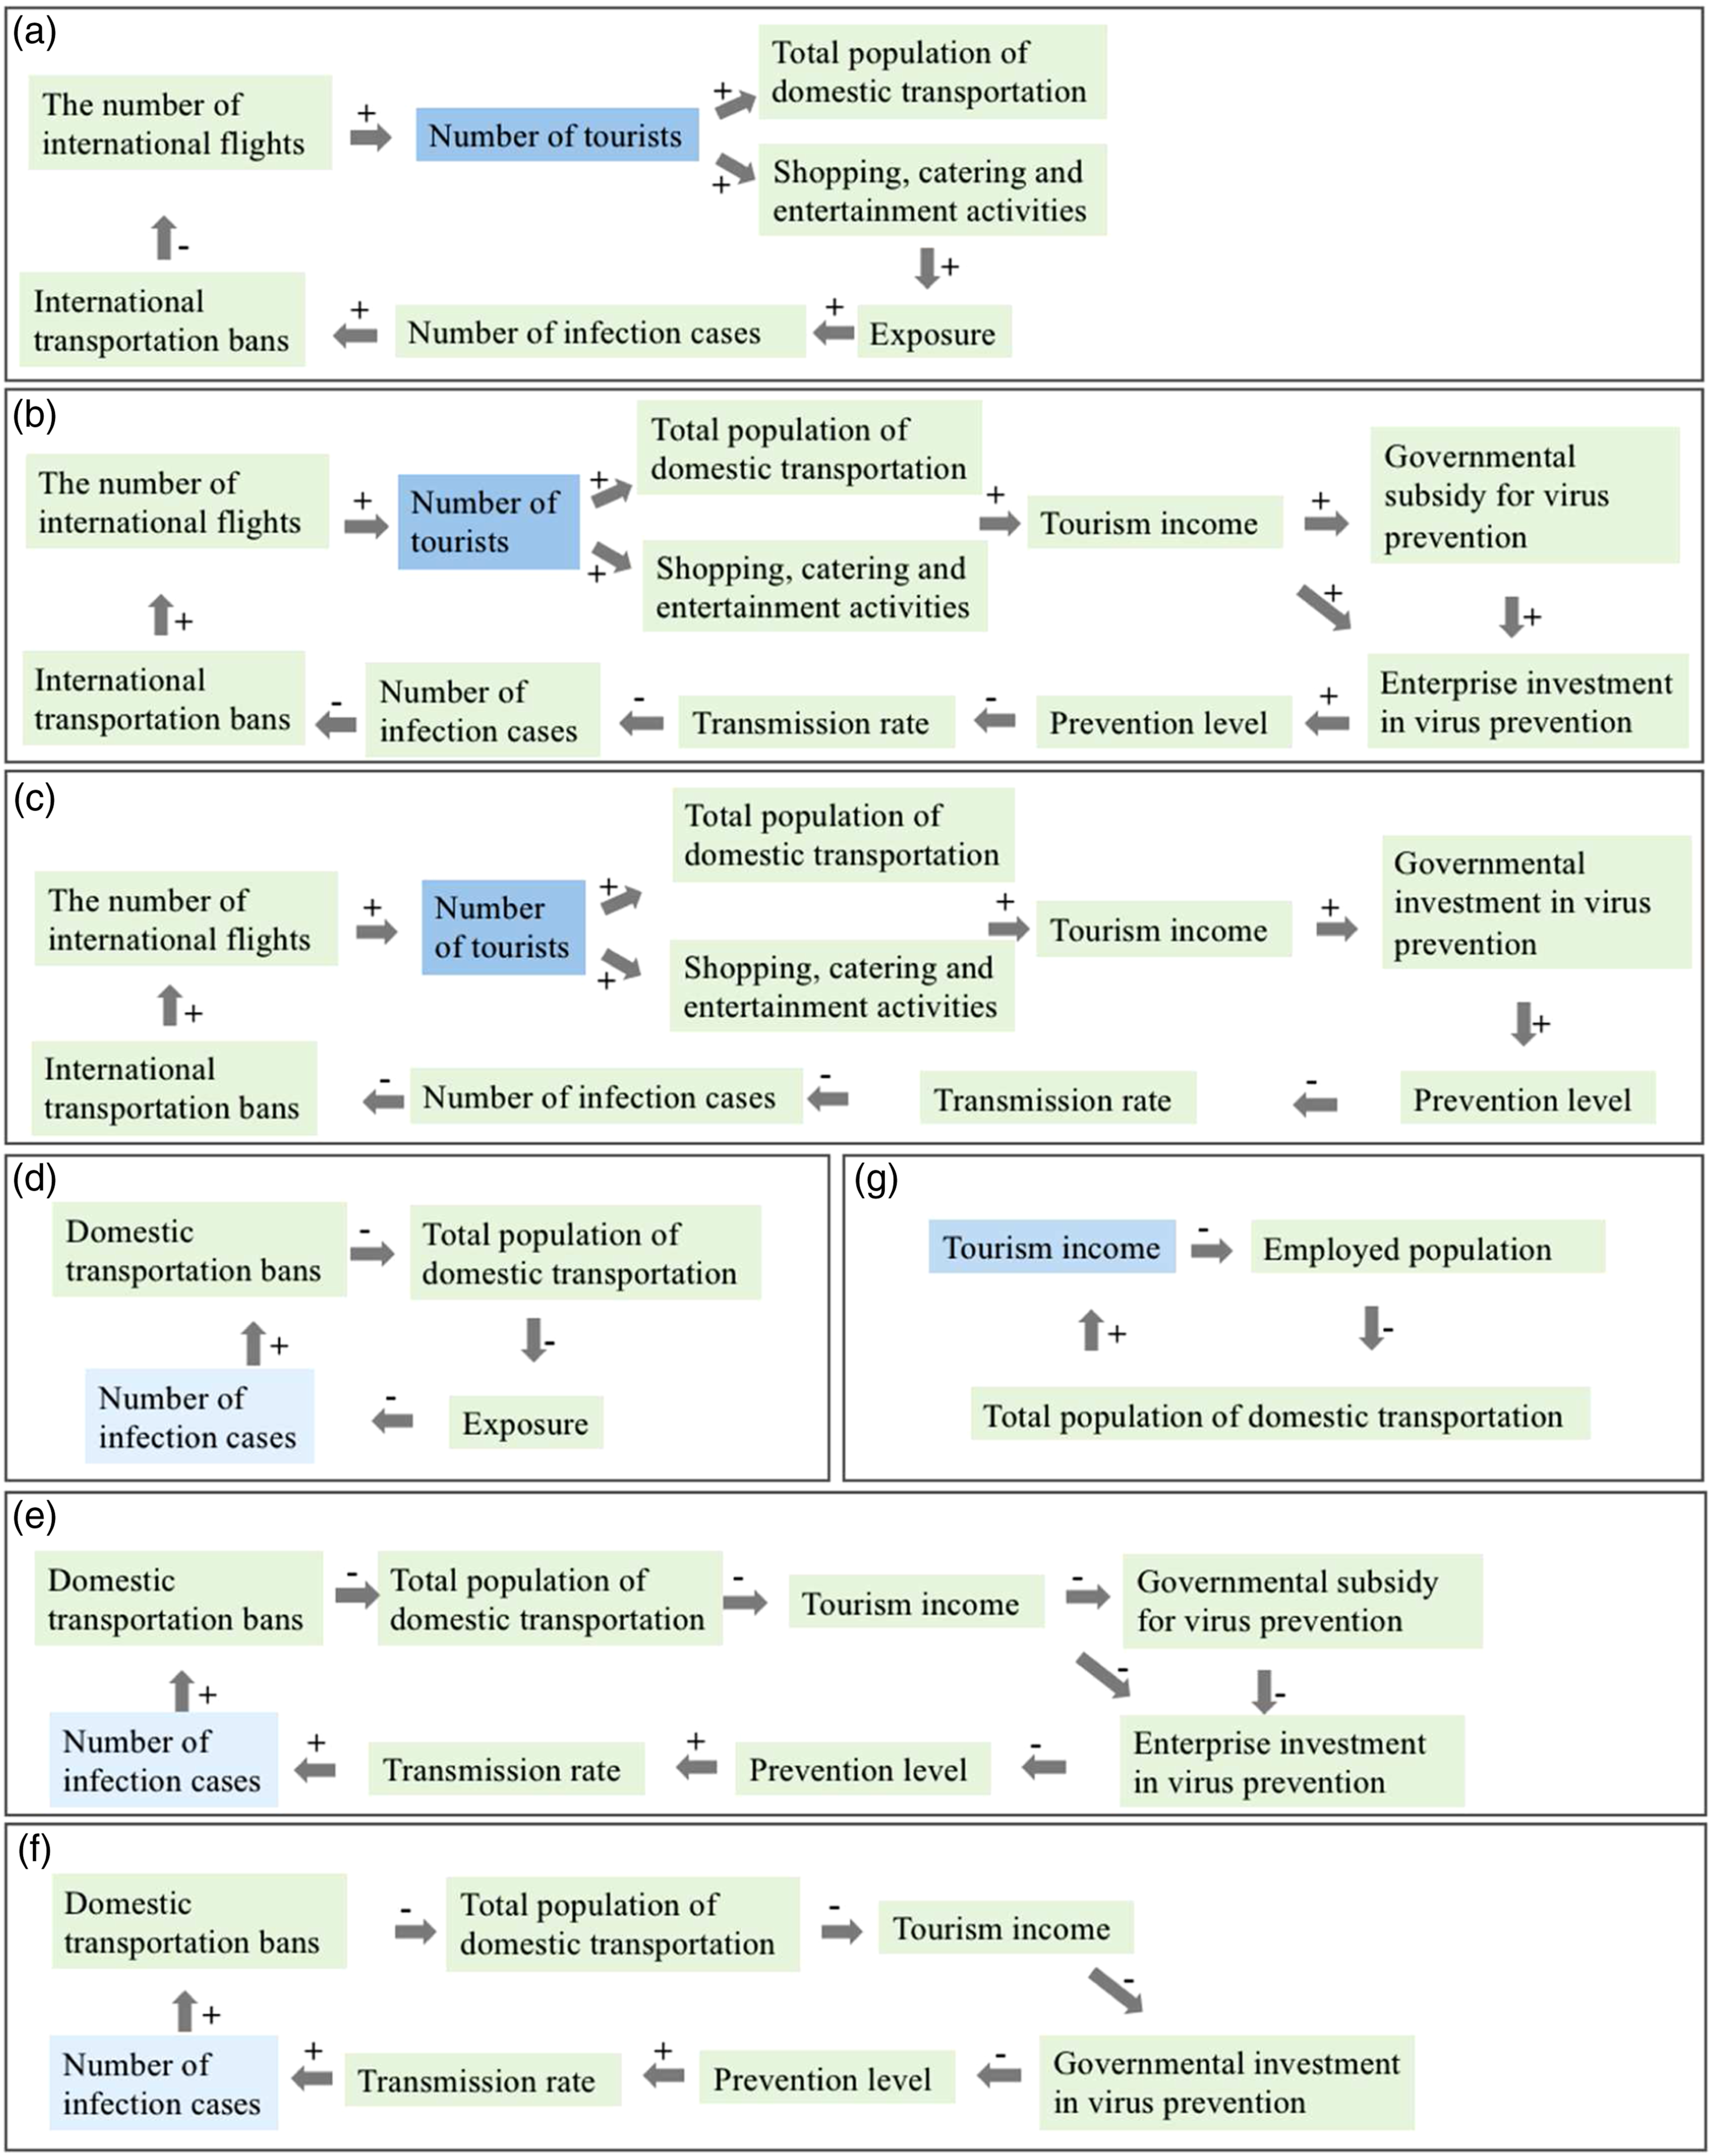
On the other hand, an increase in the number of international flights results in an increase in tourists. As tourists increase, the total population of domestic transportation and shopping, catering, and entertainment activities grow. This boosts income from tourism. Increasing tourism income leads to more government subsidies for virus prevention. It thus brings more enterprise investment in virus prevention (tourism income increase also leads to an increase in enterprise investment in virus prevention). More enterprise investment may enhance prevention, and as a result, the transmission rate may decline, further leading to a reduction in infection cases. Accordingly, international transportation bans may be relaxed and the number of international flights may consequently increase (Figure 4(b)).
As shown in Figure 4(c), the tourism income increase can also raise government investment in virus prevention. It helps to enhance the prevention level; the higher prevention level causes the transmission rate to drop; the infection cases go down as a result; this leads to less international transportation bans, and the number of international flights goes up.
For additional feedback loops of communication through infection cases (apart from those mentioned above), when infection cases increase, the domestic transportation bans go up, and the total population of domestic transportation goes down. When the total population of domestic transportation goes down, exposure decreases and causes the number of infection cases to go down (Figure 4(d)).
As shown in Figure 4(e), on the one hand, when infection cases increase, the domestic transportation bans go up. Tourism income falls, causing a decline in government subsidies for epidemic prevention, and eventually also a fall in enterprise investment in virus prevention (falling tourism income can also cause enterprise investment in virus prevention to decrease); it causes the prevention level to go down, and then the transmission rate and number of infections go down.
Figure 4(f) illustrates that when the tourism income falls, there is a decrease in government investment for direct protective equipment. It causes the prevention level to decrease, leading to the transmission rate to increase. This can lead to an increase in the number of infection cases.
For feedback loops which communicate with each other through the tourism income (apart from mentioned above), as tourism increases, the employed population goes up. This leads to a significant improvement in the total population of domestic transportation (Figure 4(g)).
By reflecting the causal feedback loops in Figure 3 and the data availability, the causalities related to key variables are represented in the stock flow diagram in Figure 5. Stock flow diagram shown in the SD model.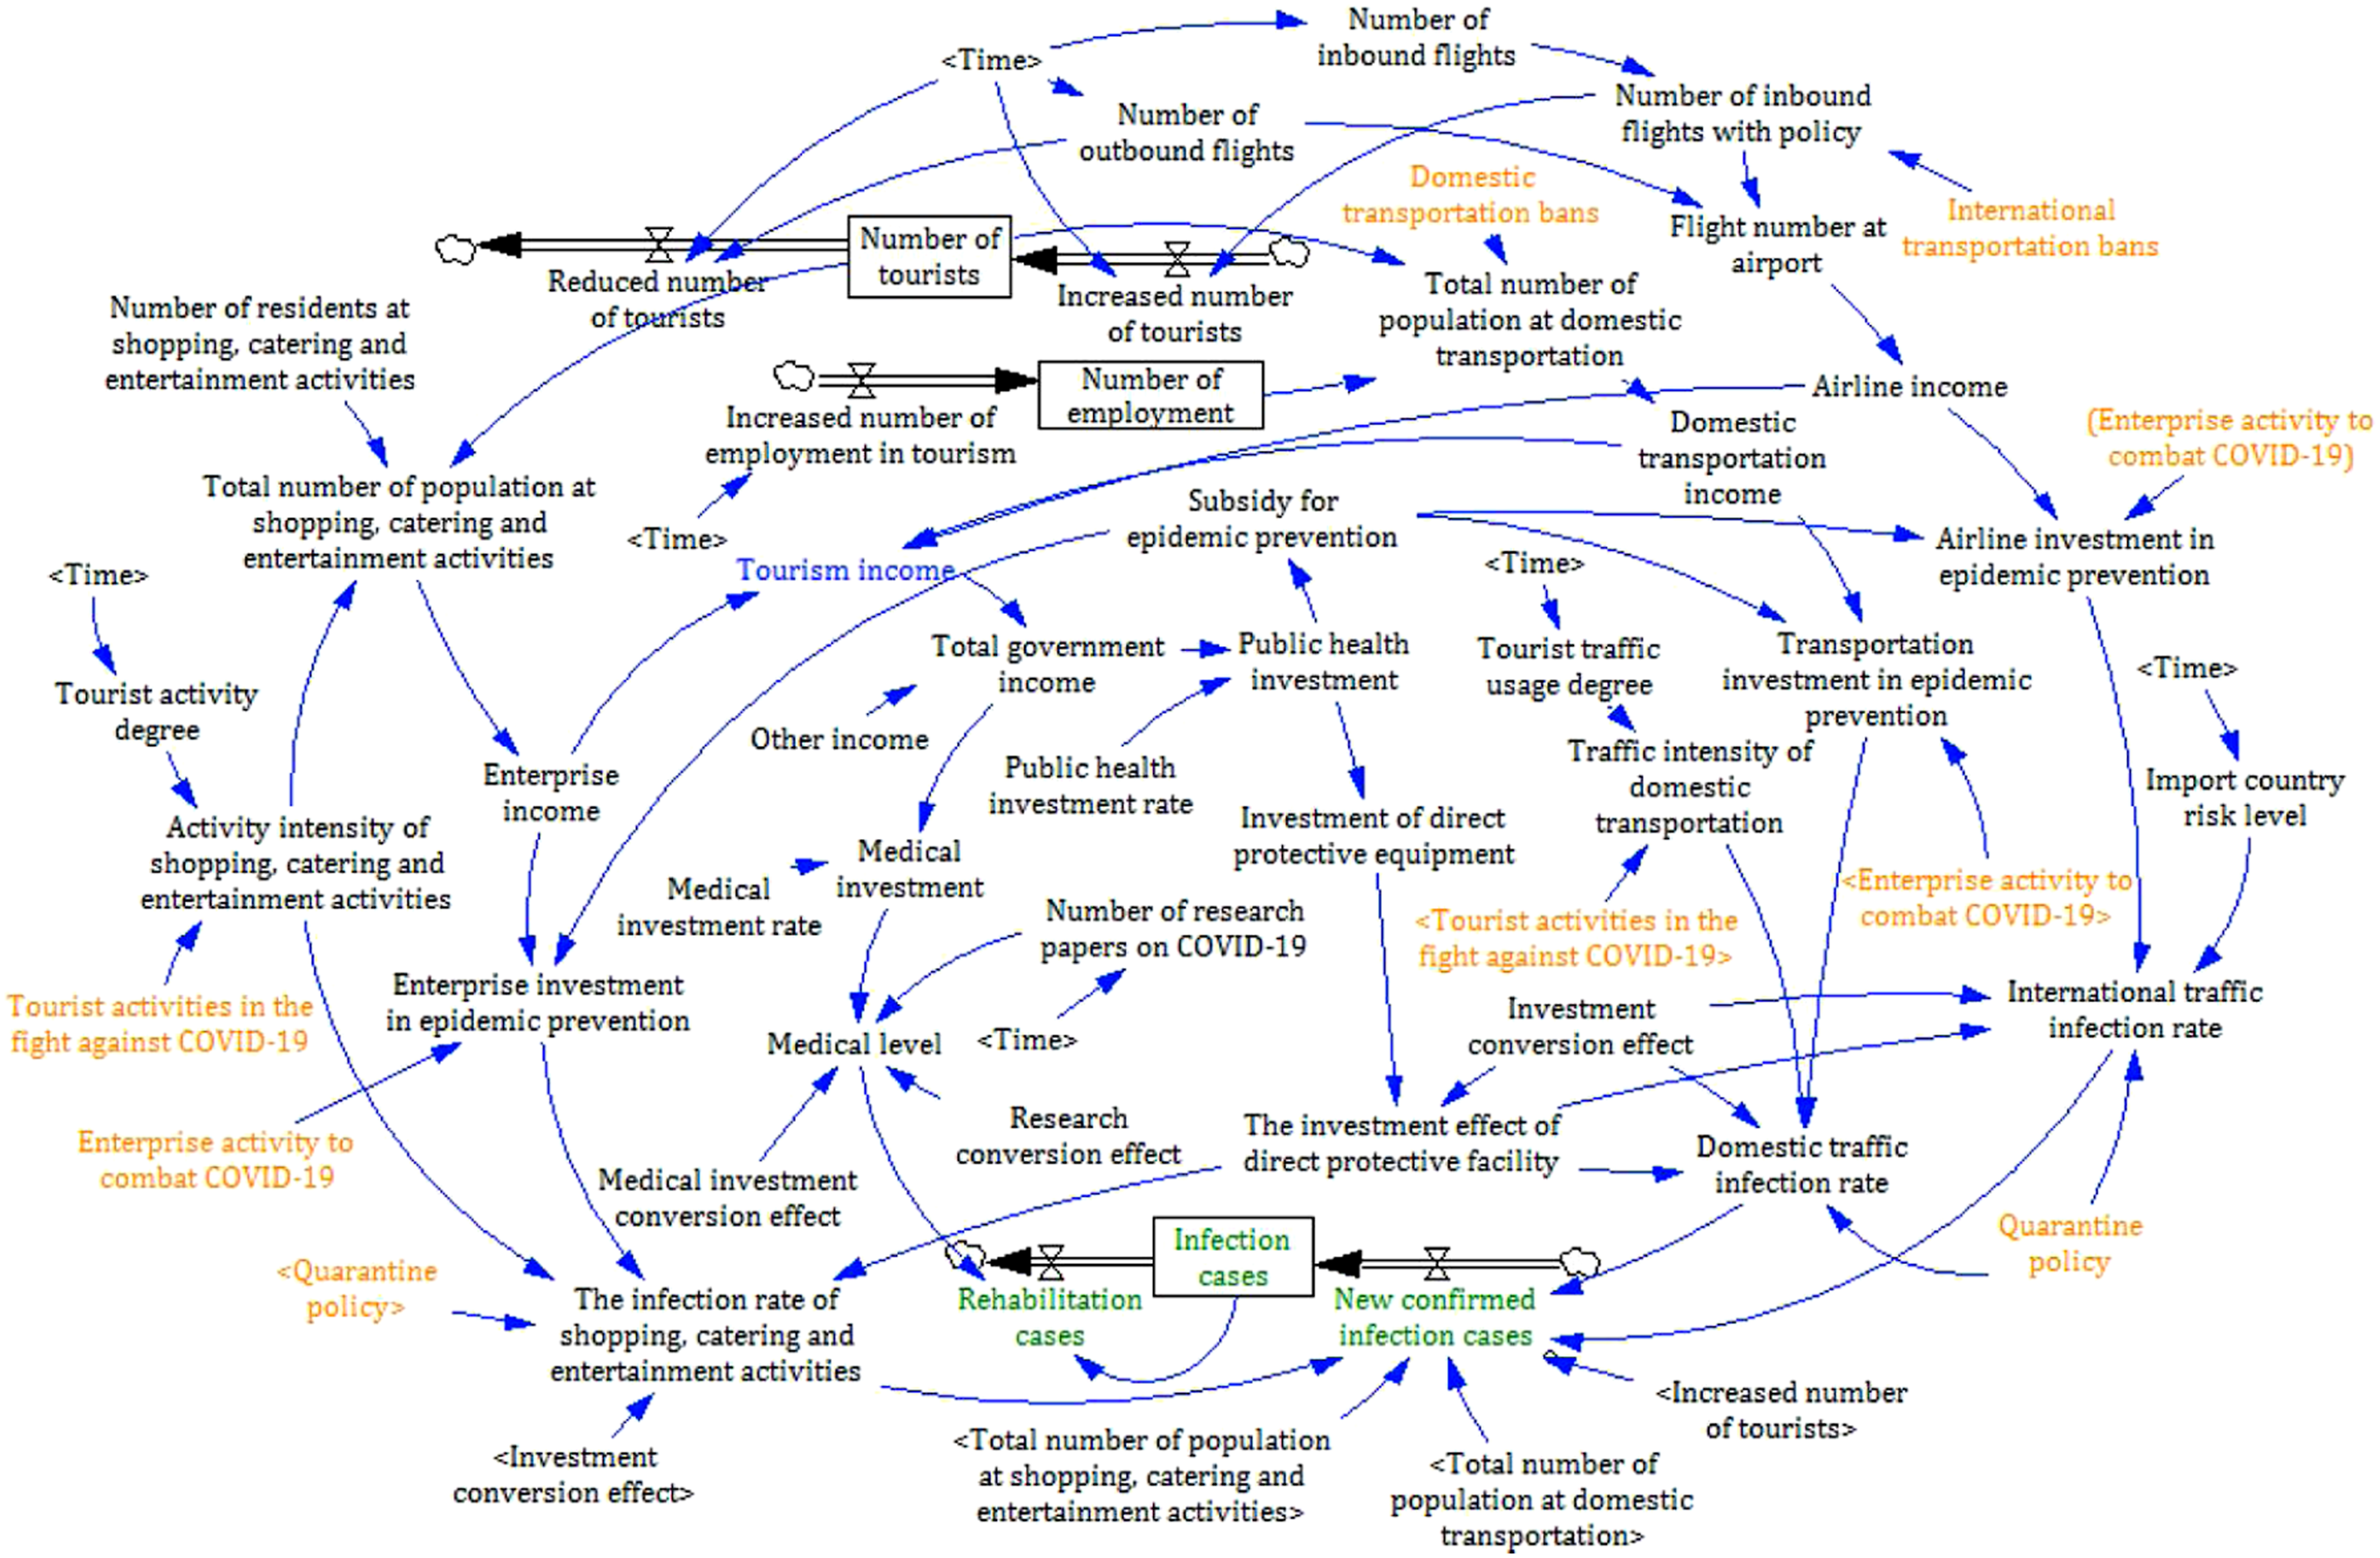
Data
For the model, data on changes in mobility are obtained from Google Community Mobility Reports. 9 For time-series flight analytics, the open dataset from the OpenSky Network 10 is used. COVID-19 data is taken from the WHO Coronavirus Disease (COVID-19) Dashboard 11 , including new daily infections cases, cumulative infection cases and deaths. Data on hospital beds are collected from the Cambodia Coronavirus Disease 2019 (COVID-19) Situation Report, prepared by the World Health Organization. 12 Our World in Data provided the new incidence indicator (new daily infection cases) used to calculate import country risk level. 13 Data of total tourist consumption, contribution of tourism to employment and GDP data are obtained from the Travel & Tourism Economic Impact 2020 Cambodia Report. 14
Model test
Equations and values of variables.
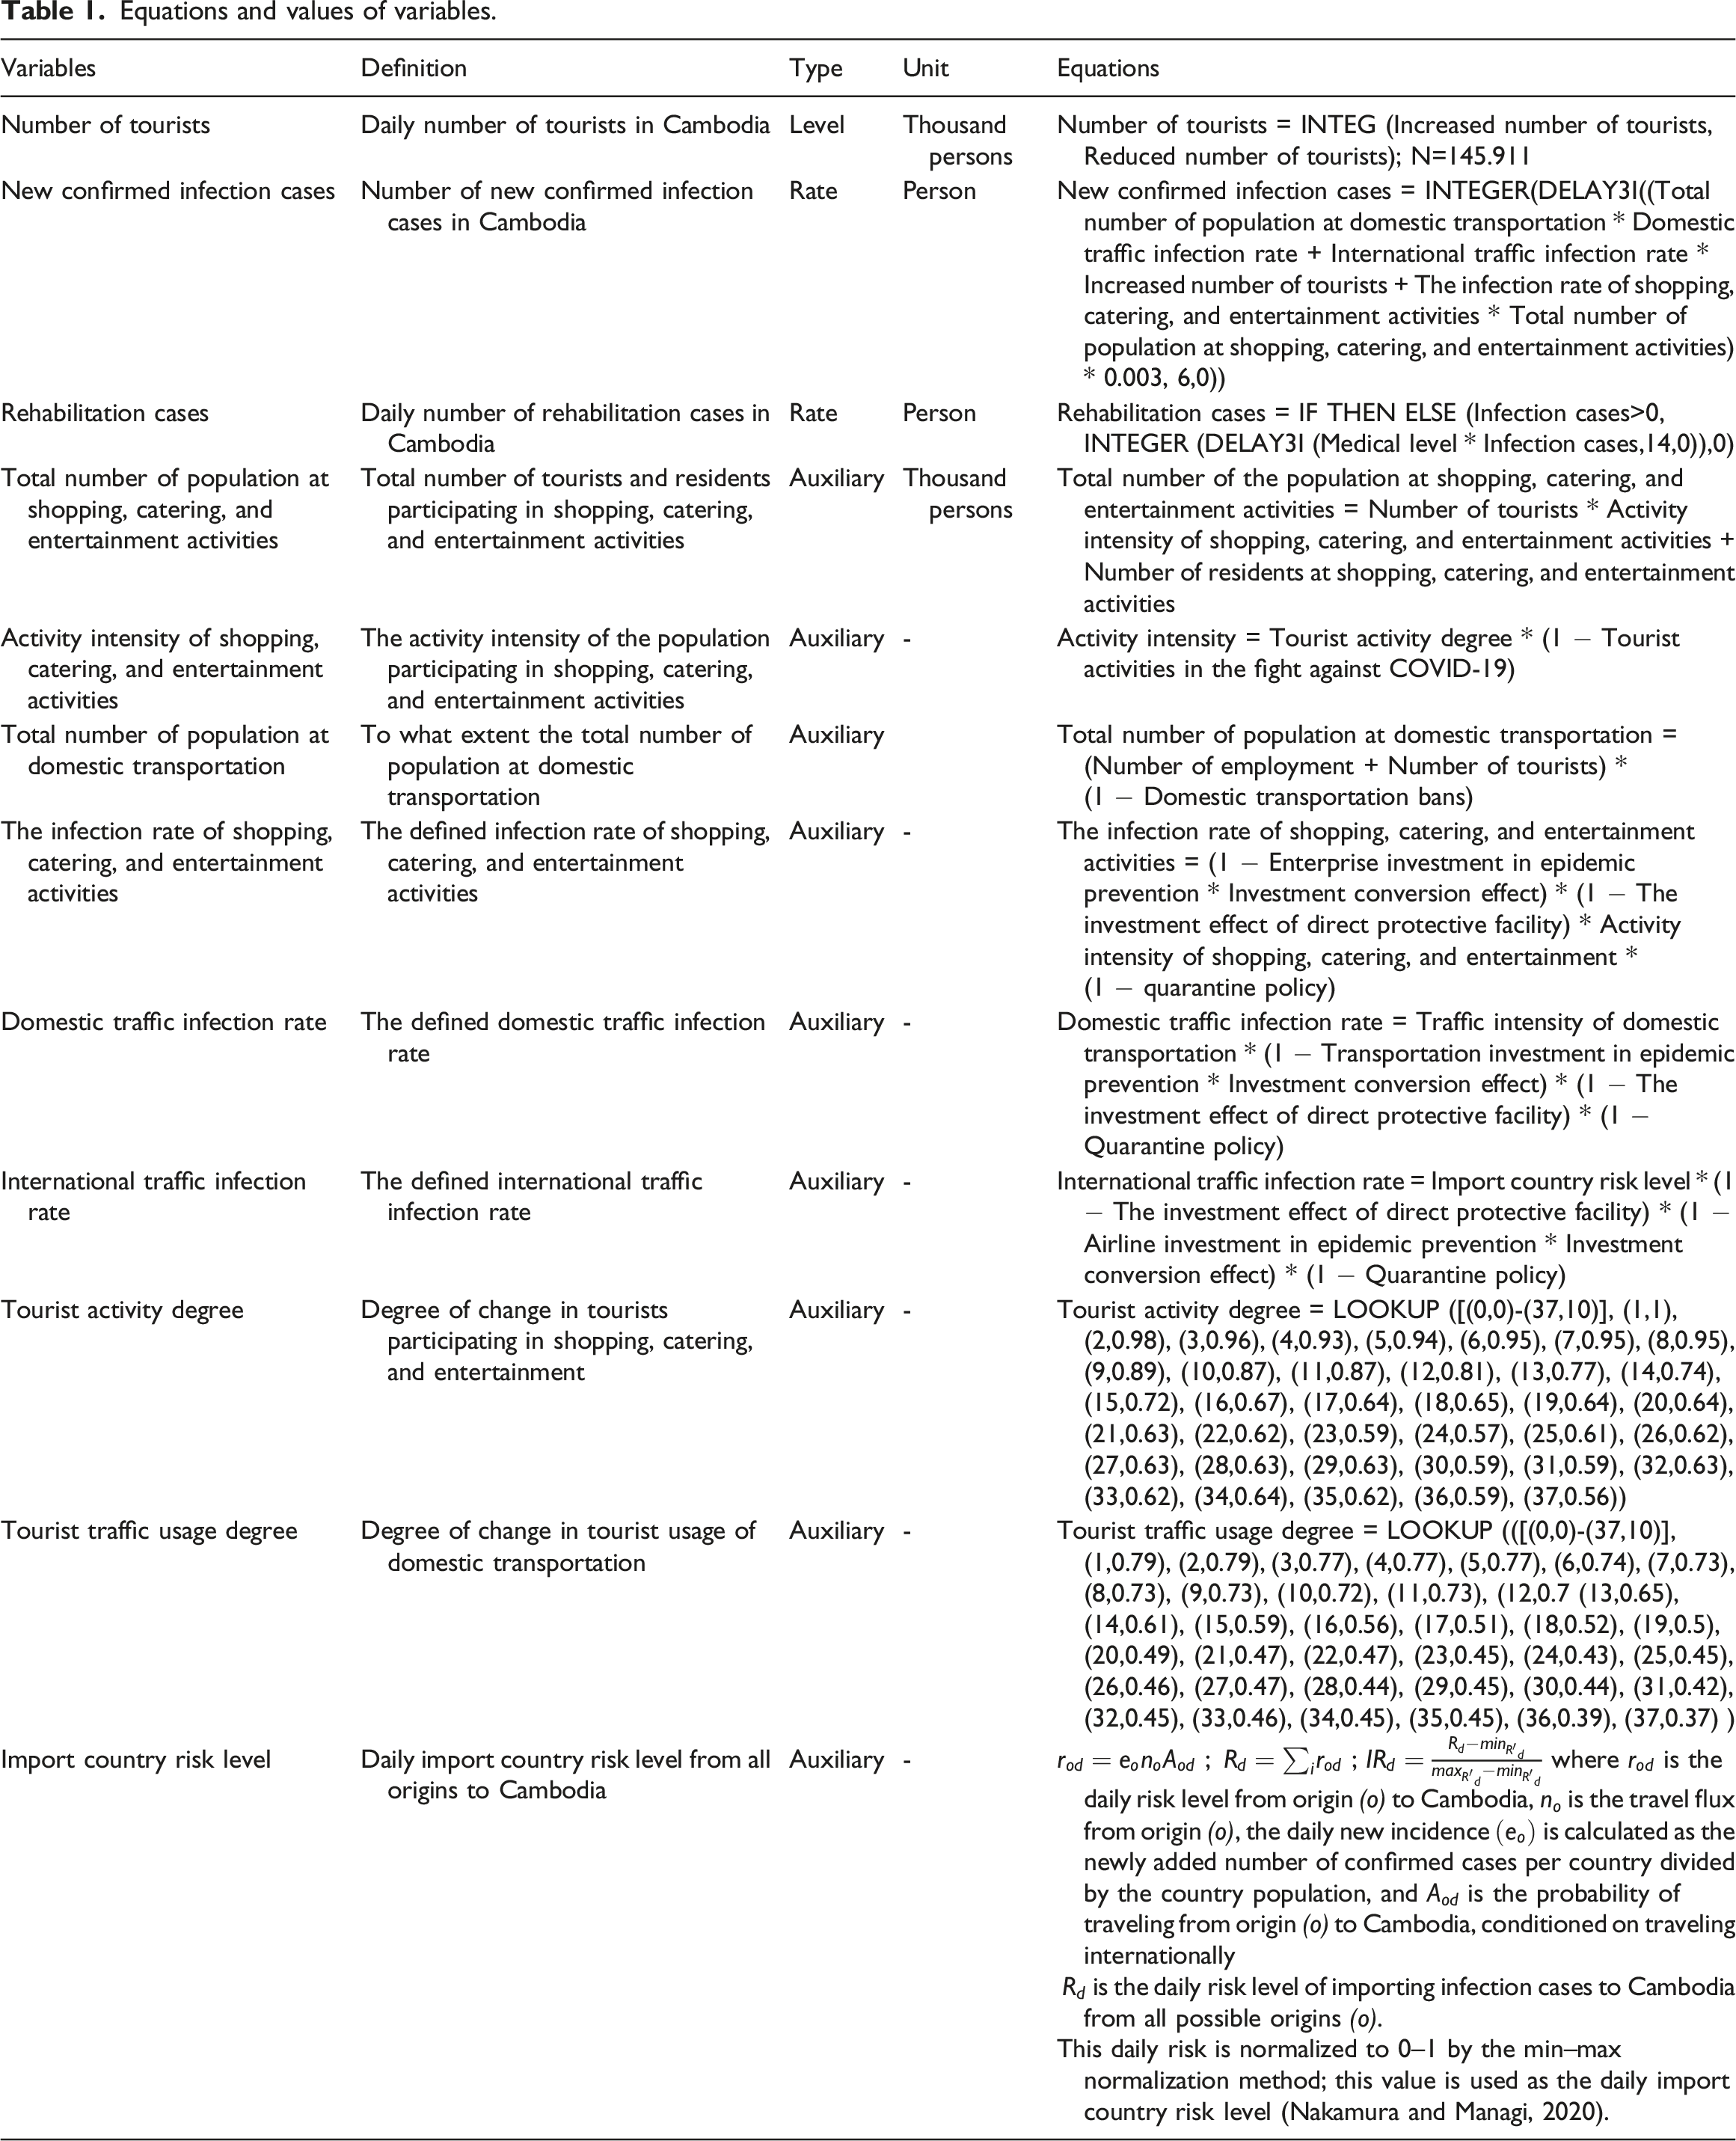
For ensuring that the SD model can quantitatively capture the relationships between variables and the historical development of COVID-19 in Cambodia in a reasonable way, the model must be tested from perspectives of a structural validity and an internal validity.
Structural validity is the main criterion for SD modeling validation and shows the validity of the set of relationships assumed in the model, in comparison with real processes (Vlachos et al., 2007). The structural validity test is made with respect to the dimensional consistency test and the extreme condition test. The dimensional consistency test requires that all mathematical units in equations are dimensionally consistent. The extreme conditions test assesses whether the model works logically when extreme values are given to selected parameters (Forrester and Senge, 1980). Furthermore, for internal validity, modeling fit is evaluated by using the adjusted R-squared value. The adjusted R-squared value refers to the goodness-of-fit of modeling results in comparison to observed data.
Scenario setting
Here, single-policy scenarios and packaged policy scenarios are assumed (Figure 6). In total, five single-policy types are selected (Figure 6(a)): (1) international traffic bans [Scenario a-1], (2) domestic traffic bans [Scenario a-2], (3) quarantine policy [Scenario a-3], (4) policies on tourist behaviors [Scenario a-4], and (5) policies on tourism enterprise activities [Scenario a-5]. These five types are further packaged in two ways. The first way is to assume that each single-policy type is fully effective (Figure 6(b)) and the second is to assume partial effectiveness of each policy type (Figure 6(c)). Alternative policies and effectiveness in various scenarios in the SD model: (a) five single-policy scenarios; (b) six scenarios with fully effective packaged policies; and (c) six scenarios with partially effective packaged policies.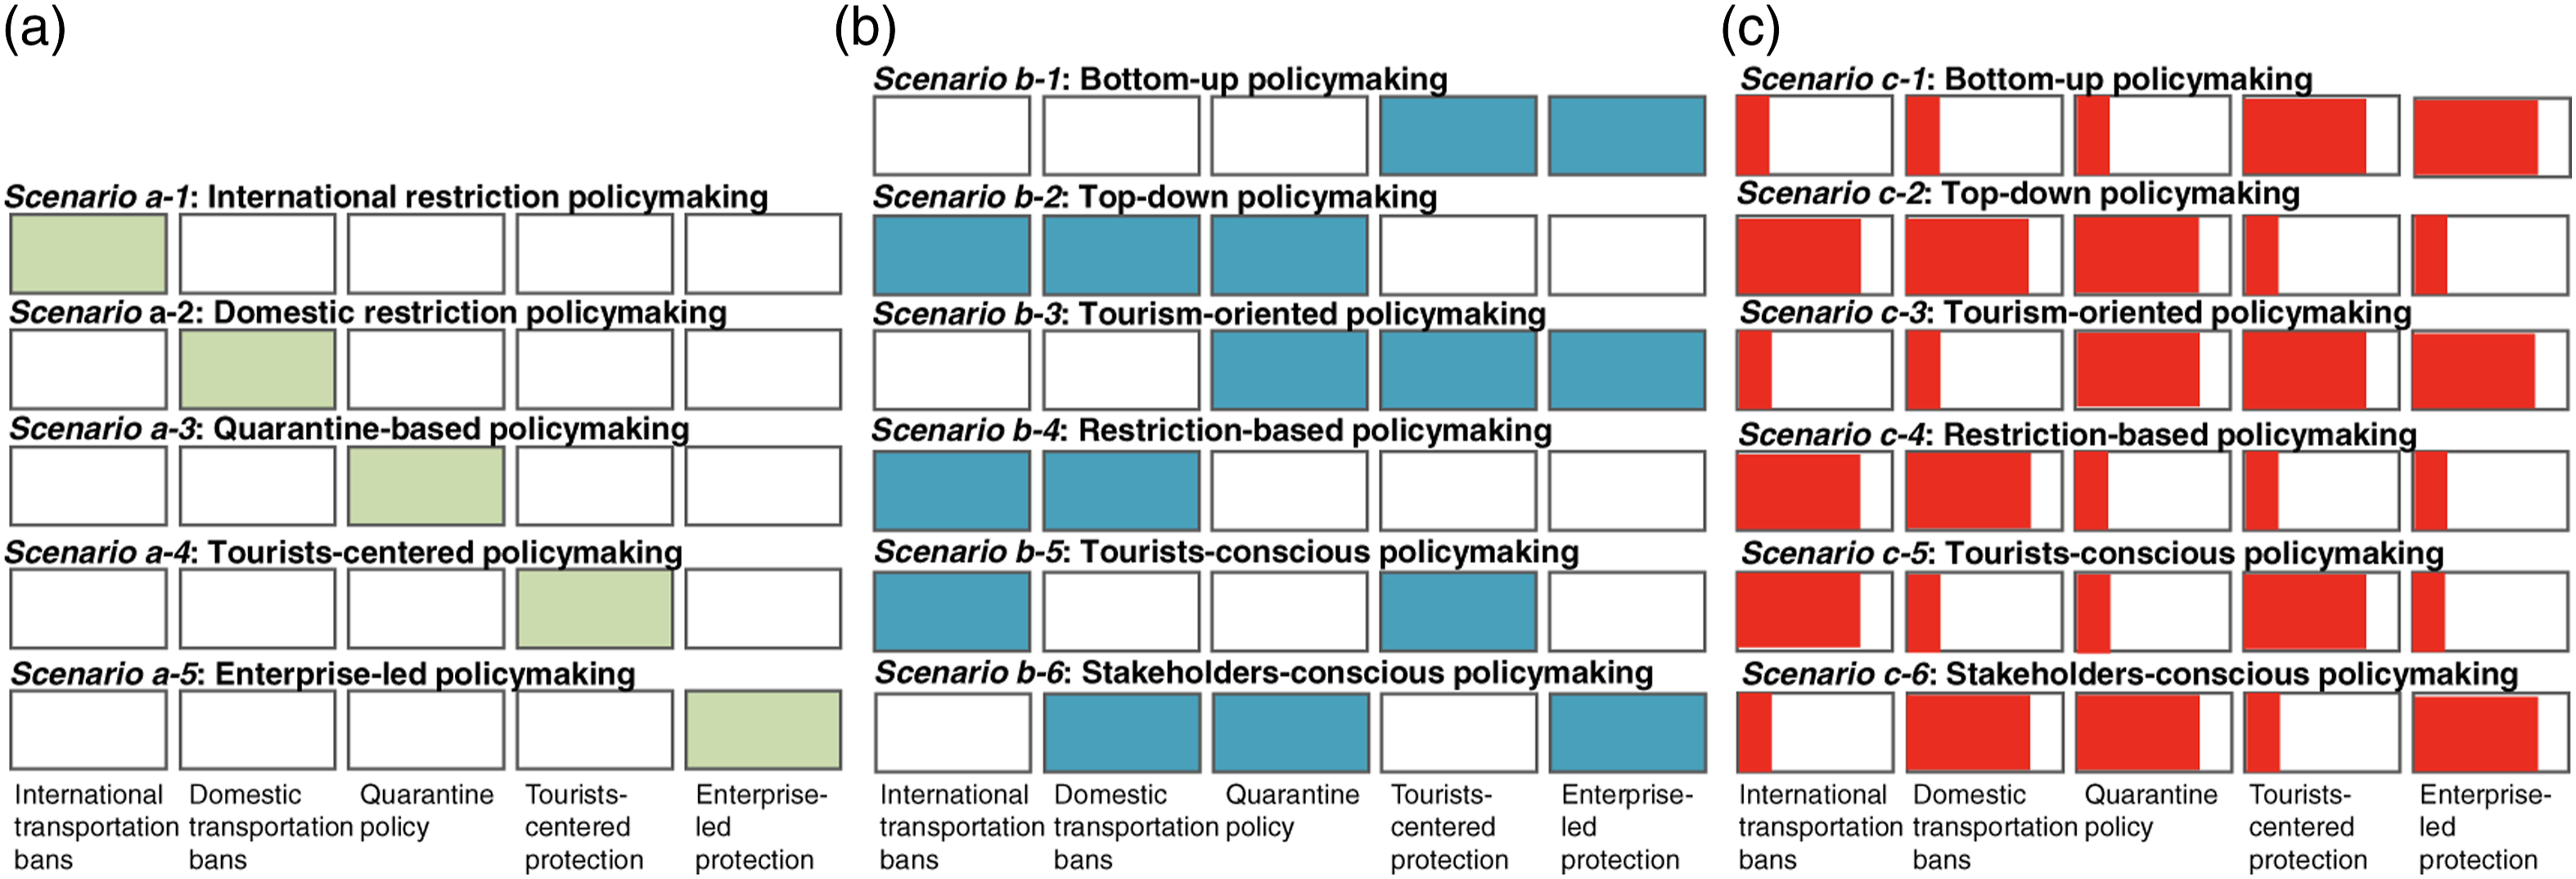
Single-policy scenarios
Single-policy scenarios assume that each single policy is 100% effective, while no other policy is implemented. Scenario a-1 (international restriction policymaking) assumes that international tourists are fully prohibited from traveling to Cambodia, given international transportation bans. In the SD model, the number of international flights is set to zero. Scenario a-2 (domestic restriction policymaking) assumes that domestic traffic in Cambodia is fully prohibited by setting the number of domestic passengers and the corresponding employed population to zero in the model. Scenario a-3 (quarantine-based policymaking) focuses on quarantine policy, but without restricting international flights, where domestic transportation (domestic passengers and the corresponding employed population) are maintained at the actual level. Quarantine policy assumes that all cross-border travelers and returnees are required to isolate for at least 14 days after entry into Cambodia at designated quarantine locations and to do a regular PCR test during the stay period. Scenario a-4 is a tourist-centered policymaking scenario, which assumes that tourists are actively involved in the fight against COVID-19 by wearing face masks, washing hands, keeping social distance and reducing activities (both shopping, catering, and entertainment activities and transportation activities). Scenario a-5 is an enterprise-led policymaking scenario, which refers to enterprise investment in virus prevention.
Scenarios with packaged policies
The five single policies in the above scenarios are combined into six policy packages. Scenario b-1 assumes a bottom-up policymaking package, which combines policies related to tourist behaviors and tourism enterprise activities, that is, a combination of Scenario a-4 and Scenario a-5. Scenario b-2 assumes a top-down policymaking package, which combines policies in Scenario a-1, Scenario a-2, and Scenario a-3. Specifically, international and domestic transportation bans and quarantine policy are packaged as a government-led policymaking scenario. Scenario b-3 assumes a tourism-oriented policymaking package, which prioritizes tourism development supported by strict protection measures of quarantine policy and policies related to tourist behaviors and enterprise activities, that is, a combination of Scenario a-3, Scenario a-4, and Scenario a-5. Scenario b-4 emphasizes restriction-based policymaking via bans of both international and domestic transportation by integrating Scenario a-1 and Scenario a-2. Scenario b-5 assumes a tourist-conscious policymaking package by putting Scenario a-1 and Scenario a-4, that is, to ban international transportation but at the same time to enforce protection and physical distancing measures by the international tourists left behind in the country and domestic tourists. Scenario b-6 indicates a stakeholder-conscious policymaking package by combining Scenario a-2, Scenario a-3, and Scenario a-5. This package needs to involve governments to enforce quarantine policy, multi-stakeholders to ban domestic transportation, and tourism enterprises to invest more in protection measures. Scenario b-1 to Scenario b-6 assumes that each single policy is 100% effective. In reality, such a 100% effectiveness cannot be expected. To explore more feasible policymaking packages, partial effectiveness is assumed by forming a new set of scenarios of Scenario c-1 to Scenario c-6, which assumes that each single policy selected in a package is 80% effective, while each of the other policies are not 0% effective but only 20% effective.
Modeling performance
Structural validity
Dimensional consistency test
This test clarifies whether all mathematical units in all equations are dimensionally consistent. For example, the following equation describes the total number of residents participating in shopping, catering, and entertainment activities
In order to implement the dimensional consistency test, the dimensions of the above three factors are required. The number of tourists and total number of populations at shopping, catering, and entertainment activities are measured in terms of persons, while activity intensity of shopping, catering, and entertainment activities is dimensionless. Thus, the two sides of the above equation are consistent in terms of mathematical units (i.e., persons). Similarly, the test is also done to other equations.
Extreme condition test
Here, two parameters of “Quarantine policy” and “Medical investment” are selected and assigned with extreme values (Figure 7), for showing how the number of infection cases would change with extreme values. Three scenarios were designed: that is, Scenario A (Quarantine policy = 100%: the first extreme condition test), Scenario B (no policy measure: the baseline for the extreme condition test), and Scenario C (Medical investment = 0%: the second extreme condition test). It is displayed in Scenario C that infection cases would grow rapidly to more than 100 persons at the end of the simulation period (after April 8). This result represents the outbreak of COVID-19 without valid medical treatment or PCR tests, when medical investments or special medical facilities are limited or insufficient. In comparison with Scenario C, a remarkable reduction of infection cases in Scenario A is observed. In Scenario B, infection cases increase first, and then decrease after a certain length of time passes. The above results indicate that medical investment and quarantine affect infection cases significantly. This observation suggests an urgent need to find more suitable policy packages that can better address not only the mitigation of disease transmission but also transportation and tourism activities. Extreme condition tests on the number of infection cases.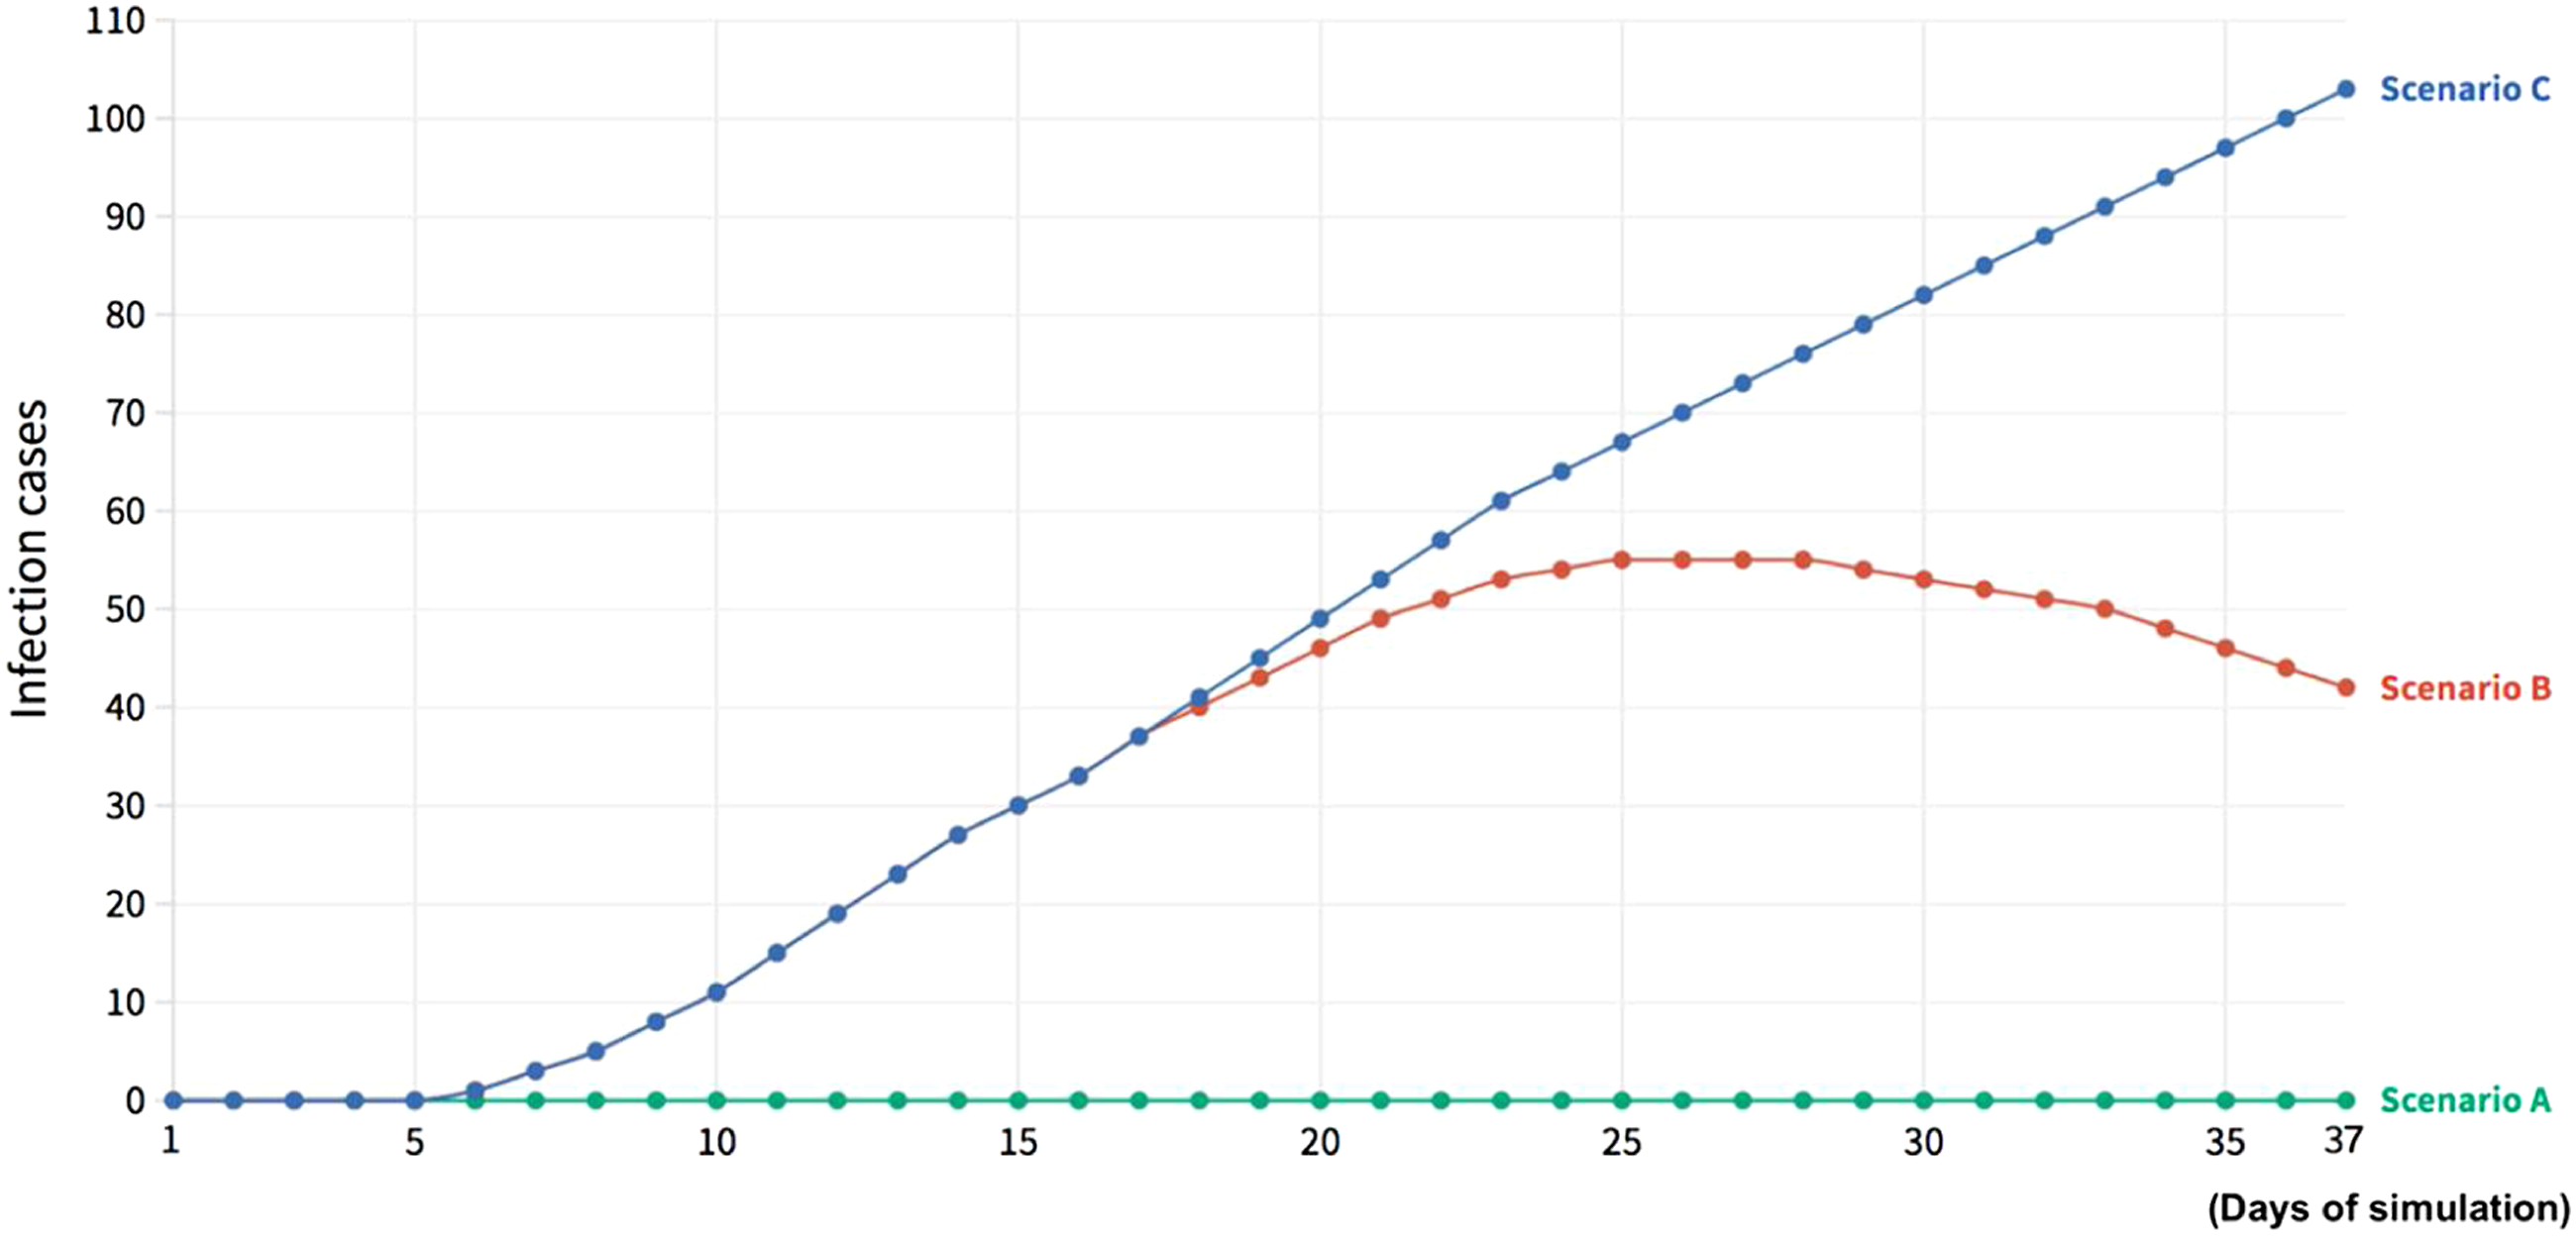
Internal validity
Two methods are adopted to evaluate the goodness-of-fit of the developed model in representing the number of infection cases over time. Simulation results are first compared with the actual daily infection cases from 6 March 2020 to 19 March 2020 (Figure 8). Because the daily infection cases are very sensitive in the model, the authors first calculated the average infection cases of 7 days (3 days before and 3 days after) for every simulated day to represent the actual cases after data smoothing. It is found that the correlation coefficient between the actual cases and the calculated cases is 0.77 in adjusted R-squared, which is higher than 0.75 suggested by Henseler et al. (2009), showing a strong correlation. Thus, the accuracy of the developed model is acceptable in terms of internal validity. The model is therefore used to conduct the following scenario analyses. Comparison of actual and simulated infection cases over time.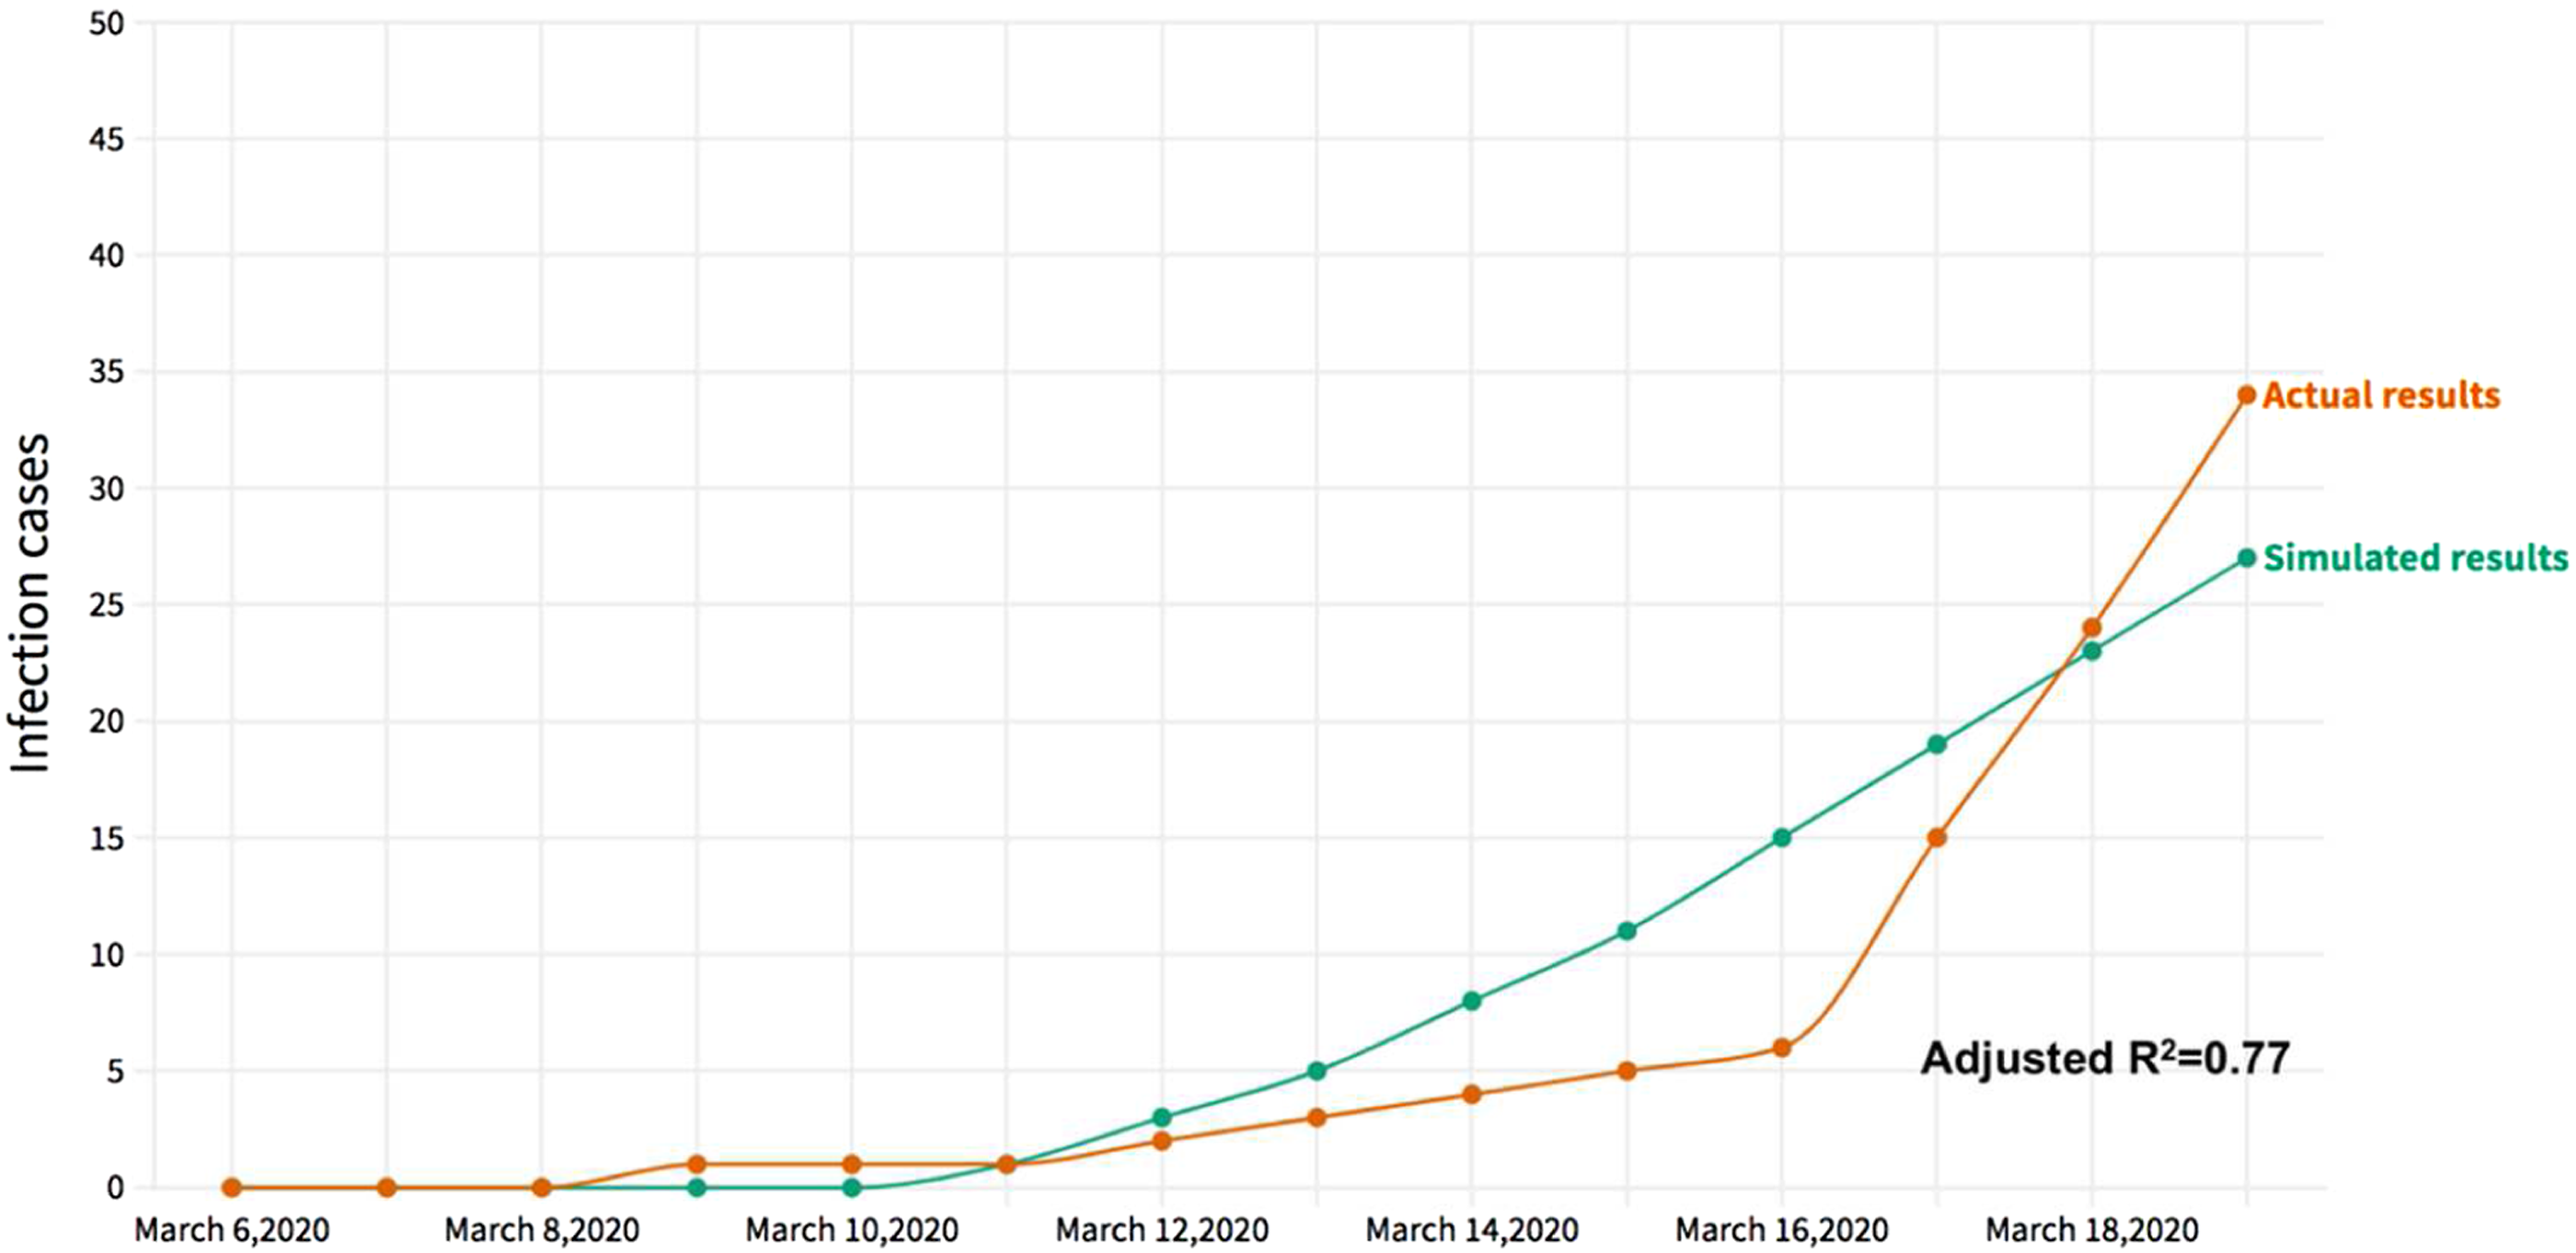
Simulation results of policymaking scenarios
Single-policy scenarios
Figure 9 compares five single-policy scenarios in terms of infection cases (Figure 9(a)) and tourism income (Figure 9(b)). For infection cases, Scenario 1 (international transportation bans) results in the highest values among all the five scenarios, although the values show a declining trend after 29 days. This means that only limiting international flights is not very effective to control the COVID-19 pandemic. Among the five scenarios, Scenario 3 (quarantine policy) shows the highest performance in reducing the number of infection cases at a stable level, suggesting that the quarantine policy is the most impactful policy for controlling the spread of the virus. The policy showing the second highest performance (Scenario 2) is domestic transportation bans (i.e., domestics traffic bans), which show an unchanged lower level of infections after the 28th day in the simulation, even though infection cases keep increasing up to that date. Comparing policies on tourists (Scenario 4) and enterprises (Scenario 5), the policy of tourist-centered protection works better than that of enterprise-led protection. Looking at tourism income, Scenario 1 and Scenario 5 show the highest performance in terms of income earnings. Although Scenario 2 shows better performance in virus control, tourism income in this scenario is the worst, which is half of the income levels under other scenarios. This implies that the domestic traffic bans damage the tourism economy most seriously. The level of tourism income under Scenario 4 is moderate. Concerning Scenario 3, the tourism income is very close to the highest level derived from Scenario 1 and Scenario 5. Thus, the above simulation results of single-policy scenarios suggest that the most effective policy is the quarantine policy, in terms of not only virus control but also maintaining the tourism economy. Simulation results of single-policy scenarios: (a) infection cases and (b) tourism income.
Policy packaging scenarios: Fully effective
In reality, different policies should be implemented simultaneously. The question is how to package different policies. Figure 10 shows the simulation results of six packaged policies, where each single policy is assumed to be fully effective in controlling the virus and mitigating a reduction in tourism income. In terms of infection cases, Scenario 2, Scenario 3, and Scenario 6 show the highest effects for controlling the virus, while Scenario 2 and Scenario 4 perform better than other scenarios in terms of tourism income earning. Thus, the Scenario 2 policy, that is, the top-down strategy oriented policy, shows the highest performance among all scenarios. In other words, both international and domestic traffic bans and quarantine policy should be packaged together. Scenario 1 and Scenario 5 lead to the largest infection cases and the largest reduction in tourism income. Accordingly, packaging policies of only tourist behaviors and enterprise-led protection (Scenario 1) and packaging policies of international traffic bans and tourist-centered protection should be avoided. In other words, the bottom-up policy packaging should not be recommended, without integrating with other policies. The Scenario 4 policy should be regarded as the worst policy, in the sense that it is the second worst in terms of infection cases and the worst in terms of tourism income. By comparing all scenarios, it was found that the Scenario 3 policy is most effective for balancing virus control and tourism development. Thus, packaging quarantine policy (top-down type) and policies of tourist behaviors and enterprise activities (bottom-up type) should be strongly recommended in the context of Cambodia. Comparison of (a) the number of infection cases and (b) tourism income of six combined policies scenarios.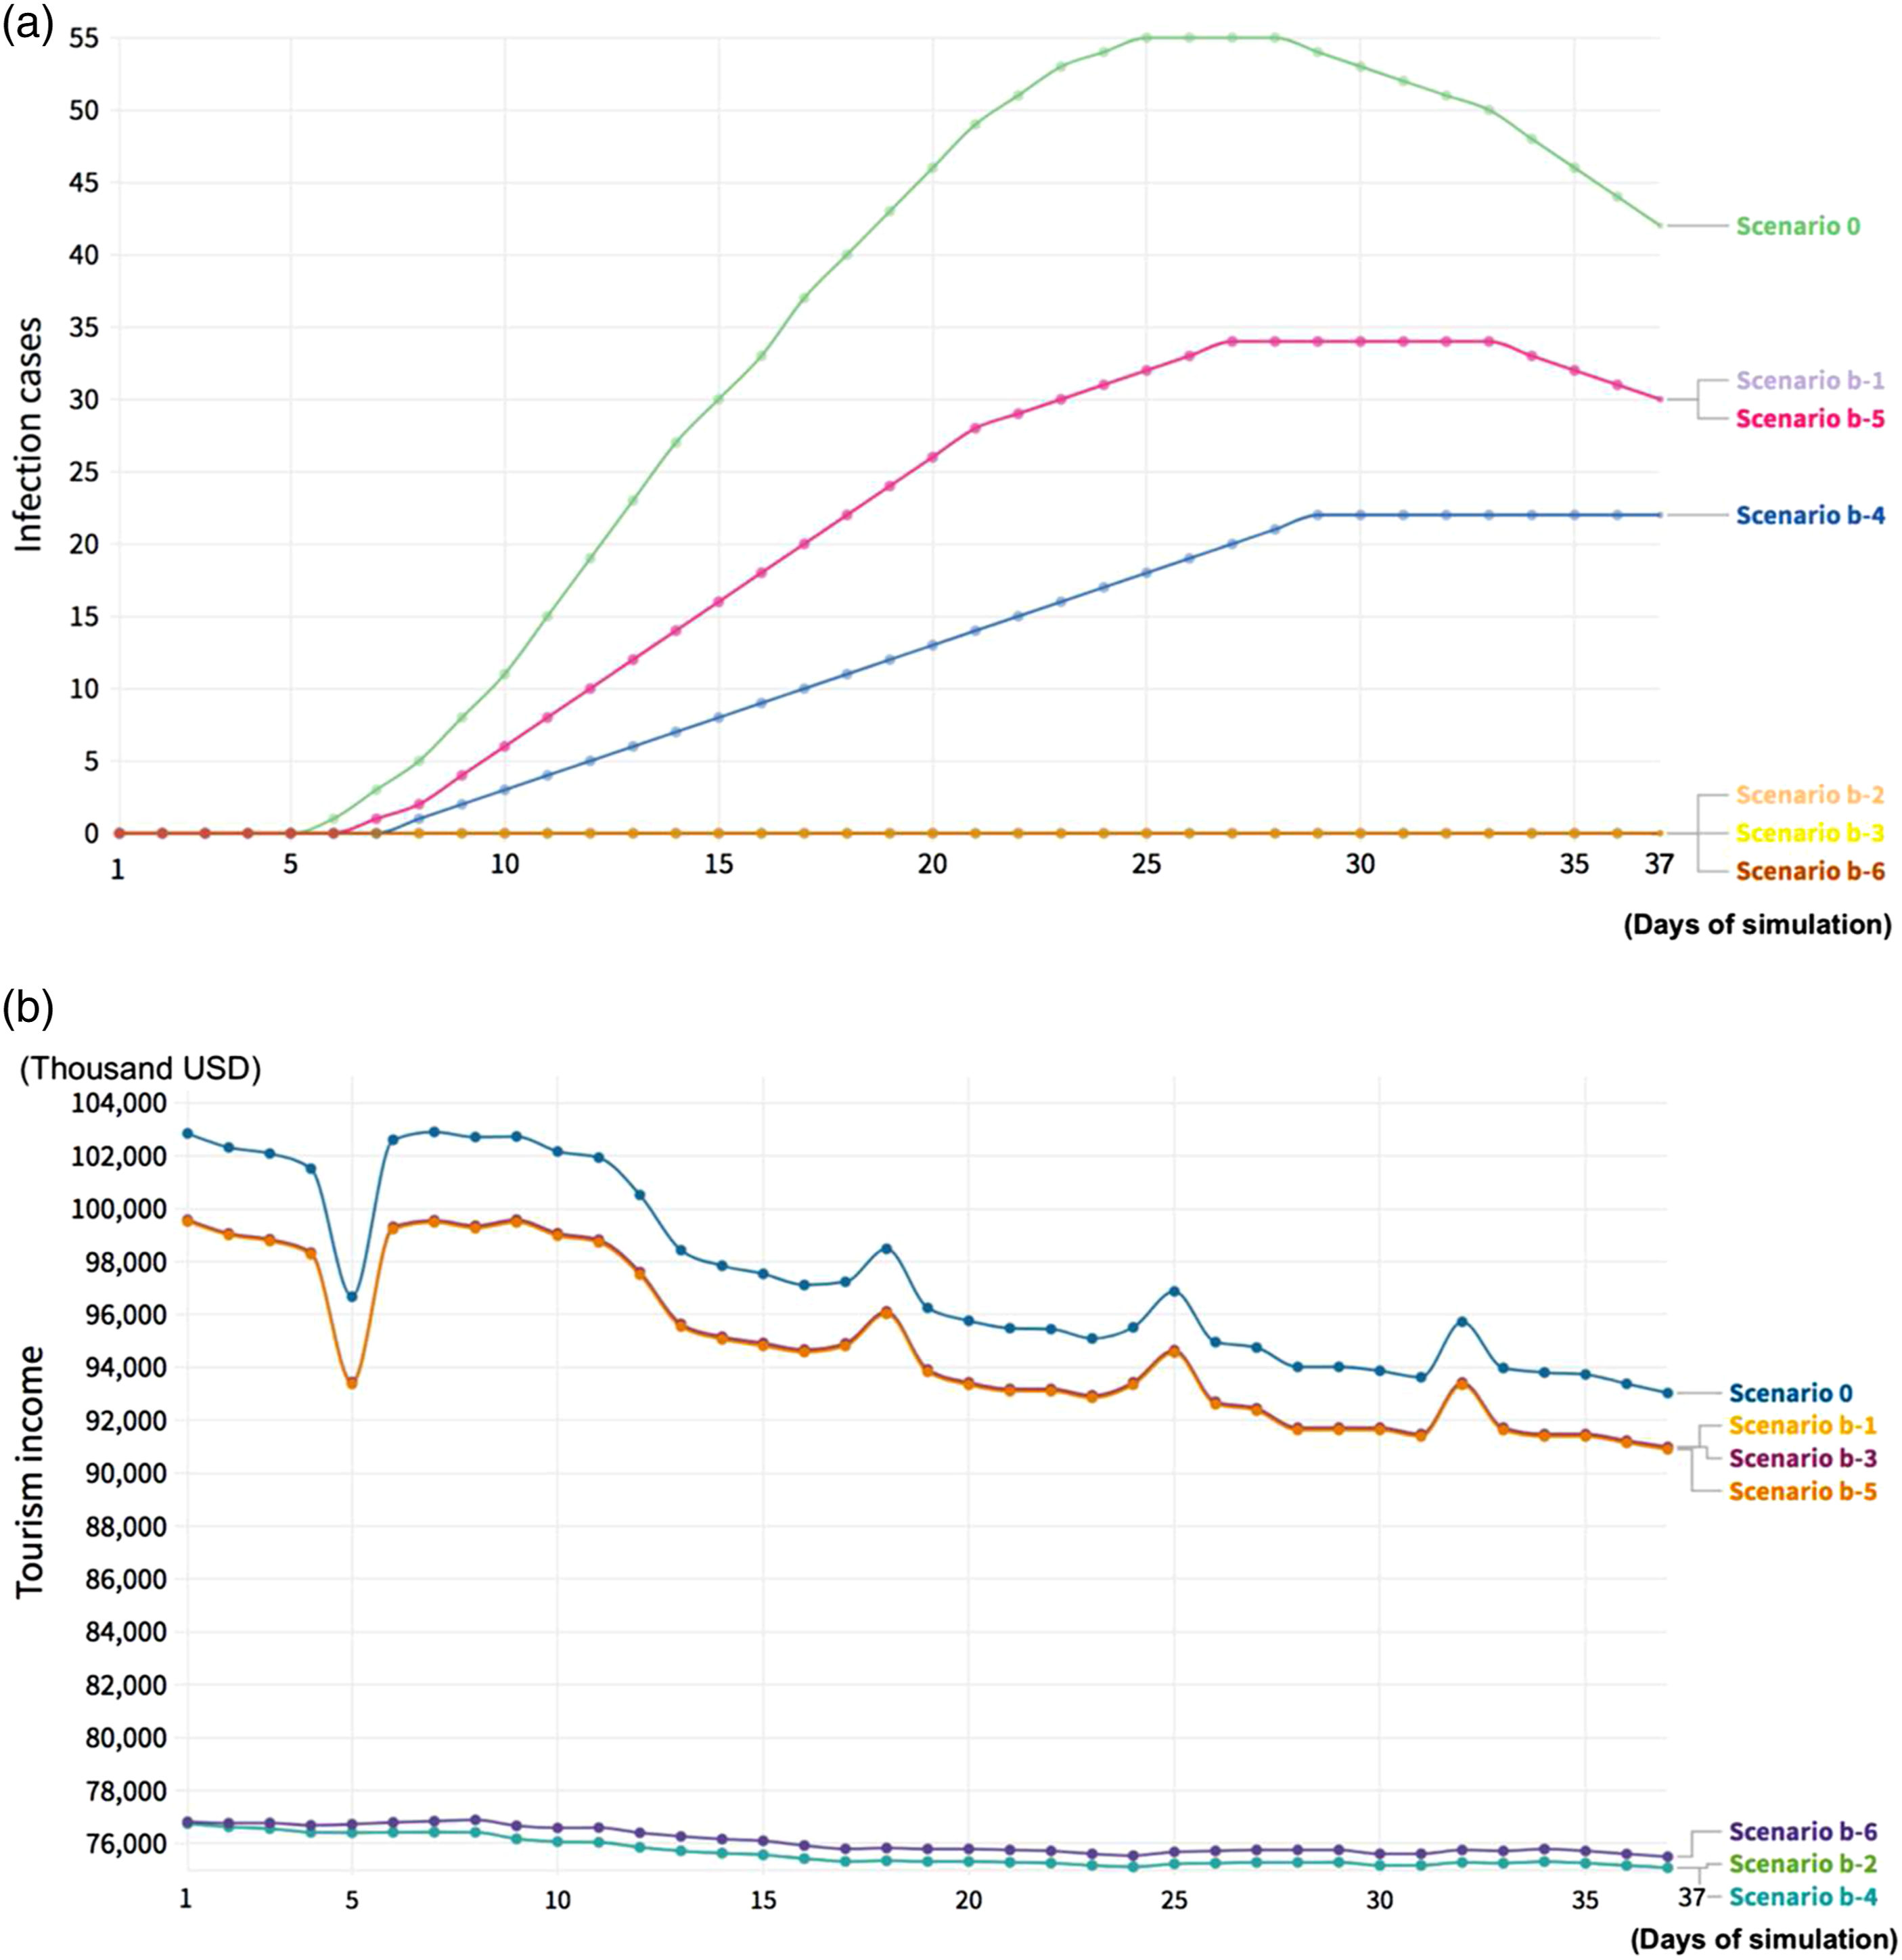
Policy packaging scenarios: partially effective
In Subsection 5.2, it is assumed that all selected policies are fully effective. However, in reality, no policy is 100% effective. Therefore, for those six scenarios with packaged policies, the original assumption that “the selected policies are fully effective while other policies have no impact” is modified here to “each of the prioritized policies has an efficacy of 80%, and each of the other policies only has an efficacy of 20%” (hereafter, named the 80%/20% assumption). For instance, Scenario 1, that is, a bottom-up strategy oriented scenario, assumes that both policies of “tourist-centered protection” and “enterprise-led protection” are 80% effective, while other polices including international transportation bans, domestic transportation bans, and quarantine policy are only 20% effective, respectively.
The simulation results are illustrated in Figure 11. Under different scenarios, the trends for both infection cases and tourism income are similar to those estimated under the original assumption, but as expected, infection cases increased and tourism income decreased because of the partial effectiveness of each policy. Comparison of (a) the number of infection cases and (b) tourism income of six combined policies scenarios.
Looking at infection cases, the policy packages showing the highest performance among all scenarios are those assumed in Scenario 2, Scenario 3, and Scenario 6, while tourism income results suggest that Scenario 1, Scenario 3, and Scenario 5 are effective. Therefore, under the 80%/20% assumption, Scenario 3 is most effective to control the virus and facilitate the tourism economy. In other words, packaging policies of prioritizing quarantine and tourist behaviors and enterprise-led protection with the complementary support of both international and domestic traffic bans is the most effective way, by comparing all six types of packaged policies. Policies with only traffic bans (Scenario 4) lead to fewer infection cases than Scenario 1 and Scenario 5; however, the difference is much smaller than that with Scenario 2, Scenario 3, and Scenario 6.
Conclusion
In this study, we developed an SD model to explore effective COVID-19 policies for developing countries with a high dependence on tourism, using Cambodia as a case study. The model includes three subsystems of disease transmission, transportation, and tourism. It is used to simulate five policies, namely, international transportation bans, domestic transportation bans, quarantine policy, tourist-centered protection, and enterprise-led protection, both separately and jointly. To do this, five single-policy scenarios were first examined, and two sets of six scenarios with packaged policies were then compared, with a focus on policy effectiveness.
The main findings of this study are summarized below. • A comparison of results from all scenarios suggests that quarantine policy is the most effective policy to control the spread of COVID-19, while maintaining tourism development. The infection cases could remain stable at zero with extremely strict quarantine policies, while the decline of tourism income could be kept at a very slow pace. • Concerning how to package different policies, the tourism-oriented policies consisting of quarantine policy, tourist-centered protection and enterprise-led protection measures show the highest performance for both virus prevention and economy facilitation, among all scenarios. • Top-down policymaking and stakeholders-conscious policymaking are effective to control the virus spread; however, these scenarios generate negative impacts on tourism activities and income. • Bottom-up policymaking and tourist-conscious policymaking can bring more benefits for the economy via tourism.
The above findings have immediate policy implications to developing countries with similar situations like Cambodia. To control the spread of COVID-19 and at the same time maintain tourism activities, quarantine policy should be implemented together with protection measures in the tourism sector, while such policy measures should be strongly supported by laws and regulations. The laws and regulations should also allow local governments to use non-medical facilities with unoccupied spaces for isolating infected people, to punish firms, organizations and people (including tourists) who violate rules, and to provide financial and technical support as well as compensation measures. Firms obeying the aforementioned laws and regulations should be well supported, financially and technically. To support local governments to implement policies, other stakeholders (e.g., tourism enterprises, hospitality facilities, and local communities) should work together to monitor people’s anti-rule behaviors in a timely manner. These stakeholders should be well protected by the aforementioned laws and regulations.
This study has tried to address a serious policy-related question for tourism-dependent developing countries: how to balance the national economy via tourism development and at the same time, control the COVID-19 pandemic. Existing studies using SD models have only conducted limited explorations in how to support COVID-19 policymaking. This study presented a new way of utilizing SD models to guide COVID-19 policymaking at both regional and country levels and is also one of the first studies to address this question based on an SD model in the context of a developing country. The SD model built in this study explicitly incorporates the roles of key stakeholders (government, firm, and tourists), logically reflects cross-sectoral decision-making causalities (public health, tourism, and transportation), and systematically represents the above mechanisms by closely associating with pandemic impacts and control measures. This study has broadened the research horizon from the current SEIR-/SIR-based modeling analysis with indirect policy connections, to policymaking-oriented modeling analysis by directly incorporating potential policy variables and further reflecting very complicated socio-economic development mechanisms, from multi-disciplinary and cross-sectoral perspectives.
The SD model built in this study can also be easily applied to other tourism-dependent developing countries, such as Thailand, Laos, and Vietnam. It is also applicable to developed countries. In theory, such a policy-oriented analysis framework can be further applied to future pandemics and other unprecedented health-related crises. To make better use of this framework, more efforts should be made to extensively collect and accumulate relevant data (e.g., statistical data, big data, and open data), and the use of this data for emergency purposes should be guaranteed legally. Future research should be conducted to estimate the minimal requirements of data needed to support policy decisions on the magnitude of financial support.
This study is not without limitations. First, due to data availability, only a limited set of variables are included in the SD modeling analysis over a limited period. More data should be collected by involving different governmental sectors in Cambodia via an effective international cooperation framework. Second, it is necessary to implement an intensive expert survey to better address long-term issues and reflect expert opinions into the SD modeling development and policymaking scenario design. Policy scenarios should address not only immediate policy measures but also policy measures for tourism recovery and long-term strategies for transformative post-pandemic sustainable development. Lastly, it is important to make broad international comparisons of COVID-19 tourism policies with respect to both developing and developed countries.
Footnotes
Declaration of conflicting interests
The authors declared no potential conflicts of interest with respect to the research, authorship, and/or publication of this article.
Funding
The authors disclosed receipt of the following financial support for the research, authorship, and/or publication of this article: This research was financially supported by the following three research funds, where the corresponding author is the principal investigator (PI) or co-principal investigator (Co-PI). [1] PI: Cross-border regional development with diverse connectivity in Asian developing countries, Grants-in-Aid for Scientific Research (B), Japan Society for the Promotion of Science (JSPS) [No. 18KT0007]. [2] Co-PI: Overcoming Vulnerability and Restoring Social Justice in Community and Re-designing Cities by Introducing Social Distancing, Japan Science and Technology Agency [JST RISTEX Grant Number JPMJRX20J6]. [3] Co-PI: Impacts of COVID-19 on the transport and logistics sector and countermeasures, Japan Science and Technology Agency [JST J-RAPID Grant Number JPMJJR2006].
