



Abstract
The objective of this study is to test whether Travel and Tourism Competitiveness Index (TTCI) enhances tourism sector development in terms of tourist arrivals, tourism receipts, and the change in both tourist arrivals and tourism receipts. The results found that TTCI main index (Level 1) is positively associated with tourist arrivals but not tourism receipts and the change in tourist arrivals and tourism receipts. Further analysis (Level 2) reveals that while the T&T policy and enabling conditions index is positively associated with tourist arrivals, the infrastructure index is positively associated with tourism receipts. None of the Level 2 indices drives the change in tourist arrivals and tourism receipts. Among results obtained from Level 3 sub-indices, while price competitiveness, air transportation infrastructure, and cultural resources indices have a positive association with tourist arrivals, only ground and port infrastructure have a positive association with tourism receipts. Moreover, while safety and security, human resources and labor market, and air transportation infrastructure sub-indices drive a positive change in tourist arrivals, ICT readiness and natural resources drive a negative change in tourist arrivals and none of the sub-indices drives a change in tourism receipts. The study suggests several practical implications for tourism firms and policymakers.
Keywords
Introduction
Destination management is one of the most popular topics in the tourism sector since it helps managers to design more attractive destinations which impact practices of stakeholders (in)directly in the tourism sector (Constantoglou, 2020; del Mar Gálvez-Rodríguez et al., 2020; Rita and António, 2020). Hence, researchers and managers have elucidated two questions “what is destination competitiveness?” and “how is destination competitiveness measured?” by focusing on destination management theory (Crouch and Ritchie, 1999; Gelter et al., 2021). Destination competitiveness is defined as mainly outperforming competitor destinations by meeting tourists’ wants and needs (Croes, 2011; Crouch and Ritchie, 1999; Dwyer and Kim, 2003). Hence, the efforts for enhancing destination competitiveness inspired many studies in the literature focusing on components of destination competitiveness (Abreu-Novais et al., 2016; Cronjé and Du Plessis, 2020; Kubickova and Martin, 2020).
Destination competitiveness deals with the attractiveness of destinations for tourists. To measure the attractiveness of the destination, researchers have proposed models including data related to arrivals’ perception and numbers, destinations’ resources quality offered and/or prepared to arrivals, and comparison of these data with other destinations’ numbers (Crouch, 2010; Dwyer and Kim, 2003; Gomezelj and Mihalič, 2008; Gu et al., 2019; Kumar and Dhir, 2020; Mendola and Volo, 2017; Neto et al., 2020). One of the globally accepted models was developed by World Economic Forum and called as Travel and Tourism Competitiveness Index (TTCI).
TTCI is the unique and comprehensive index and used to compare countries’ or regions’ competitiveness in the travel and tourism industry (Dwyer et al., 2014; Ivanov and Webster, 2013; Mazanec and Ring, 2011). The TTCI aims to assess the policies and factors which help the tourism and travel sector development across countries (Perles-Ribes, 2014). It has three categories: travel and tourism regularity (Level 1), travel and tourism business environment and infrastructure (Level 2), and travel and tourism human, cultural and natural resources (Level 3) (Wu et al., 2012). This index is used by policymakers and considered by tourism investors; therefore, researchers have investigated its composition, relations in the composition, and its link with other travel and tourism aspects (Gursoy et al., 2009; Kayar and Kozak, 2010; Kendall and Gursoy, 2007; Petrović et al., 2017; Wu et al., 2012; Zhang et al., 2011). However, policymakers and tourism investors have limited insights into how TTCI influences tourism development in the countries and which components of this index are more relevant in promoting tourism development (Andrades and Dimanche, 2017; Kubickova and Martin, 2020). In this respect, the purpose of the study is to assess the relevancy of the Travel and Tourism Competitiveness Index (TTCI) in enhancing tourism sector development. While doing this, we followed the data hierarchy proposed by TTCI and categorized the indices as Level 1, Level 2, and Level 3. This enabled authors to analyze and show the association of every level of TTCI with tourism sector development. Unlike some prior studies which are based on a self-constructed competitiveness index (Assaf and Josiassen, 2012) 1 , the study uses standard TTCI established by the WEF (2020) following several prior studies (Das and DiRienzo, 2009; Fernández et al., 2020; Krstic et al., 2016; Webster & Ivanov, 2014). Hence, the objective of the paper is to assess the association of the TTCI with tourism development proxied by international tourist arrivals, international tourism receipts, and the change in tourist arrivals and tourism receipts. To suggest refined guidelines for policymakers, we realized the analyses under the above-highlighted three levels.
The rest of the paper presents a literature review including destination competitiveness, measuring destination competitiveness, and the link between destination competitiveness and tourism development. Second, we explain the research methodology utilized. Then, we outline our results by focusing on each TTCI level. Last, we highlight the conclusions of the study, suggest policymaking implications, set the limitations, and offer prospective research avenues.
Literature review
Destination competitiveness
The meaning of destination competitiveness relies on understanding the meaning of each word in the destination competitiveness from the tourism perspective. At the first glance, a destination is a geographic place where people visit. However, in both epistemology and ontology, it is a very dynamic concept since it holds three interrelated concepts—tourist, place, and organizations to manage this place—in its body. Therefore, since those three concepts are the ingredient of several disciplines such as management, marketing, sociology, geography, politics, and technology, the destination in tourism theory should be elaborated from two perspectives as complementary approaches—business-related practices, and socio-cultural structures (Framke, 2002). As a result, this study considers a tourist destination definition by the UNWTO (2007, p. 1) as follows:
A physical space in which a visitor spends at least one overnight. It includes tourism products such as support services and attractions and tourism resources within one daýs return travel time. It has physical and administrative boundaries defining its management, images, and perceptions defining its market competitiveness. Local tourism destinations incorporate various stakeholders often including a host community and can nest and network to form larger destinations.
As seen in the destination definition, one of the main components is business-related practice and its link with other components. For any business, competition is a central concept that helps an organization do better business practices than others do. Hence, a destination should organize its resources and capabilities better to create more attractiveness for the tourist than other destinations do. This brings how a destination competes with other destinations. To address this issue, the investigation of the link between destination and competition emerges. In this respect, to what extent does a destination manage its business-related practice with the socio-cultural structure to attract more tourists than other destinations generate destination competitiveness as a dynamic and measurable concept. This concept benefits from several disciplines like the economy, politics, technology, sociology, marketing, and strategic management (Cimbaljević et al., 2019; d'Hauteserre, 2000; Knežević Cvelbar et al., 2016; Kubickova and Martin, 2020; Novais et al., 2018). As a result, destination competitiveness makes its own stakeholders, including tourists, destination management organizations, investors, workers, researchers, and other business-related organizations or agencies. The relation between the mentioned stakeholders and destination competitiveness has produced significant literature (Abreu-Novais et al., 2016; Cronjé and Du Plessis, 2020; Segui-Amortegui et al., 2019; Teixeira and Ferreira, 2018) for public administrators and practitioners to create a more attractive tourist destination. Therefore, how we can measure destination competitiveness has remained a main question in the academy and business environment for researchers and practitioners respectively.
Measuring destination competitiveness
Measurement of destination competitiveness deals with what strengths and weaknesses the destination has, and how the destination captures opportunities to improve the attractiveness of a destination, and what shields the destination can build to eliminate or minimize the threat influencing the attractiveness of the destination. In this respect, one group of studies highlights drivers or attributes of destination competitiveness. For example, Dwyer and Kim (see 2003, p. 400) emphasized a set of indicators for destination competitiveness by highlighting five subcategories—endowed resources, supportive factors, destination management, situational conditions, demand factors, and market performance indicators. Crouch (2011) demonstrated the importance of determinant five attributes—core resources and attractors, destination management, qualifying and amplifying determinants, destination policy, planning and development, and supporting factors and resources by utilizing the analytic hierarchy process method. In addition to these, plenty of study tests destination competitiveness in different country concepts (e.g., Albayrak et al., 2018; Michael et al., 2019; Natalia et al., 2019).
The second group of studies elaborates destination competitiveness by specifying one or two factors. Goffi, Cucculelli, and Masiero (2019) evaluate Brazil’s competitiveness via sustainability factors in destination competitiveness by employing the regression model. They showed that sustainability is an important factor in destination competitiveness. Kubickova and Martin (2020) test the link between tourism area lifecycle, governance, and destination competitiveness. Natalia et al. (2019) address destination competitiveness for accessible tourism, which is one of the tourism subfields.
The last group of studies uses TTCI to assess destination competitiveness. It has been employed for evaluating different regional destinations’ competitiveness, including Mediterranean destinations (Kendall and Gursoy, 2007), Middle Eastern destinations (Gursoy et al., 2009), European Union countries (Kayar and Kozak, 2010), and the Asia Pacific destinations (Leung and Baloglu, 2013). Rodríguez-Díaz and Pulido-Fernández (2020) utilized a global analysis to identify sustainability’s association with the destination competitiveness by considering TTCI.
Destination competitiveness and tourism development
The studies highlighted in the preceding section help tourism managers and policymakers to improve destination competitiveness from a comprehensive perspective. However, practitioners and researchers have limited insights into how destination competitiveness enhances tourism development. Andrades and Dimanche (2017) focused on the relationship between destination competitiveness and tourism development in Russia. For this purpose, they used TTCI and Crouch and Ritchie’s tourism destination competitiveness model (see Crouch and Ritchie, 1999). They showed that tourism development in Russia is limited due to the destination image, infrastructure development, workforce training and education, quality management, and sustainable management.
As highlighted above literature review, most prior studies focused on measuring destination competitiveness rather than relating it to tourism development except the Russian study (Andrades and Dimanche, 2017). Therefore, our study aims to investigate the link between TTCI and tourism development from a global perspective. Moreover, we investigate the link between TTCI and tourism development by considering the hierarchy among TTCI sub-components and individual sub-indices. First, we measure overall TTCI’s association with tourism development, and then we are deepening investigation downward among indices and sub-indices to prescribe synthesized implications to tourism practitioners and policymakers. Hence, our study seeks an answer to the following research question (RQ):
RQ: Is TTCI relevant in predicting tourism development (Level 1 investigation) across the world? If yes, which of four indices (Level 2) and fourteen sub-indices (Level 3) are relevant in fostering tourism development?
Research methodology
Multiple appropriate univariate and multivariate methods are incorporated in this study. Initially, the data preprocessing step is performed. The summary of the included variables and the bivariate correlation among them are reported using descriptive statistics and Pearson’s correlation coefficients. In the baseline analysis, the formulation of the research models is summarized based on per level (Level 1–3) of the included indices as the independent variables. In the baseline research analysis methodology, the panel data analysis with the fixed-effects (FE) method is used to answer the research question.
Sample
The data screening phase is performed before further analysis. Initially, the descriptive statistical analysis showed that the included variables did not show any heavy skewness with the possible extreme values, thus, the variables were not subject to any winsorization process. Furthermore, the outlier detection process is performed using the multivariate outlier detection methodology with the minimum covariance determinant (MCD) estimator which can robustify the Mahalanobis distance (Verardi and Dehon, 2010). The MCD analysis results indicate no multivariate outliers; thus, no observation is eliminated from the sample.
Mean value of the dependent and level 1, and Level 2 indices for countries.

Variables and data
Ianioglo and Rissanen (2020) classify the factors that influence tourism development into two as demand and supply factors of which the demand factors are concerning the tourists and the supply factors are concerning goods and services, human resources, institutional, regulatory, and regional factors, and market infrastructure. Hence, our study assesses the association between the supply side (i.e., proxied by the TTCI index) and the demand side proxied by the tourist arrivals and tourism receipts.
The dependent variables, namely international tourist arrivals (IntTA) and international tourism receipts in US$ (IntTR) were adopted from prior studies for measuring tourism sector development in terms of both volume and value (respectively) (Bazargani and Kiliç, 2021; Joshi et al., 2017; Ozturk and Van Niekerk, 2014; Uyar et al., 2021). However, these two indicators were log-transformed (i.e., natural logarithm) (LN_IntTA and LN_IntTR) to reduce skewness and enhance normality (Joshi et al., 2017). Furthermore, we also measured the change in these dependent variables namely the change in tourist arrivals and tourism receipts (IntTACH and IntTRCH respectively) to assess whether TTCI drives a change in IntTA and IntTR (Ozturk and Van Niekerk, 2014). The change models are incorporated to address the endogeneity concerns such as omitted variables bias and strengthen the causality between TTCI and tourism development (Du et al., 2016; Du et al., 2020). The test variables (TTCI) are leveled at three categories adopting the categorization of the WEF (2020); accordingly, we leveled indices as Level 1, Level 2, and Level 3. In Level 1, we took the overall composite Travel and Tourism Competitiveness Index (T&T_CompMainIndex_L1) and tested its association with tourism sector development. Subsequently, in Level 2, we took four indices, namely Enabling environment index (EnablingEnvIndex_L2), T&T policy and enabling conditions index (T&TPolCondIndex_L2), Infrastructure index (InfrustructureIndex_L2), and Natural and cultural resources index (NatCultResIndex_L2) and investigated their association with the tourism sector development.
Finally, in Level 3, we took the following 14 sub-indices; Business environment subindex (BusinessEnvironment_L3), Safety and security subindex (SafetySecurity_L3), Health and hygiene subindex (HealthHygiene_L3), Human resources and labor market subindex (HumanResLabMarket_L3), ICT
2
readiness subindex (ICTreadiness_L3), Prioritization of Travel and Tourism subindex (PrioritizTravelTourism_L3), International Openness subindex (InternationalOpenness_L3), Price competitiveness subindex (PriceCompetitiveness_L3), Environmental sustainability subindex (EnvirSustainability_L3), Air transport infrastructure subindex (AirTranspInfrastructure_L3), Ground and port infrastructure subindex (GroundPortInfrastructure_L3), Tourist service infrastructure subindex (TouristServInfrastructure_L3), Natural resources subindex (NaturalResources_L3), and Cultural resources and business travel subindex (CulturalResBusinessTrav_L3). All indices in Levels 1, 2, and 3 are scaled from 1 (worst) to 7 (best). Please see Figure 1 for the hierarchy of indices based on Levels 1, 2, and 3. The hierarchy of indices concerning levels 1, 2, and 3 is drawn by the authors based on the data retrieved from the WEF (2020).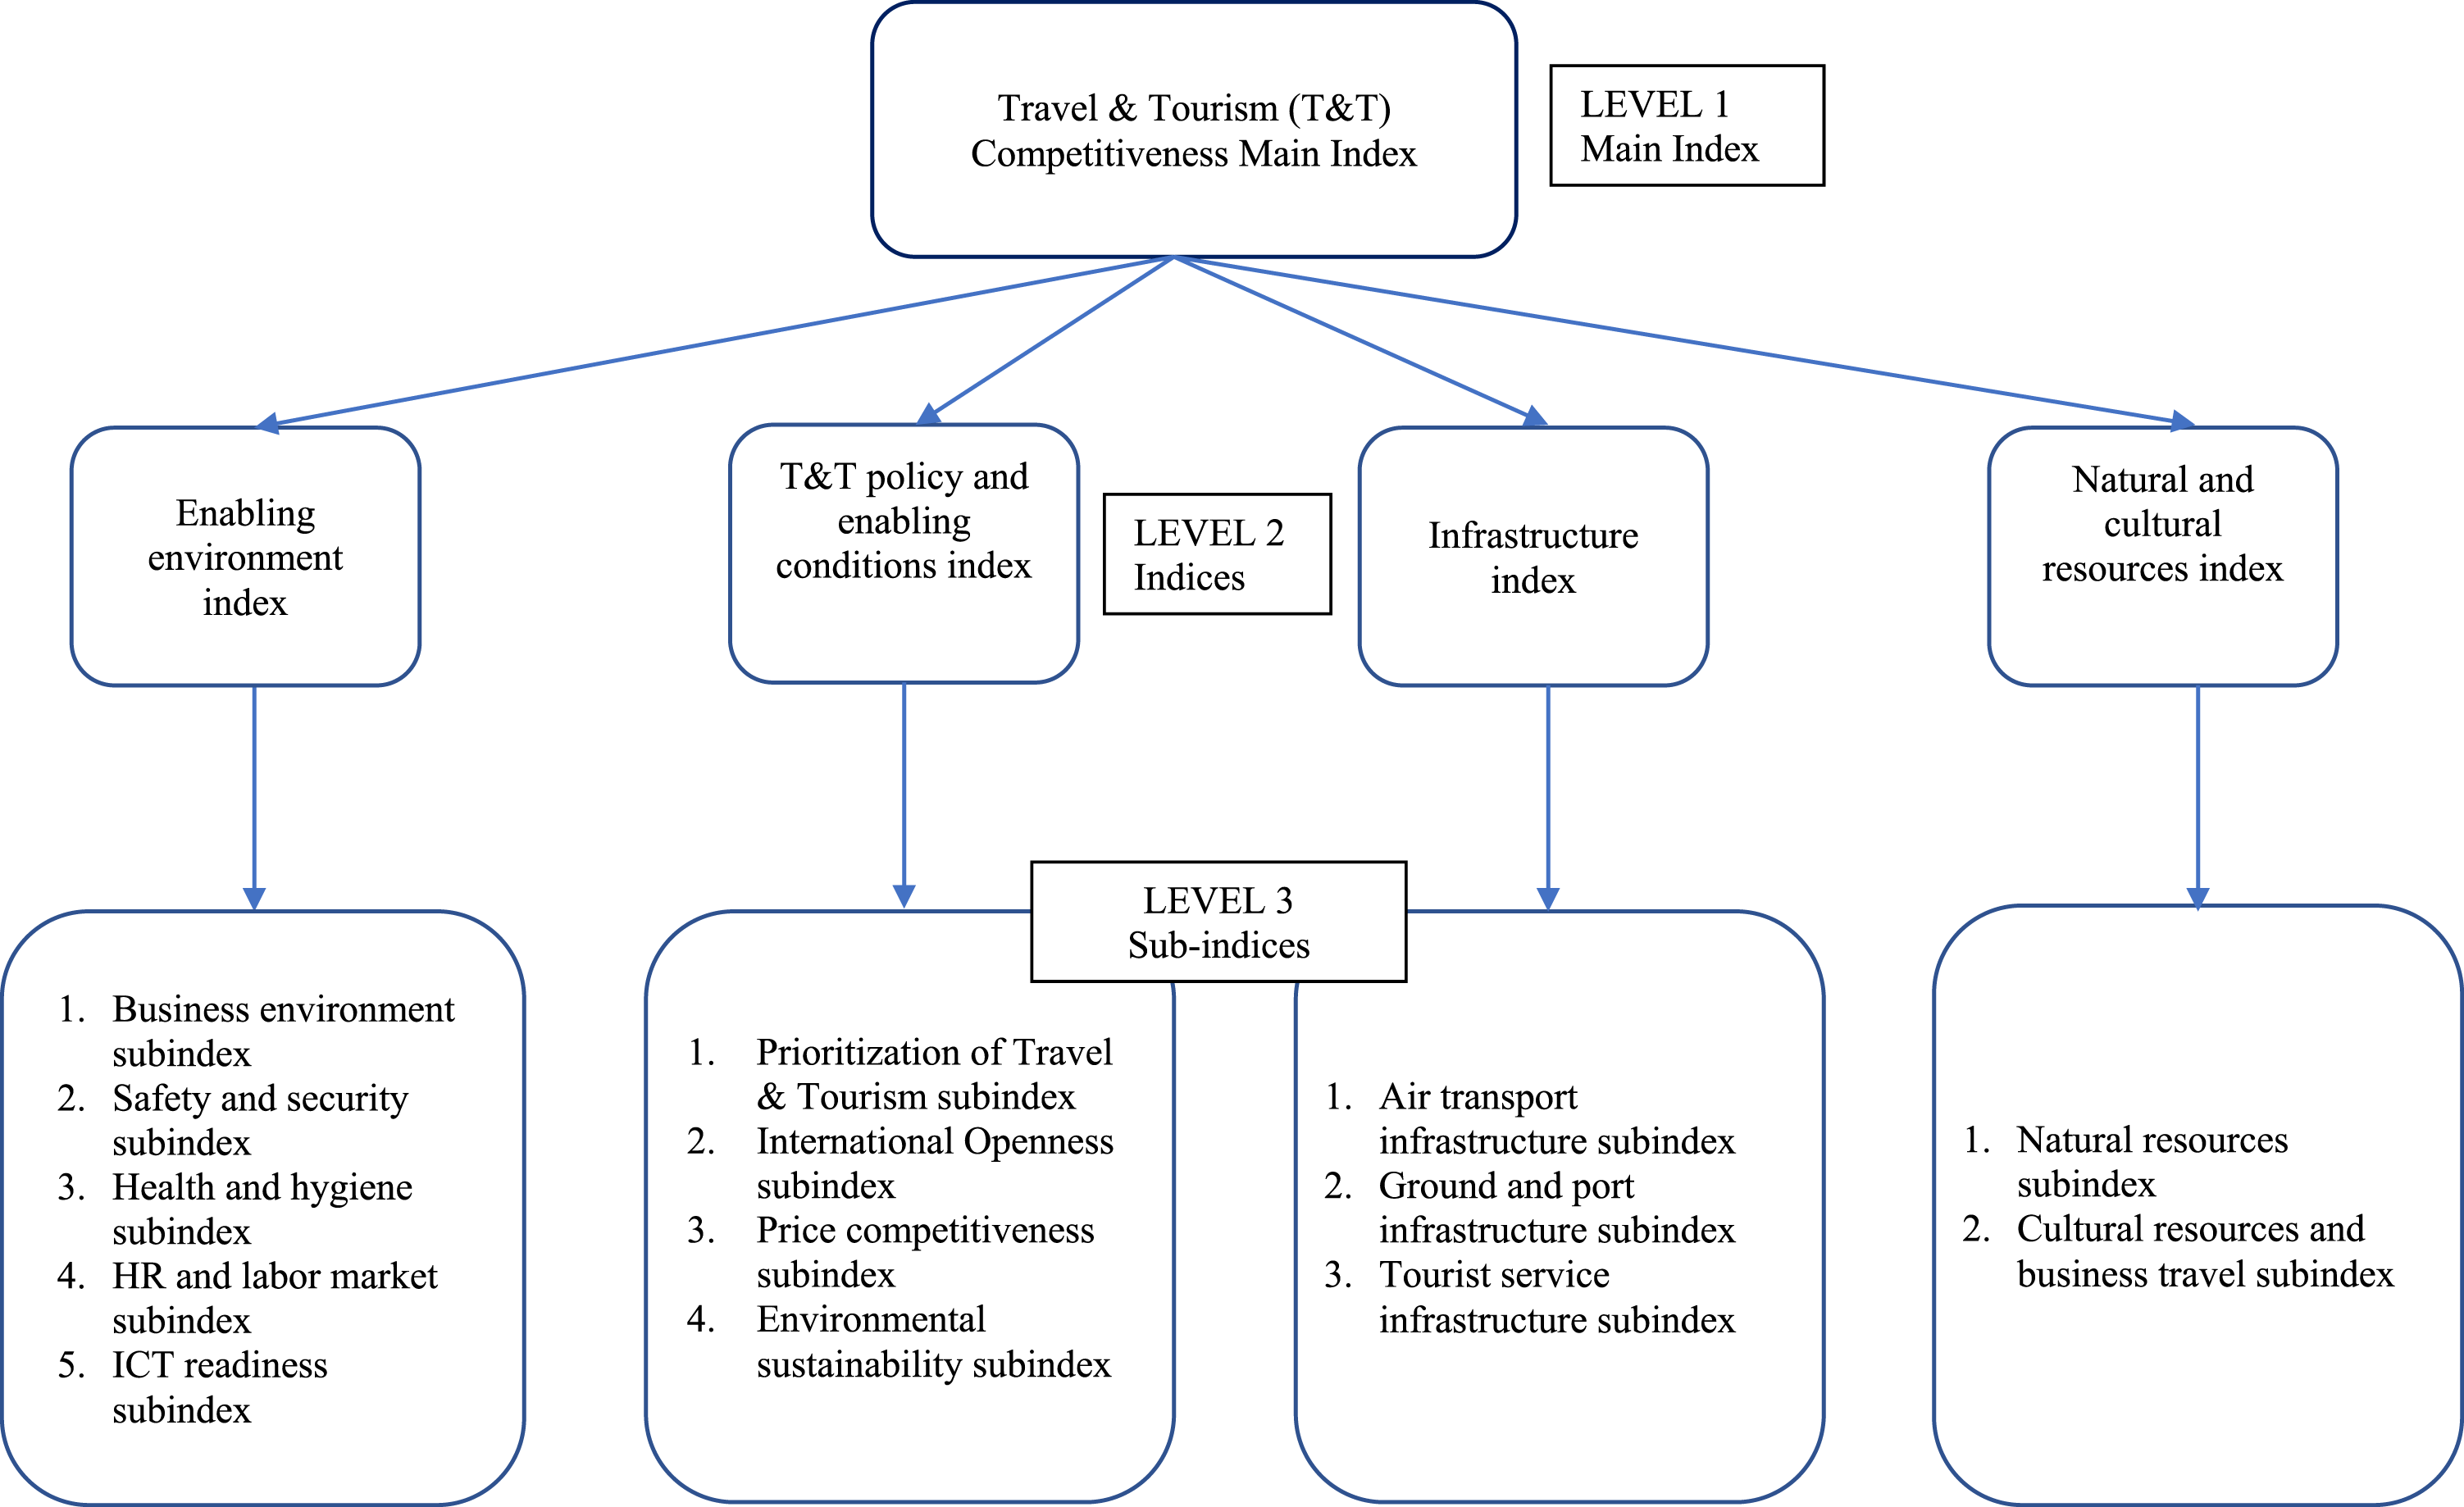
Out of TTCI, in line with prior studies (Bazargani and Kiliç, 2021; Detotto et al., 2021; Webster & Ivanov, 2014), we incorporated several control variables into the study such as the natural logarithm of gross domestic product per capita (GDP), trade (as % of GDP), the natural logarithm of population, World Governance Indicators (WGIs) 3 , and geographic regions (Region). The data for the control variables were retrieved from the World Bank (2021a and 2021b) 4 .
Empirical methodology
The empirical methodology section includes the formulation of the proposed models. For the investigation of the proposed models, panel data analysis is used due to the time-variant association characteristic of the independent variables and the dependent variables as well as the structure of the sample being in the country-year panel data format of the sample. According to Baltagi (2001), it reduces the risk of multicollinearity and estimation bias. To decide the panel data analysis with the correct estimator, various post estimations were used initially. First, the results of the F-test show that panel data analysis with fixed-effects (FE) is the most appropriate approach compared to the ordinary linear regression analysis. Second, the results of the Breusch–Pagan Lagrange Multiplier (LM) test reveal that panel data analysis with random-effects (RE) is the most appropriate compared to the ordinary linear regression analysis. Finally, the results of Hausman’s test (Hausman, 1978) show that panel data analysis with FE panel regression is the most appropriate model compared to the RE regression analysis. As a result of these post estimation analyses, the panel data analysis with FE panel regression analysis is chosen as the most appropriate multivariate analysis approach to test the proposed hypothesis.
The formulation of the proposed models is described in equation (1). The proposed models incorporate three levels
The term “
Level 1: T&T_CompMainIndex_L1.
Level 2: EnablingEnvIndex_L2, T&TPolCondIndex_L2, InfrustructureIndex_L2, and NatCultResIndex_L2.
Level 3 I. BusinessEnvironment_L3, SafetySecurity_L3, HealthHygiene_L3, HumanResLabMarket_L3, ICTreadiness_L3, II. PrioritizTravelTourism_L3, InternationalOpenness_L3, PriceCompetitiveness_L3, EnvirSustainability_L3, III. AirTranspInfrastructure_L3, GroundPortInfrastructure_L3, TouristServInfrastructure_L3 IV. NaturalResources_L3, and CulturalResBusinessTrav_L3. Furthermore, the term “ In the functional relationship, the index “i” shows the Country as the panel variable and the index “t” represents the years as the time variable while the term “ In the further analysis, the heteroscedasticity-consistent standard errors using Huber–White standard errors (Huber, 1967; White, 1980) are reported to alleviate any possible risk of heteroskedasticity within-panel serial correlation in the idiosyncratic error term (” According to Wooldridge (2010), the fixed-effects panel data regression analysis alleviates the possible risk of omitted variable bias by estimating the amount of changes within countries as the panel variable across years as the time variable. Therefore, any possible risk of omitted variable bias is addressed by incorporating panel data analysis with the fixed-effects estimator.
Findings
Descriptive statistics
Descriptive statistics.

Correlation analysis
Pearson’s correlation coefficients between dependent variables, level 1, level 2 indices, and control variables.

*p < 0.05.
Pearson’s correlation coefficients between dependent variables, Level 3 (Standard) Indices, and control variables.

*p < 0.05.
The risk of multicollinearity is addressed using the Variance Inflation Factors (VIFs) approach. The results of VIFs indicate that there is no risk of multicollinearity since the VIFs of the independent variables are significantly less than the cut-off value of 10 (Hair, et al., 2010).
Empirical findings
Fixed-effects linear panel data analysis (level 1: Main index).

t statistics in parentheses.
*p < 0.10.
**p < 0.05.
***p < 0.01.
Fixed-effects linear panel regression analysis (Level2).

t statistics in parentheses.
*p < 0.10.
**p < 0.05.
***p < 0.01.
Fixed-effects linear panel regression analysis (Level3).

t statistics in parentheses.
*p < 0.10.
**p < 0.05.
***p < 0.01.
Discussion, conclusions, and implications
The objective of this study is to test whether TTCI is associated with tourism sector development. For this purpose, the data were gathered from the WEF (2020) concerning the TTCI and the World Bank (2021a; 2021b) concerning the control variables. The study adopts four proxies for measurement of the tourism sector development; international tourist arrivals, international tourism receipts, and the change in arrivals and receipts to explore test variables’ association with the volume and value generation for the sector. Moreover, TTCI indices were measured in three steps: Level 1 (main index), Level 2 (indices), and Level 3 (further sub-indices). Hence, the study aims to provide detailed policymaking implications helpful for developing new strategies for the advancement of the tourism sector in nations. It also aims to provide implications for practitioners for the enhancement of destination attractiveness.
The results find that TTCI main index (Level 1) is positively associated with tourist arrivals but not tourism receipts and the change in tourist arrivals and tourism receipts. Further analysis (Level 2) reveals that while the T&T policy and enabling conditions index is positively associated with tourist arrivals, the infrastructure index is positively associated with tourism receipts. None of the Level 2 indices drives the change in tourist arrivals and tourism receipts. Among results obtained from Level 3 sub-indices, while price competitiveness, air transportation infrastructure, and cultural resources indices have a positive association with tourist arrivals, only ground and port infrastructure have a positive association with tourism receipts. Moreover, while safety and security, human resources and labor market, and air transportation infrastructure sub-indices drive a positive change in tourist arrivals, ICT readiness and natural resources drive a negative change in tourist arrivals and none of the sub-indices drives a change in tourism receipts.
The ground and port infrastructure’s positive association with international tourism receipts is in line with an African study (Adeola and Evans, 2020). The findings also partially confirm the result of Fernández et al. (2020) 5 that found air transport infrastructure and cultural resources are the prominent factors in fostering countries’ competitiveness. Although Adeola and Evans (2020) and Kumar and Kumar (2020) found a positive association between ICT and tourism development, Lee et al. (2021) found both positive and negative associations between the two variables across varying tourism quantiles. Hence, with our negative finding, the association between ICT and tourism development justifies further research. Moreover, even though the positive association between cultural resources and tourism development is in line with a European study, the negative association between natural resources and tourism development contradicts it (Romão, Guerreiro and Rodrigues, 2013) 6 . Previously, Ghaderi et al. (2017) found that while security is positively associated with the number of tourist arrivals in developed nations, it is negatively associated with the number of tourist arrivals in developing countries. Hence, we provide additional worldwide evidence on the association between safety and security and a change in the number of tourist arrivals.
The study suggests several practical implications for policymakers associated with the tourism sector development and for tourism sector professionals 7 ; they are suggested to consider the results by segregating differential outputs for tourist arrivals, tourism receipts, and the change in these two metrics since some countries’ focus might be enhancing the tourism development through attracting more tourists some others’ focus might be generating greater tourism receipts. The results might be of interest to tourism and culture ministries, chambers of tourism, local administrations who wish to expand tourism volume and value within the economic development of the countries. The results suggest that TTCI could be relevant in the tourism development of nations, but it is essential to focus on relevant factors. The significance of the price competitiveness index in association with tourist arrivals but not tourism receipts may imply that ticket taxes and airport charges, hotel price index, fuel price levels play role in attracting more tourists but not generating greater receipts. Another major factor associated with tourist arrivals and also increase in tourist arrivals is air transport infrastructure which implies the quality of the infrastructure, available domestic and international seat kilometers, aircraft departures, airport density, and the number of operating airlines. On the other hand, ground and port infrastructure such as quality of roads, road density, railroad infrastructure and density, quality of port infrastructure are potentially significant drivers of tourism receipts which imply that they play a role in stimulating tourism revenues by facilitating tourists’ mobility within the country.
The countries who wish to increase tourist arrivals are suggested to increase safety and security precautions such as reducing business costs of crime, violence, and terrorism, enhancing the reliability of police services, and homicide rate. Besides, human resources and the labor market also spur an increase in tourist arrivals which is enabled by higher primary and secondary education enrollment rates, staff training, and well treatment of customers. Furthermore, the positive finding for cultural resources index in association with tourist arrivals imply that tangible and intangible cultural sites and resources, sports stadiums, and hosting international events and meetings play a role in attracting a greater number of tourists. We refrain from suggesting detailed implications due to the inconsistent results between our study and some prior studies particularly for the association between ICT and natural resources and tourism development. The contradicting findings on these associations suggest more future studies to explore in what way ICT could stimulate tourism development and what the motivation or discouragement is behind natural resources and tourism development. The latter investigation invites researchers to consider regulatory factors and tourism policies of the countries too since they might be encouraging or constraining tourists’ interests.
The findings suggest implications for tourism firms too; they can strive for the betterment of the significant factors associated with TTCI as long as the factors are within the scope of their authority. For example, although ensuring infrastructure quality is beyond their authority, they can set more competitive prices, enhance safety and security precautions in the establishments and amusement parks, and improve human resources. Concerning policymaking and infrastructure issues, the private sector can contribute to the agenda-setting of chambers of tourism and local administrations and help authorities recognize the sector’s and tourists' expectations.
The study has several limitations. The period of the study is limited to the available number of years in the data source (WEF, 2020). Moreover, all the data concerning TTCI is drawn from a single source; this may impose a limitation particularly for survey-based indicators embedded in the TTCI. However, some items were drawn by WEF (2020) from other sources such as purchasing power parity and fuel price levels were taken from the World Bank, and bilateral air service agreements were received from the World Trade Organization. Future studies might be designed to focus on the outcomes of some specific indices of TTCI (e.g., sustainable tourism index) such as on economic growth or environmental performance. Moreover, some studies might deepen the investigation and focus on insignificant or negative indices and explore underlying reasons behind those indices’ insignificant or negative associations with tourism sector development. In addition to quantitative studies, qualitative studies based on interviewing policymakers could reveal complementary findings and explain why and how.
Footnotes
Declaration of conflicting interests
The author(s) declared no potential conflicts of interest with respect to the research, authorship, and/or publication of this article.
Funding
The author(s) received no financial support for the research, authorship, and/or publication of this article.

Notes
Appendix
Author iographies