



Abstract
Tourism demand nowcasting is generally carried out using econometric models that incorporate either macroeconomic variables or search query data as explanatory variables. Nowcasting model accuracy is normally evaluated by traditional loss functions. This study proposes a novel statistical method, the monotonicity test, to assess whether the nowcasting errors obtained from the ordinary least squares, generalised dynamic factor model and generalised dynamic factor model combined with mixed data sampling model are monotonically decreasing when new data on explanatory variables become available, based on the mixed frequency data between 1 January 2011 and 31 December 2019. The results of the empirical analysis show that nowcasts generated results based on two data sources combined are superior to that based on a single data source. Compared with traditional loss functions, the monotonicity test leads to a more objective and convincing nowcasting model performance. This study is the first attempt to evaluate tourism demand nowcasting performance using a monotonicity test.
Introduction
The development of tourism in Greater China, which encompasses Hong Kong, Macau and Taiwan along with the mainland of China, has contributed greatly to the tourism industry across Asia and the wider world (Li, 2009). Factors that have spurred tourism development within Greater China include geographical proximity, cultural similarities, rich natural and cultural resources, diverse cuisines and minimal language barriers. In addition, the opening of the Hong Kong–Zhuhai–Macau bridge in 2018 further stimulated travel between the mainland of China and the two special administrative regions. As a result, travel within Greater China is now more cost-effective for Chinese mainland residents, for whom Hong Kong, Macau and Taiwan have become preferred tourism destinations. Against this backdrop, scholars are gradually paying more attention to tourism demand forecasting in Greater China (Li, 2009). This study adds an additional dimension to this line of research.
The vital role that the tourism industry plays in economic development and social and cultural exchange is widely recognised (Wan and Song, 2018). Tourism destinations routinely use scientific methods to market and manage tourists’ experiences to increase the appeal of tourism products and services (Song and Li, 2008). Tourism is considered a key engine of economic growth (Jiao et al., 2020). According to the United Nations World Tourism Organization (UNWTO, 2020), the growth rate of international tourism exceeded the growth rate of the global economy in 2019. In the same year, tourism contributed around 10% to global gross domestic product (GDP) and accounted for a similar percentage of jobs created globally (WTTC, 2019). For destinations heavily reliant on the tourism industry, accurate forecasting of future tourism demand has become increasingly important for developing effective strategies and policies (Kulshrestha et al., 2020). In addition, tourism-related organisations, such as marketing agencies, airlines and transportation providers, have a great interest in monitoring real-time tourism demand fluctuations, known as nowcasting (Hirashima et al., 2017). Although tourism demand nowcasting has received increasing attention in recent years, research on ways to assess the accuracy of nowcasting methods has lagged.
Broadly, nowcasting aims to predict economic activities in the immediate future (e.g. the days and weeks ahead). Therefore, nowcasting could also be classified as short-term forecasting (Castle et al., 2009). In economics, nowcasting is used to deal with delayed data publication (Jackman and Naitram, 2015). Given the importance of nowcasting, the accuracy of nowcasting techniques deserves closer attention. Similar to forecasting accuracy, nowcasting accuracy can be measured with traditional loss functions such as the root mean squared error (RMSE), the mean absolute percentage error (MAPE), the mean absolute error (MAE), the mean squared forecast error (MSFE), the root mean squared percentage error (RMSPE), and Theil’s U statistic (Li et al., 2005). However, the effectiveness of these measures declines as high-frequency data is continuously added to the recursive model estimation process, especially when the nowcasting ranges are shorter than the official data publication frequencies (Fosten and Gutknecht, 2020; Patton and Timmermann, 2012). Therefore, this study proposes using a monotonicity test to evaluate the performance of nowcasting models. Whilst such a test has been shown to be very useful in evaluating the performance of GDP nowcasting models (Bańbura and Modugno, 2014; Bragoli and Fosten, 2018; Knotek and Zaman, 2017), there has been no attempt to evaluate tourism demand nowcasting performance using a monotonicity test. This study makes an important contribution for the tourism demand nowcasting literature to fill this gap.
Another contribution of this study is that the nowcasting model specification used includes high-frequency explanatory variables based on existing econometric models used in tourism demand forecasting. Tourism demand research has generally used macroeconomic variables or search query data as explanatory variables (Antolini and Grassini, 2019; Höpken et al., 2019), but few studies have combined these two data types in modelling and nowcasting tourism demand. Studies (Pan et al., 2012; Wen et al., 2019) have shown that there are drawbacks to forecasting tourism demand solely using macroeconomic variables. Indeed, as the digital transformation increasingly takes hold, real-time search query data may better explain people’s intention to travel. Thus, adding search query data or online big data as explanatory variables may substantially improve the nowcasting model’s performance compared with traditional univariate time series models (Hirashima et al., 2017). This study constructed four nowcasting models with two different data sources, macroeconomic variables and the Baidu index, to generate the nowcasting results of tourism demand from the mainland of China to three destinations. The purpose is to examine whether the performance of nowcasting models may improve as new information is added to the model estimation. In addition, we use a mixed frequency time series model to nowcast tourist arrivals based on search query data and macroeconomic variables.
The rest of the study is organised as follows. Literature Review section reviews the literature and describes the methods used in tourism demand nowcasting research. Methodology and Data section introduces the nowcasting models, process, evaluation and data. Empirical Results section presents the empirical results, with a particular focus on the nowcasting results and their accuracy based on the monotonicity test. The final section summarises the conclusions.
Literature review
Tourism, an economic activity that generates foreign exchange and creates jobs, contributes substantially to the economies of many countries (Brida et al., 2020; Yang et al., 2015). Governments and private firms are interested in accurate tourism demand forecasts, which are essential for effective planning and development of needed marketing and infrastructure (Song and Li, 2008). In the short run, the accurate nowcasting of tourism demand is also vital for enhancing business operations at mass or multiproduct tourism destinations (Emili et al., 2020) and monitoring the effectiveness of ongoing tourism-related policies (Castle et al., 2009; Jackman and Naitram, 2015).
Tourism demand nowcasting
Most published studies on tourism demand modelling and forecasting using econometric approaches have had two objectives: discovering the relationship between tourism demand and its influencing factors and generating accurate forecasts based on the relationship models estimated (Song et al., 2019). Empirical evidence has shown that macroeconomic variables, such as the source market GDP, the tourism prices in the destination relative to that of the source markets, and the substitute prices of competing destinations have an important influence on tourism demand. These explanatory variables also improve the forecasting performance of tourism demand models (Song et al., 2012; Wu et al., 2017).
Tourism nowcasting, a special form of tourism forecasting, involves modelling the immediate past and current dynamics in tourism demand and predicting the near future demand using the model established (Antolini and Grassini, 2019). Nowcasting is widely used in macroeconomic forecasts because it effectively deals with the problem caused by the time lag in statistical data releases.
Studies have generally assessed the accuracy of tourism demand forecasting and nowcasting using traditional loss functions, such as the RMSE, the MAE, the MAPE (Gunter and Önder, 2015; Jackman and Naitram, 2015; Song et al., 2009b) and the direction of change (DC) (Hassani et al., 2013; Silva et al., 2017).
Traditionally, tourism demand forecasting models are estimated using macroeconomic variables. With the growth of the digital economy, however, such traditional economic variables cannot adequately reflect real-time changes in tourism demand (Feng et al., 2019). Furthermore, due to the slow release of macroeconomic data, models using official statistics are unable to capture real-time behavioural changes in tourism demand (Bangwayo-Skeete and Skeete, 2015; Forni et al., 2000). Due to these problems, researchers have begun to model and forecast tourism demand using search query data, which are normally high frequency and real-time in nature (Valdivia and Monge-Corella (2010); Carriere-Swallow and Labbe (2013).
Incorporating search query data into univariate time series models can improve the forecasting accuracy of the target variables. For instance Pan et al. (2012) showed that introducing search query data into an ARIMA model (ARIMAX) to forecast the demand for hotel rooms resulted in superior model performance relative to a time series model without search query data. Similarly, Yang et al. (2015) empirically demonstrated that using search query data to forecast tourist arrivals in Hainan Province helped to improve forecasting performance substantially. Pan et al. (2017) combined search queries and Internet traffic data to forecast weekly hotel demand; the forecasts of the ARIMAX model that included the combined online data were more accurate than those of the ARIMA model. Similar conclusions were reached by Li et al. (2017), Wen et al. (2019), and Hu et al. (2021). However, there is also evidence that search query data cannot always produce better predictions, as forecasting performance depends on the population targeted by specific search engines (Hu et al., 2021; Li et al., 2020; Yang et al., 2015). For example the Baidu index is more useful than Google search queries for forecasting tourism demand from Chinese tourists (Volchek et al., 2019).
Search query data can reflect the latest consumer intention, especially those related to new socio-economic phenomena. This information can supplement official statistics and assist business decisions (Huang and Hao, 2021). Thus, the inclusion of search query data in tourism demand forecasting models that mainly include macroeconomic variables can improve model forecasting performance (Siliverstovs and Wochner, 2018), with such data being particularly useful in understanding real-time behavioural changes (Antolini and Grassini, 2019). However, few studies have focused on combining macroeconomic variables and search query data to forecast tourism demand.
Studies have added search query data to basic time series models (Bangwayo-Skeete and Skeete, 2015; Dimpfl and Langen, 2018). This study, in contrast, includes search query data in an econometric model that contains traditional economic variables to analyse whether tourism demand nowcasting performance can be improved.
Tourism demand forecasting evaluation
The most common indexes using accuracy measures in tourism demand forecasting are the RMSE, MAE, MAPE and DC (Jiao and Chen, 2019; Silva et al., 2017), with the RMSE and MAE being the most widely used forecast error measures. Between these two measures, the MAE is more sensitive to small deviations from zero. It is less sensitive to large deviations because it is not calculated based on the squared loss values. Some scholars have used Theil’s U statistic to measure forecast accuracy (Song et al., 2009b). Another method sometimes used to evaluate model performance is the RMSPE (Gunter and Önder, 2015). Generally, however, the RMSE, MAE and MAPE are the most frequently used measures.
As just mentioned, if a model’s forecasting performance is measured by the squared forecast errors, the measure will be very sensitive to large changes in forecast errors (Gunter and Önder, 2015). Therefore, the evaluation of a model’s forecasting performance depends largely on the measure used in the assessment. Meanwhile, it is still unknown whether a tourism demand model’s forecasting accuracy can be monotonously improved as the sample size of explanatory variables expands over time. This study seeks to address this issue.
Specifically, this study uses a monotonicity test to evaluate the nowcasting performance of tourism demand models based on mixed frequency tourism demand data collected in Greater China. Nowcasting monotonicity test has been used as an evaluative criterion by policy-making institutions, such as the Atlanta Fed. It has also been used in empirical papers dating back to Giannone et al. (2008), who applied the uncertainty measurement to indicate nowcasting performance. Fosten and Gutknecht (2020) proposed a formal and robust test for nowcasting monotonicity based on the moment inequality procedure of Chernozhukov et al. (2019). The monotonicity test, which can be applied in general settings, represents the first rigorous procedure to assess nowcasting performance. Its purpose is to determine whether the accuracy of a nowcasting model using big data shows a monotonic decreasing trend as new information is continuously included in the model estimation. The monotonicity test used in our study is developed based on the multiple moment inequality procedure proposed by Corradi and Swanson (2014). This method is superior to the forecasting accuracy measures used in previous studies. Rather than using a formal monotonicity test, Marcellino et al. (2016) simply used the trend of the conventional MSFE over the forecasting period to determine whether there was a decline in forecast accuracy. Furthermore, compared with the monotonicity tests used in other studies, the one used in this study is more objective and reliable. For example this study extends the univariate monotonicity test of Bańbura et al. (2013) to multiple moment inequalities to evaluate the performance of tourism demand nowcasting models. To the best of our knowledge, our study is the first to formally test whether tourism demand nowcasting accuracy is monotonic.
In summary, the contributions of this study to the literature are presented. Firstly, although tourism demand nowcasting is attracting growing interest from tourism scholars, researchers continue to use conventional forecasting performance measures, such as the RMSE, MAE and MAPE, to evaluate the nowcasting performance of models. Evidence has shown that these forecasting performance measures become less sensitive as new observations regarding explanatory variables are continuously updated (Gunter and Önder, 2015). Secondly, studies on tourism demand forecasting have failed to include macroeconomic variables and search query data simultaneously as explanatory variables in the models. Therefore, this study is the first to use mixed frequency data in model specification and nowcasting with a novel performance evaluation method.
Methodology and data
Tourism demand nowcasting
Based on Song and Romilly (2000), the most important factors affecting tourism demand are the destination of the own price, the substitutes price and the income of consumers. The following mathematical function is used to describe the relationship between tourism demand and its influencing factors:

There are two purposes for using equation (1). Firstly, the power function better reflects the relationship between tourism demand and its influencing factors. Secondly, the power function can easily be transformed into a linear relationship through log transformation (see equation (2)), and this is easy to estimate existing estimators such as ordinary least squares. In addition, the coefficients of equation (2), apart from the constant, are demand elasticities.

Research has shown that the generalised dynamic factor model (GDFM) can produce superior nowcasting performance in tourism demand nowcast, which forms the basis of this study. Meanwhile, a mixed data sampling (MIDAS) model is used to deal with data having different frequencies. Hence, the model used for the empirical analysis in this study is known as the GDFM-MIDAS model. To use the GDFM-MIDAS model to nowcast tourism demand, we extract the optimal number of factors firstly from the available time series by the GDFM-MIDAS model. Then, these extracted factors are included in the GDFM-MIDAS model as explanatory variables for tourism demand nowcasting.
The GDFM-MIDAS model
This section introduces the GDFM-MIDAS model, focussing on the model specification and estimation. Nowcasting performance evaluation methods are also introduced. To better understand the GDFM-MIDAS model, it is essential to define the MIDAS model firstly. 1. The MIDAS model
The MIDAS model allows high-frequency explanatory variables to explain low-frequency dependent variables. Its general form can be written as follows:


The estimated MIDAS model is obtained by minimising the residuals in equation (3) 2. The GDFM model

The factor model is used to define and measure intelligence. Factor analysis aims to describe the correlation between variables using a small number of potential and unobservable factors (Li et al., 2020).
Forni et al. (2000) proposed the GDFM by extending dynamic factor models. They argued that ‘dynamic’ and ‘approximate’ are two important characteristics of a factor model to solve time series data. Firstly, analysing time series data is a typical dynamic problem. The model must allow heterogeneity to be a cross-sectional correlation for other cross-sectional data. The orthogonality assumption of heterogeneity is unrealistic for most typical dynamic problems. Therefore, the GDFM is better suited to tourism demand forecasting. It consists of two parts: its common component


One feature of the GDFM model is the estimation of common factors. For example we aim at nowcasting tourism demand using hundreds of Baidu indexes. In the GDFM framework, these observed variables can partly be explained by common unobserved factors, which are noted as common components
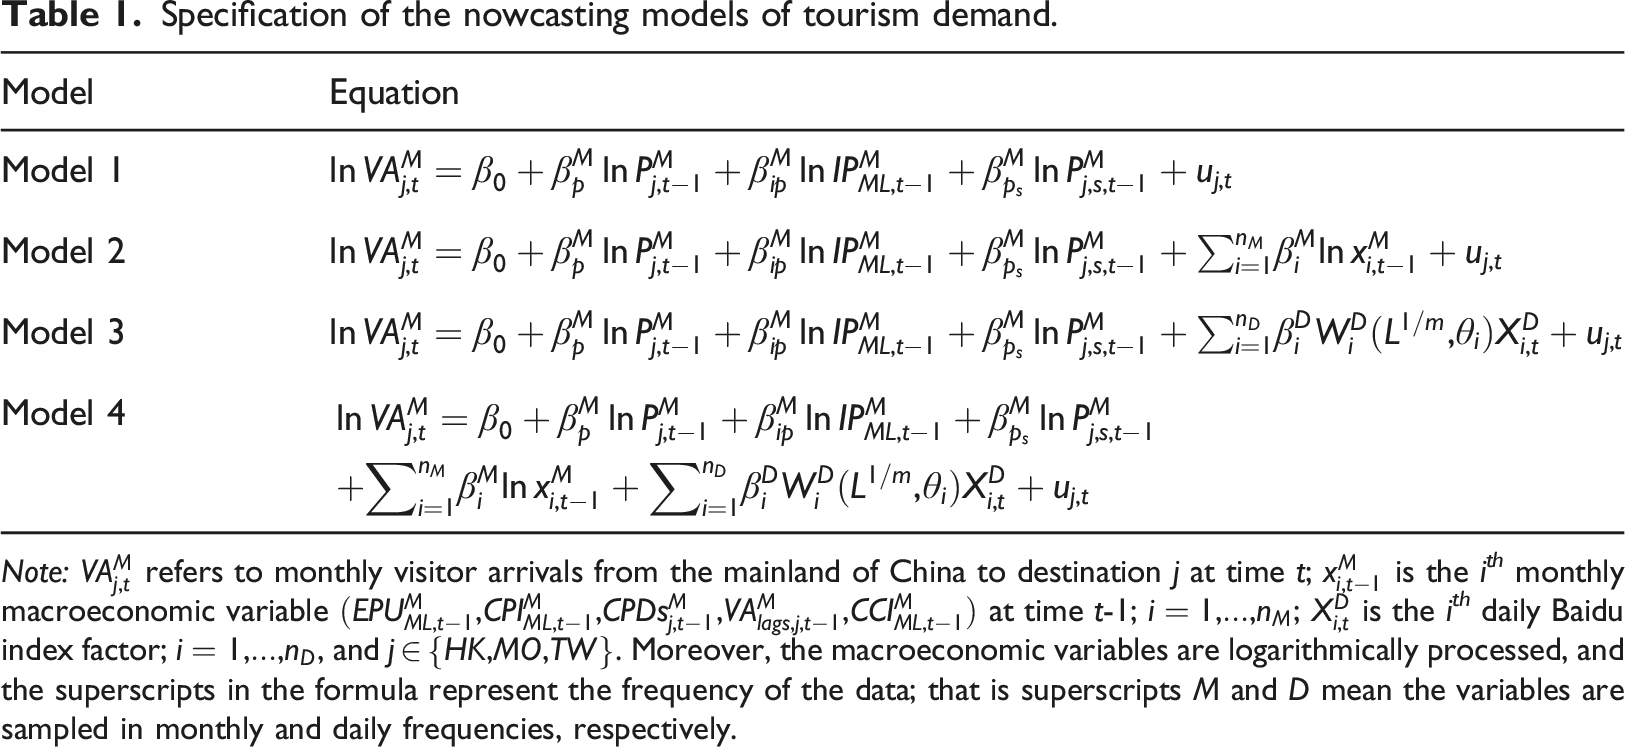
Based on Song and Romilly (2000), we can specify the three commonly used traditional variables, which are the price of the substitute destination, the price of tourism in the destination, and the per capita income in the country of origin to build Model 1. The macroeconomic factors and the factors extracted from the Baidu index are added recursively to the model. In this way, the macroeconomic and Baidu index factor model can model and nowcast tourism demand for the specific destination under consideration. The nowcasting results are then evaluated by the monotonicity test. Specifically, the GDFM-MIDAS tourism demand model can be written as follows:

Nowcasting process
Most published studies on tourism demand forecasting using search query data (Baidu index) have been based on univariate time series models, with search queries as explanatory variables (Pan and Yang, 2017; Volchek et al., 2019). This study, however, starts with Model 1 and gradually adds other macroeconomic factors and Baidu index factors.
Firstly, based on Song et al. (2011), Chatziantoniou et al. (2016), Wu et al. (2017) and Nor et al. (2018), this study incorporates the other macroeconomic variables – that is economic policy uncertainty (EPU), consumer price differentials (CPDs), consumer confidence index (CCI), consumer price index (CPI) and the logarithmic form of the lag value of visitor arrivals (VA lags ) into Model 1 to construct Model 2. The purpose of this process is to analyse whether adding different variables contributes to the nowcasting performance of the tourism demand model.
Secondly, using the GDFM-MIDAS model (Li et al., 2017), we incorporate daily Baidu index factors into Model 1 to create Model 3.
Finally, based on Model 1, the macroeconomic factors and Baidu index factors are both added to form Model 4.
Specification of the nowcasting models of tourism demand.
Note:
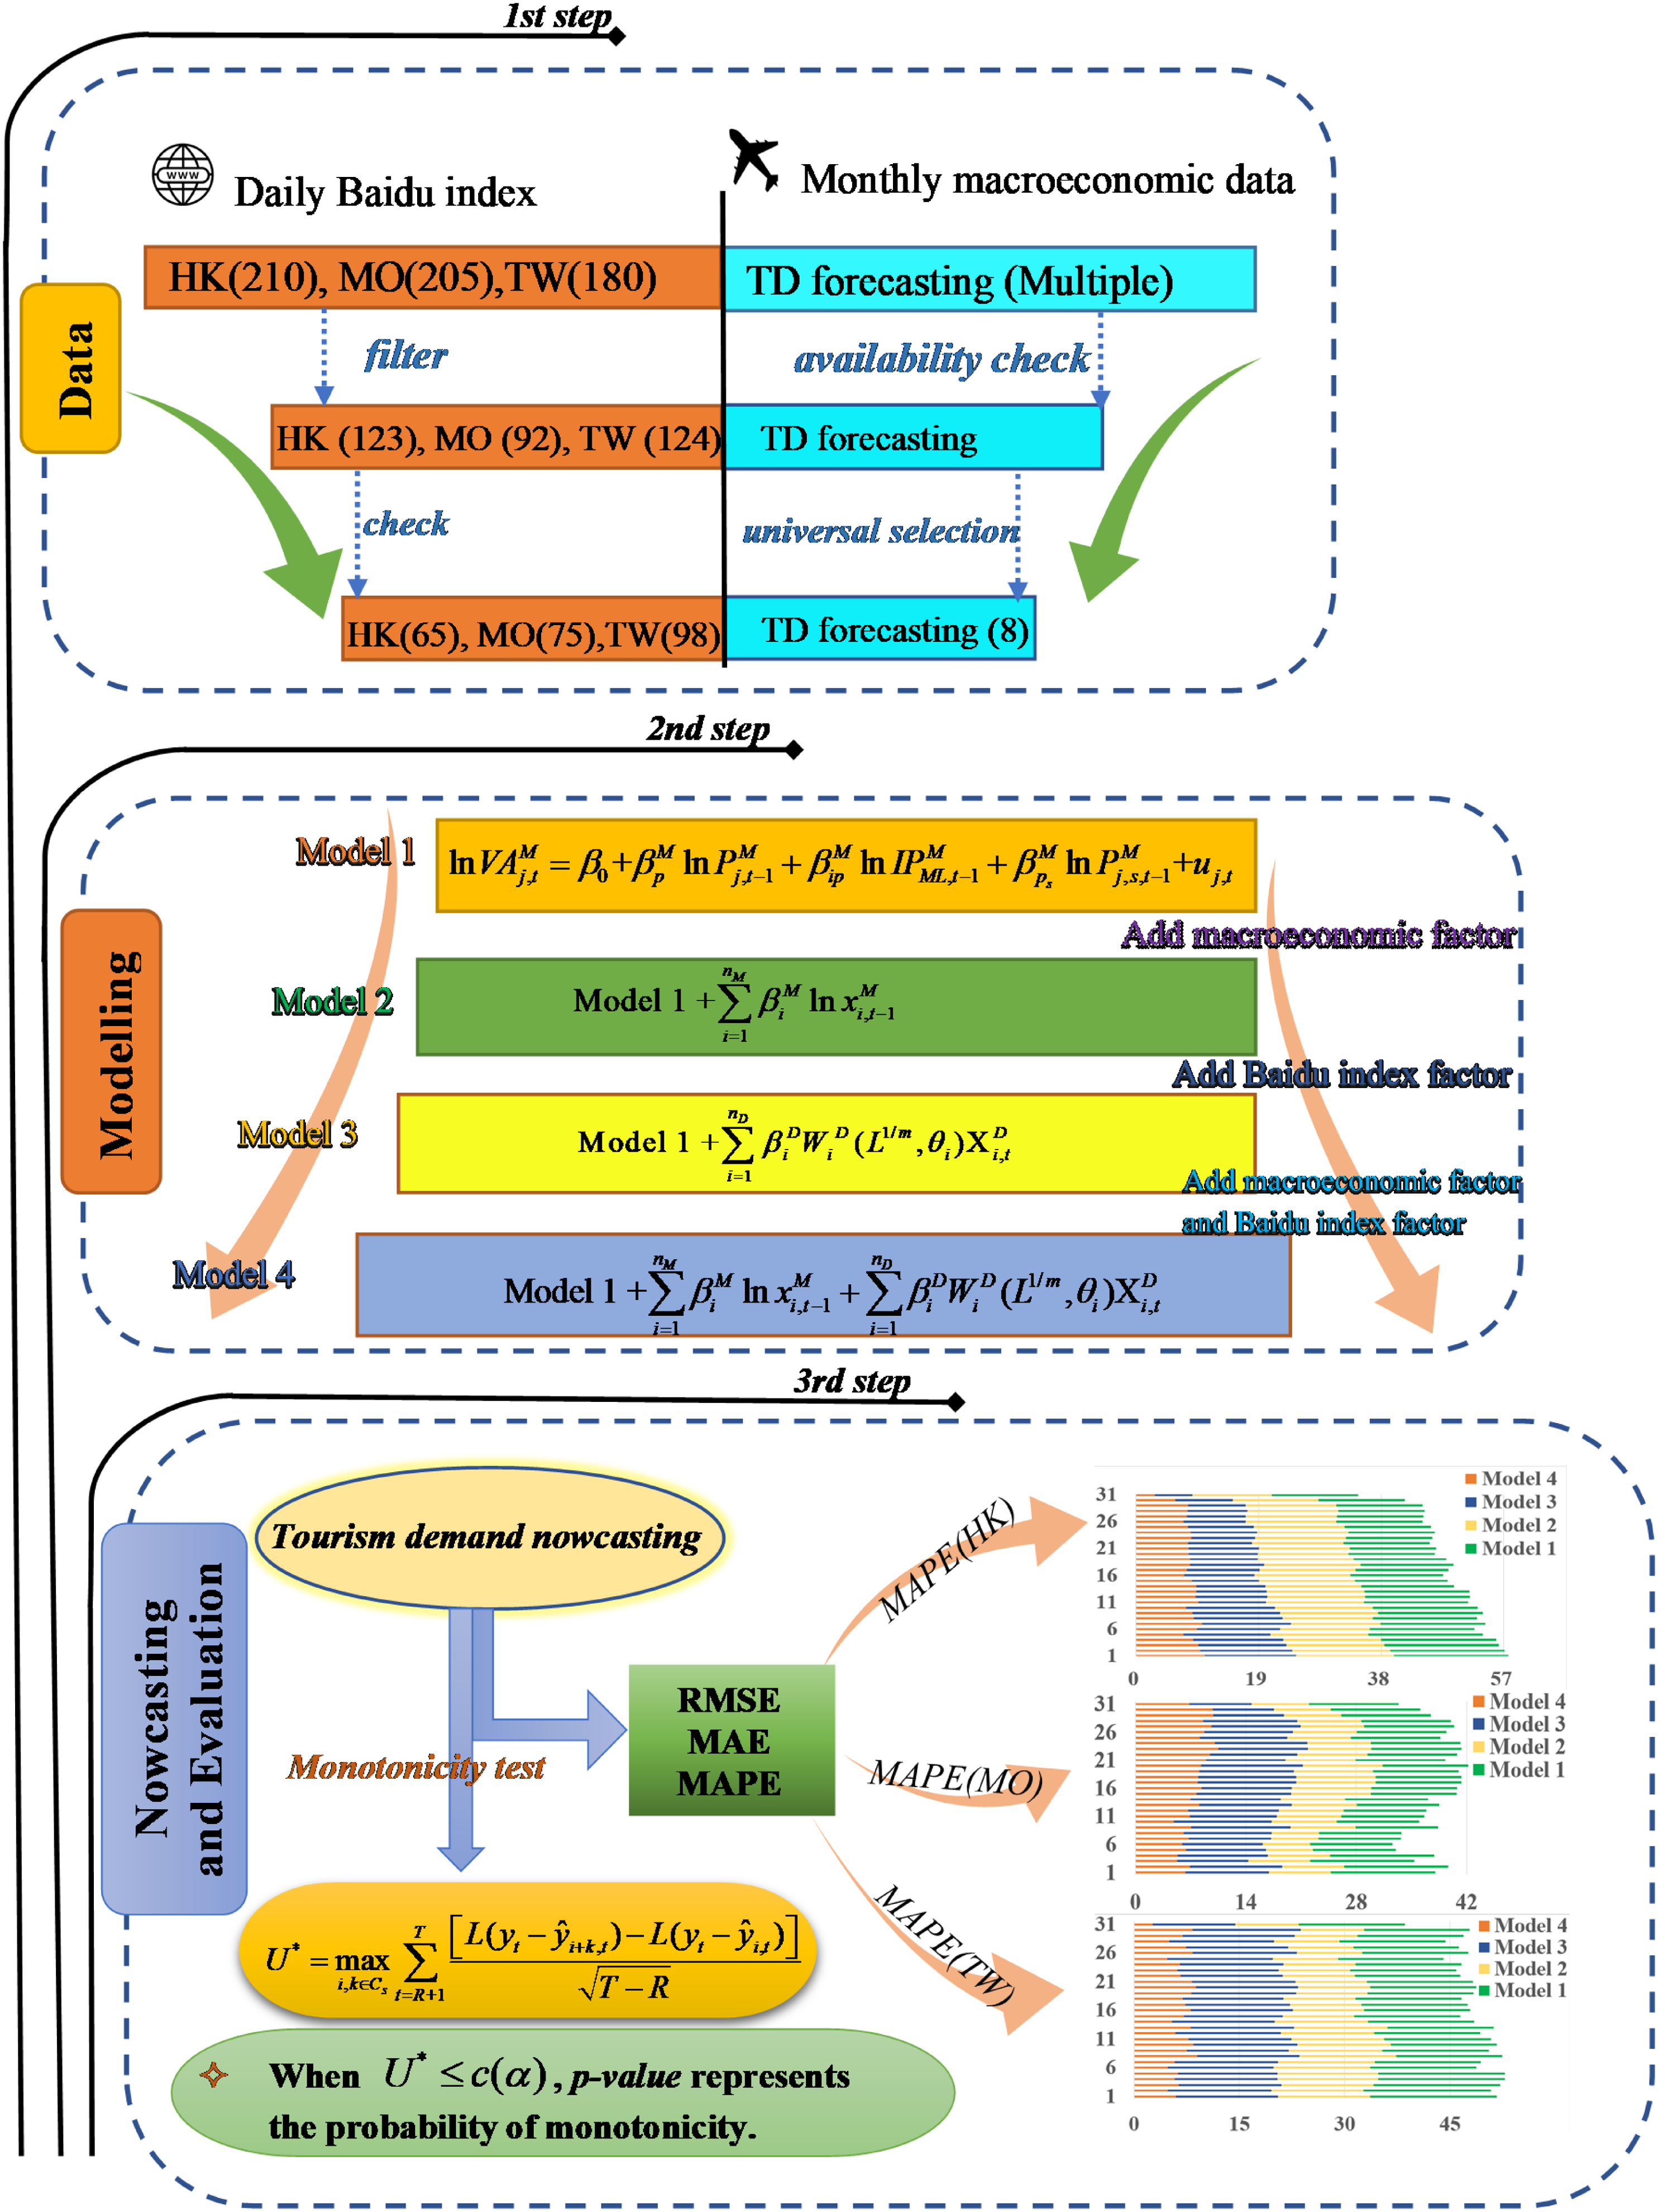
The research framework.
Based on the above comparison model, this study first analyses the nowcasting performance of models, and then generates the monotonicity test results based on the tourism demand nowcasting results from the mainland of China to three destinations. Specifically, the first step is to divide the total data sample into two parts: (1) the fitting set: data covering the period from January 2011 to December 2018 are used for in-sample estimation; (2) the nowcasting set: data covering the period from January 2019 to December 2019 are used to generate the nowcasting results. Then, the second step is to evaluate the nowcasting performance of different models constructed using different data sources.
Nowcasting evaluation
This section adopts the traditional approach and monotonicity test to evaluate the tourism demand nowcasting accuracy.
Traditional approach
Based on Models 1 through 4, this study carries out tourism demand nowcasting, and the results are evaluated using the following three measurements.


Monotonicity test
In general, most studies have used evaluation methods such as the RMSE to test whether the forecasting performance of a given method gradually improves as data are updated and added (Marcellino et al., 2016; Patton and Timmermann, 2012). This study applies a test proposed by Fosten and Gutknecht (2020) to determine whether big data nowcasting methods, which have become an important tool for many public and private institutions, monotonically improve as new information becomes available. Corradi and Swanson (2014) propose the monotonicity test, which is a formal and rigorous method used to evaluate forecasting performance based on the multiple moment inequality. The number of forecasts approaches infinity, which means that the number of moment inequalities tested can do the same; hence, this model is suitable for testing the results of factor models and other forecasts using high-dimensional data. The purpose of this study is to make a monotonic assessment of the forecast results of the explained variables
The key interest is whether nowcasting performance monotonically improves as the t month approaches the updated date of the target variable. Where L (•) is the function constructed by different kind error term of different nowcast error, for example the squared differences, absolute differences and absolute percentage errors corresponding to RMSE, MAE and MAPE. We aimed at knowing whether the nowcast error loss at a point i+k is lower than some earlier point i. Due to the limited space in the study, we used the form of a squared difference similar to the calculation of RMSE when constructing the L (•) function. The null hypothesis is formed of S(S−1)/2 moment inequalities for each pairwise comparison of nowcasting points i + k and i

This study considers all possible 
To test the null hypothesis in equation (12), we use a statistic based on the empirical moment inequalities introduced in equation (14). That is, the test statistic is the max statistic of the following form:
k
s
c
= 1 means that the moment inequality of the minimum interval to be tested is
For the monotonicity test U* ≤ c (α) U* > c (α)
U* >
The data
Tourism demand is represented by monthly visitor arrivals (VA) from the mainland of China to Hong Kong, Macau and Taiwan from January 2011 to December 2019, obtained from the Wind Database (http://www.wind.com.cn/). The tourism demand data after December 2019 had greater volatility due to COVID-19 (Wang et al., 2021; Marques et al., 2022). Therefore, the data after December 2019 were not included in this study. Figure 2 shows visitor arrivals from the mainland of China to the three other Greater China destinations (Hong Kong, Macau, Taiwan) over this period. Visitor arrivals from the mainland of China to Hong Kong, Macau and Taiwan.
The dependent variables, the eight monthly macroeconomic variables, and the daily search query data used to construct the Baidu index are collected as the determinants of tourism demand in Hong Kong, Macau and Taiwan. The monthly macroeconomic variables, which range from January 2011 to December 2019, are collected from the Wind Database (http://www.wind.com.cn/) and the CEInet Statistics Database (https://db.cei.cn/). The daily Baidu index data, which range from 1 January 2011 to 31 December 2019, are collected from the Baidu index database (http://index.baidu.com/).
Macroeconomic variables
Economic theory suggests that the tourism price of the destination, the tourism price of competing destinations, and the income of tourists are the most important factors affecting tourism demand (Gunter and Önder, 2015; Song et al., 2003, 2009a). Other macroeconomic variables considered in this study include the EPU, CCI, CPI, CPDs and
The destination of the own price 
The substitute price 1. The tourists’ living cost variable may be specified as the ratio of the destination value to the original value. 2. The tourists’ cost of a living variable may be specified as destination value relative to a weighted average value calculated for a set of alternative destinations or by specifying a separated weighted average substitute destination cost variable.
The substitute price refers to the tourism price in substitute destinations. It is usually measured by the CPI of the substitute destination or the weighted average of the CPI of a group of alternative destinations. If this price has a positive influence on tourism demand, this would suggest that the price has a substitution effect, whereas a negative effect would indicate a complementary effect (Blake and Cortes-Jiménez, 2007).
This study takes the market share of the alternative destination (the number of tourists) as the weight. The consumer price index is calculated by weighing the consumer price index of each of the four substitute destinations and making corresponding adjustments to the consumer price index. Considering geographic and cultural characteristics, we choose Thailand, Japan, Taiwan and Macau as alternative destinations to Hong Kong. Then, Thailand, Japan, Hong Kong and Macau are chosen as alternative destinations to Taiwan. Thailand, Japan, Hong Kong and Taiwan are chosen as alternative destinations to Macau. In the case of Hong Kong, the substitute destination price is calculated by
Industrial production index
Consumer price differentials 
The economic policy uncertainty
Other determinants of tourism demand include transportation costs (normally measured by oil prices), advertising expenditure, the population in the source market, the source market unemployment rate, and one-off events (Wu et al., 2017). These variables are either unavailable or difficult to measure. As such, they have been excluded from this study.
Descriptive statistics.

Note: EPU
ML, t
, CCI
ML, t
, IP
ML, t
and CPI
ML,t
, respectively, represent economic policy uncertainty in the mainland of China, ML means the mainland of China, consumer confidence index, industrial production index, and consumer price index; CPDs
j,
t
,P
j, t
, P
j, s, t
, and VA
lags, j, t
, respectively, represent the consumption difference index, destination price, competitive alternative price and the lagged form of tourist arrivals in the three other Greater China destinations,
Date of the first release of data regarding the three other Greater China destinations in 2019M1-2019M12.

Note: EPU ML,t , CCI ML,t , IP ML,t and CPI ML,t , respectively, represent economic policy uncertainty in the mainland of China, ML means the mainland of China, consumer confidence index, industrial production index and consumer price index; CPDs j, t , P j, t , P j, s, t and VA lags, j, t , respectively, represent the consumption difference index, destination price, competitive alternative price and the lagged form of tourist arrivals in the three other Greater China destinations.
The timeline for Taiwan is
The changing nowcasting equation in Model 2 with data updated in Hong Kong.
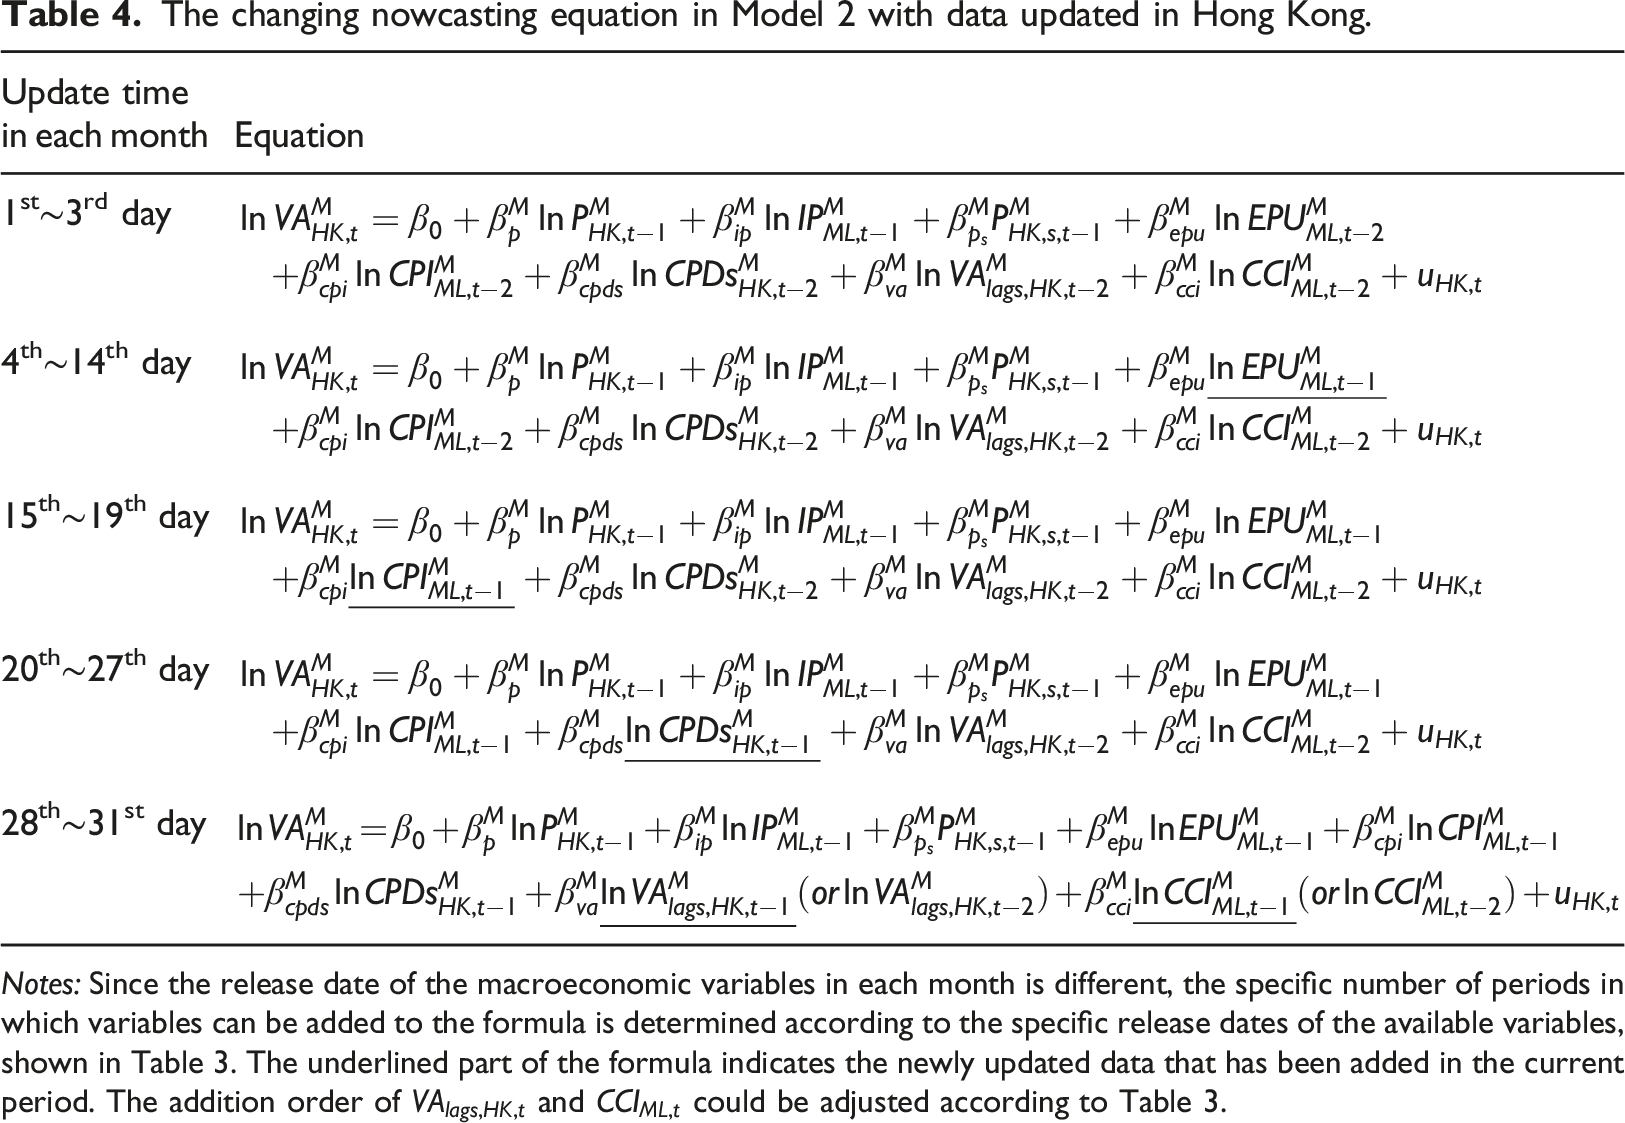
Notes: Since the release date of the macroeconomic variables in each month is different, the specific number of periods in which variables can be added to the formula is determined according to the specific release dates of the available variables, shown in Table 3. The underlined part of the formula indicates the newly updated data that has been added in the current period. The addition order of
Baidu index
The Baidu index is compiled based on Wen et al. (2019) and Wen et al. (2020) using keywords related to six aspects of tourism – that is dining, attractions, transportation, tours, shopping and lodging – as search queries. On the basis of the existing research, this study expands the keywords of Hong Kong and the research object to the Macau and Taiwan areas. The purpose is to make the research conclusions more convincing by researching multiple regions. The selected keywords of the Baidu index are obtained from the Baidu website (https://index.baidu.com/). The specific index construction process is as follows. Firstly, the six keywords are chosen. Secondly, several initial search queries are specified for each aspect of tourism. Thirdly, strongly correlated search queries are collected from a demand map interface provided by the Baidu index. Finally, correlation analysis is used to check and filter keywords one by one, according to the availability of each search query. Finally, we obtained 166, 75 and 98 search queries for Hong Kong, Macau and Taiwan. Using Taiwan as an example, the compilation process is shown in Figure 3. Keyword selection process (the case of Taiwan).
Empirical results
In this study, the tourism demand nowcasting results in Models 1 through 4 are measured by the traditional loss functions (i.e. the RMSE, MAE and MAPE).
Figure 4 shows the nowcasting performance of visitor arrivals from the mainland of China to Hong Kong, Macau and Taiwan. The results are arranged in three rows of three figures each, representing the three loss functions in the three destinations. The figures in the first row are the results for Hong Kong, those in the second row are the results for Macau, and those in the last row are the results for Taiwan. Figure 4’s first column is the RMSE results, and the second column is the MAE results. Then, the last column is the results of the MAPE. The x-axis represents the results of the 31-days nowcasting horizon, the y-axis represents the four models, and the z-axis represents the values of the traditional loss functions. Nowcasting evaluation under different models.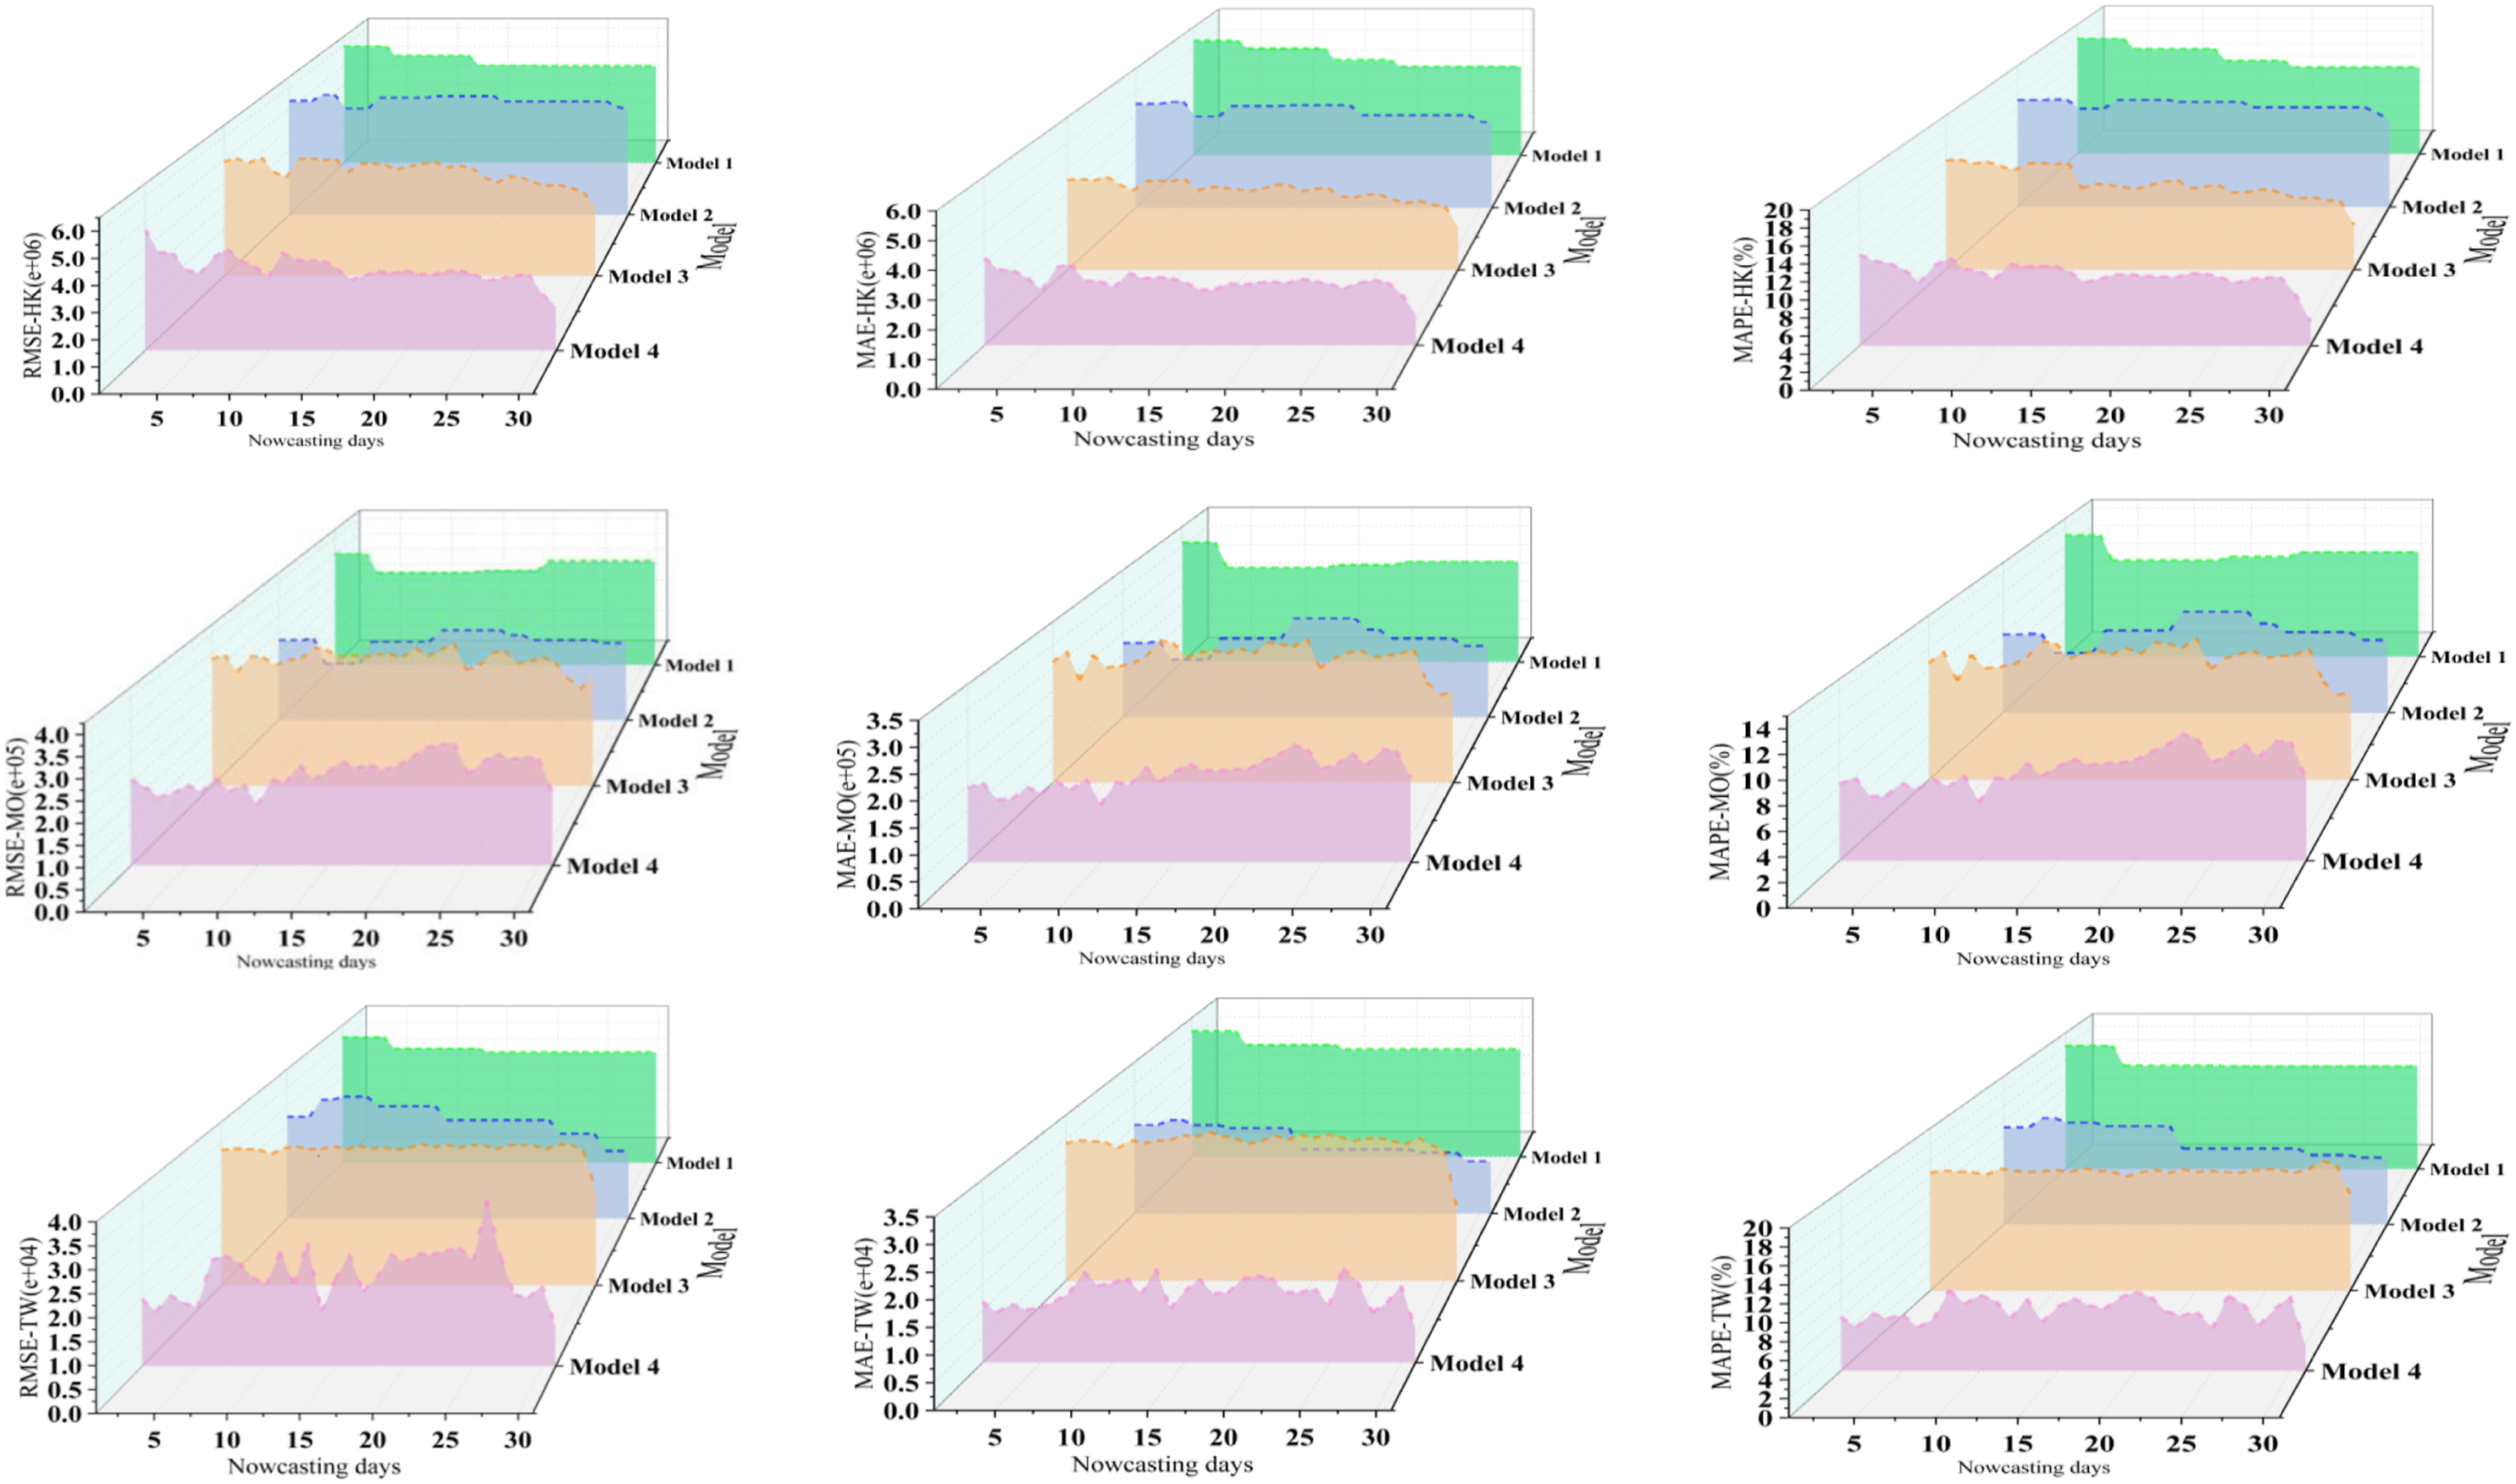
Firstly, in general, the nowcasting accuracy of the four models gradually improves. The nowcasting accuracy of Model 1 is the lowest, and the nowcasting accuracy of Model 4 is the best. The nowcasting error decreases with the macroeconomic factors, and the Baidu index factors are added. In other words, as time goes by, the nowcasting error shows a monotonic decreasing trend.
Secondly, from a horizontal perspective, the tourism demand nowcasting results are the best in Hong Kong, as expected, because the research method used in this study is more suitable for Hong Kong, with its high-dimensional variables. The results of Taiwan are second to Hong Kong. The tourism demand nowcasting effect for Macau is poor.
Finally, from a longitudinal perspective, the evaluation results show that the changing trends of the three loss functions are roughly the same, as the RMSE, MAE, and MAPE are measured by the error or the square of the error between the actual and predictive values. It can be seen from the nowcasting results of the four models under each loss function that regardless of the region or the loss function, the nowcasting error of Model 1 is the largest. After the factors from different data sources are added, the nowcasting accuracy of Model 4 is substantially improved, as can be seen in the three regions. Relative to Model 1, the addition of the macroeconomic factors improves the nowcasting performance of Model 2, and the addition of the Baidu index factors improves the nowcasting performance of Model 3. When the two types of factors are both added, the nowcasting performance of Model 4 is the strongest of all. This can be seen very clearly in the case of Hong Kong.
In short, the nowcasting performance of the model improves substantially after adding the Baidu index factors and the macroeconomic factors. However, the forecasting performance of the models based on either the macroeconomic factors or the Baidu index factors separately is less clear. As can be seen from the above figure, the nowcasting performance of the four models in Hong Kong gradually improves, but the nowcasting ability in Macau and Taiwan does not show a clear trend as the macroeconomic factors and Baidu index factors are added individually in Model 2 and Model 3. Therefore, the combination of macroeconomic factors and Baidu index factors can improve the nowcasting performance. In other words, the nowcasting accuracy of the model can be substantially improved by using richer data.
Model confidence set
Based on the above analysis, this study refers to the model confidence set (MCS) proposed by Hansen et al. (2011). Compared with other testing methods, the advantages of the MCS are that there is no need to select a benchmark model, multiple groups of models can be compared at the same time, and the best model under a certain confidence level can be obtained with one test.
The MCS is convenient when the number of models is large. The bootstrap implementation is simple to use in practice and avoids the need to estimate a high-dimensional covariance matrix.
This study selects two formulations of the null hypothesis that map naturally onto the test statistics

This study compares the results of tourism demand nowcasting in Hong Kong, Macau and Taiwan under four models and compares the nowcasting performance of the models in each region. To evaluate the model with the best forecasting performance and obtain a robust evaluation result, the MCS is used to perform a forecasting evaluation and illustrate the pros and cons of all models. As noted by Hansen et al. (2011), the larger p-value of a model’s confidence set test, the higher the nowcasting accuracy of the corresponding model. The closer the p-value is to 1, the better the forecast performance of the model. The forecasting performance of Model 4 is the best among all models generated in this study.
Model confidence set test results.
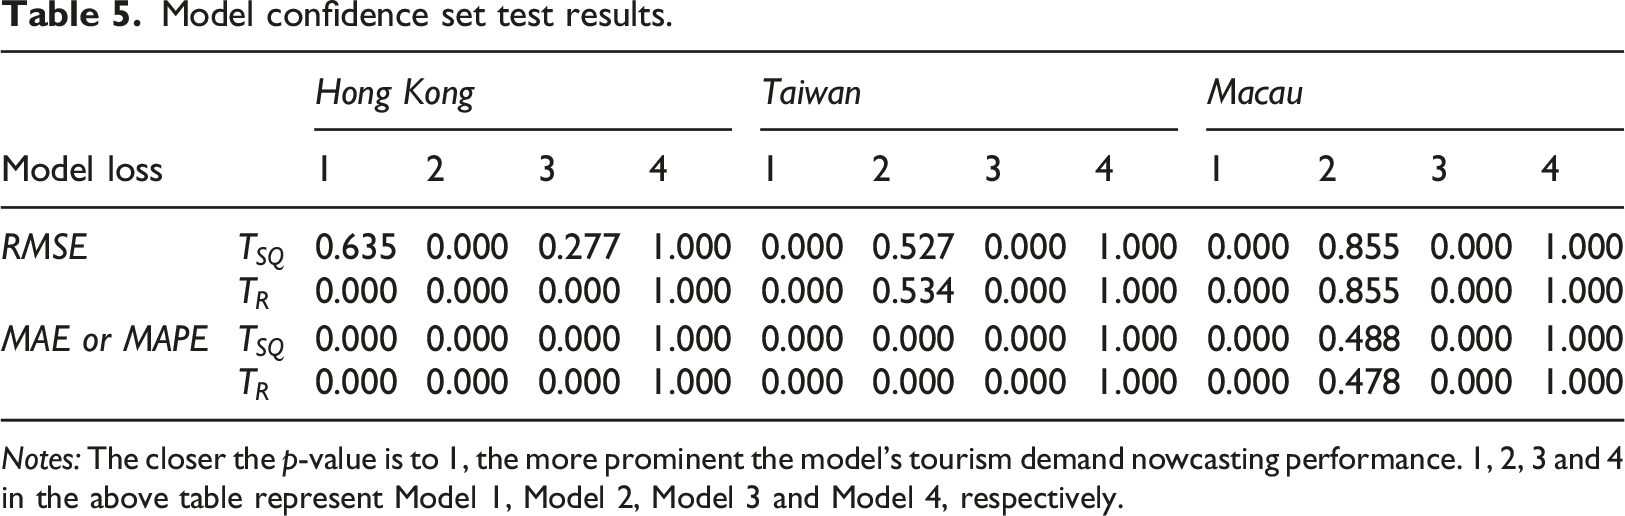
Notes: The closer the p-value is to 1, the more prominent the model’s tourism demand nowcasting performance. 1, 2, 3 and 4 in the above table represent Model 1, Model 2, Model 3 and Model 4, respectively.
Nowcasting monotonicity tests
The monotonicity test results for the four models and for tourism demand nowcasting from the mainland of China to Hong Kong, Macau and Taiwan are shown in Table 6. The first row shows the number of moment inequalities corresponding to the different interval values in the table. The second row presents the monotonicity statistics and different significance levels obtained for each moment inequality. The p-value represents the rejection rate of the monotonicity test. The larger the p-value, the better the results of tourism demand nowcasting, as a higher p-value indicates a greater probability of monotonicity when nowcasting tourism demand. 1. Overall, the results of the nowcasting monotonicity test based on the four models at different intervals show almost no evidence of accepting the null hypothesis, which means there is no monotonicity. The nowcasting performance of most models has a significance level of over 70%, indicating that the models’ nowcasting capabilities gradually improve with the addition of the Baidu index factors and macroeconomic factors, except for the results for Macau and Taiwan in Model 4. Monotonicity test results of tourism demand nowcasting in the three other Greater China destinations. Notes: ‘Model 1’ represents the traditional three-variable model. ‘Model 2’ represents the model based on Model 1 constructed by extracting macroeconomic factors from five macroeconomic variables. ‘Model 3’ represents the model built based on Model 1 by adding the Baidu index factors. ‘Model 4’ represents Model 1, with both macroeconomic factors and Baidu index factors.
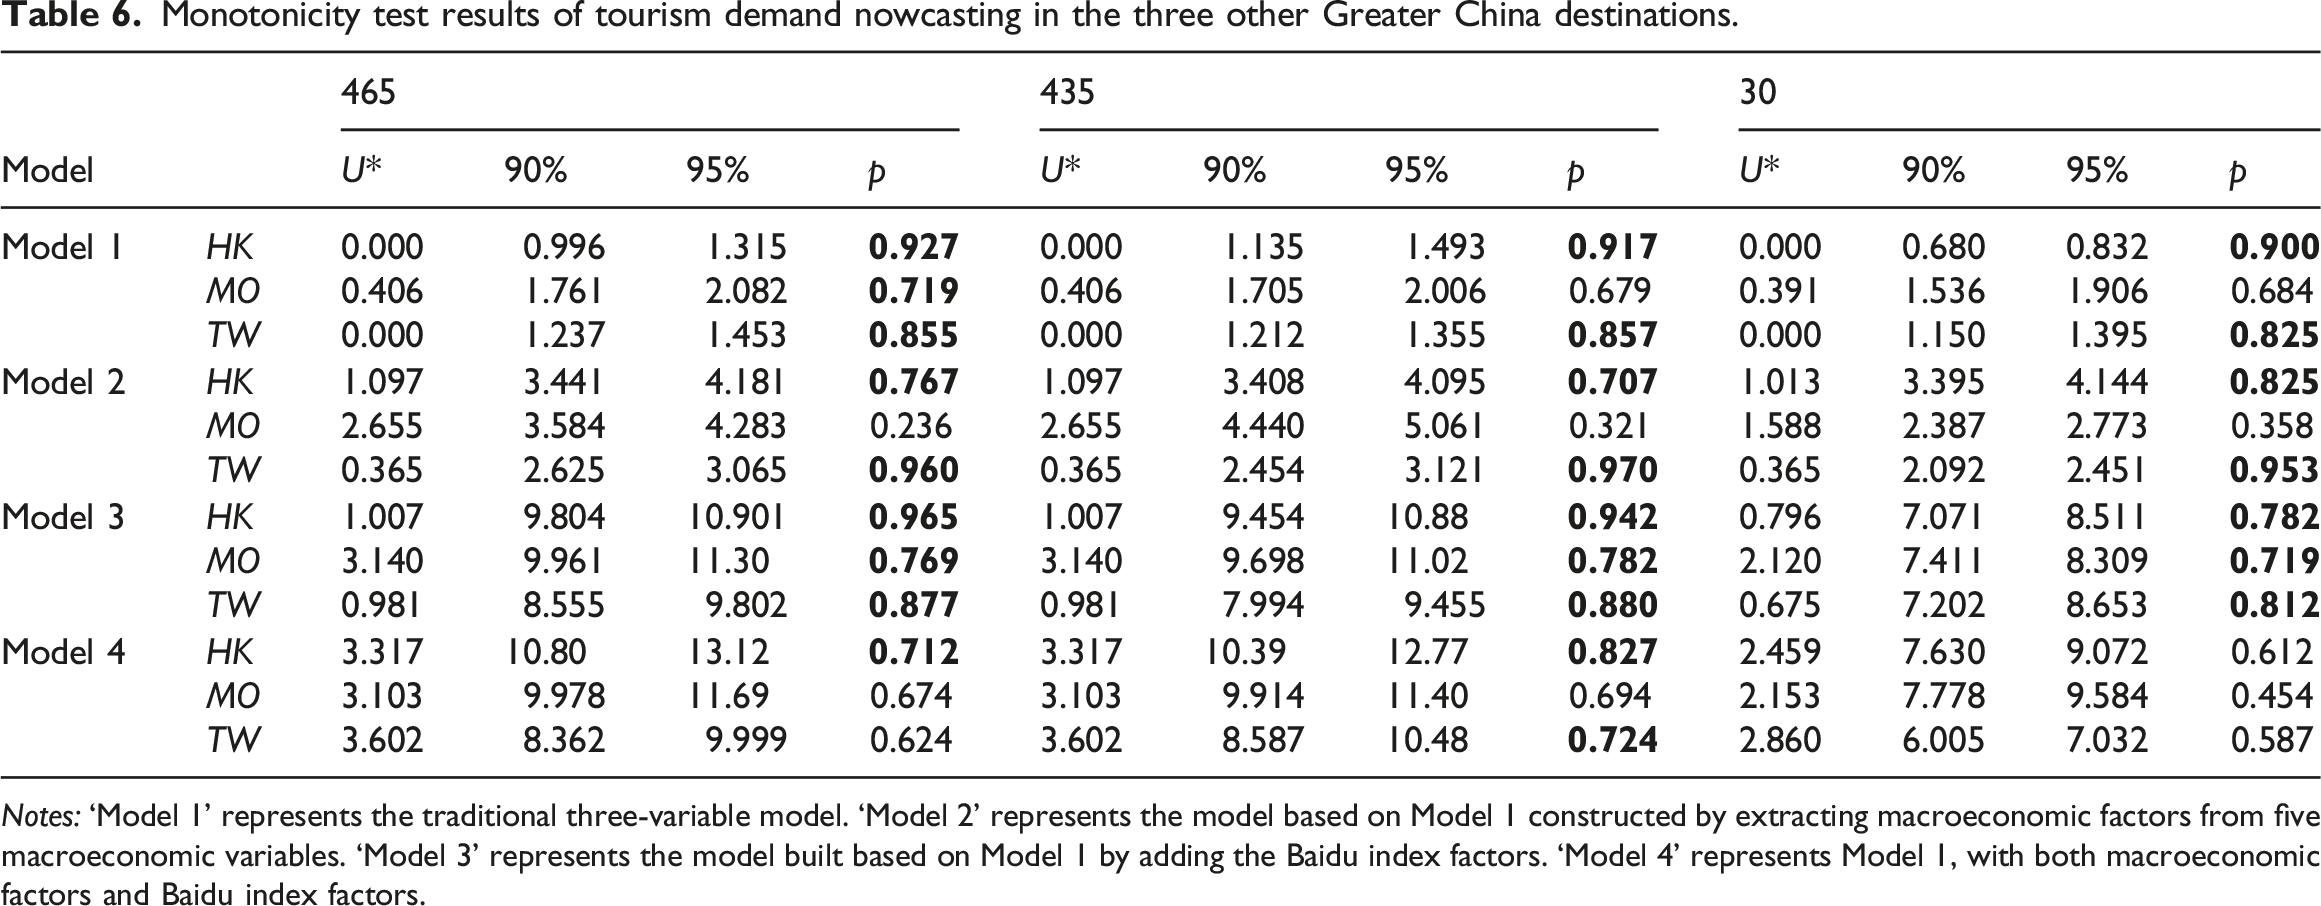
Although the nowcasting accuracy of Model 4 is substantially better than that of the other models as shown in Figure 4, its monotonicity test results in Table 6 show that the probability value does not reach 70%. The reason is that the addition of daily data and monthly data helps to improve Model 4’s nowcasting performance. However, the high-frequency data used in this study has large fluctuations when the nowcasting model contains mixed frequency data (monthly macroeconomic variables and daily Baidu indexes), making the nowcast results also fluctuate. In addition, the hypothesis of the monotonicity test method is rigorous. The existence of monotonicity is considered to be violated if at least one point later in the nowcasting period has a larger loss than an earlier horizon. Therefore, although the nowcasting performance of Model 4 is better, its monotonicity test results are relatively inferior compared to those of Models 1 through 3. 2. From a horizontal perspective, the nowcasting monotonicity results of Hong Kong are better than Macau and Taiwan, which means that the nowcasting performance of Hong Kong gradually improves with the nowcasting period’s increase. Except for Macau, the monotonicity test of Model 2 significantly supports the null hypothesis, and the nowcasting performance of the other models all have a significance level greater than 70%. These findings are consistent with the results shown by the loss function in Figure 4. 3. From a longitudinal perspective, the monotonicity test interval is 5. In other words, when the number of monotonicity moment inequalities to be tested is 465, the monotonicity test results of the four models’ nowcasting are the best in different regions. This indicates that it is effective to set the interval value based on the correlation between the extracted factors to avoid adjacent nowcasts.
Conclusion
In this study, using macroeconomic variables and the Baidu index as two different data sources, four competing models are specified to examine nowcasts of tourism demand from the mainland of China to Hong Kong, Macau and Taiwan.
The three most frequently used macroeconomic variables are used to establish Model 1. Based on Model 1, macroeconomic factors are extracted from the remaining five macroeconomic variables. These factors are added to Model 1 to construct Model 2. The Baidu index factors are extracted from the Baidu index and added to Model 1 to construct Model 3. Last, the macroeconomic factors and Baidu index factors are combined into Model 1 to construct Model 4. Through these four models, tourist arrivals nowcasting from the mainland of China to Hong Kong, Macau and Taiwan is generated. This study uses traditional loss functions (RMSE, MAE and MAPE) to evaluate the nowcasting performance of the models. This study further analyses nowcasting accuracy through a novel statistical method, the monotonicity test, to test whether a model’s nowcasting performance improves gradually as new information is updated and added from different data sources. The following results are obtained.
Firstly, the monotonicity test of tourism demand nowcasting in Hong Kong, Macau and Taiwan are found to be more intuitive and convincing than traditional loss functions. Unlike previous studies showing that loss functions show the overall size and do not show the trend of the errors between the nowcast value and actual value. This study uses a monotonicity test to eliminate such shortcomings based on the L (•) functions, thus providing a more objective explanation of nowcasting performance.
Secondly, from the nowcasting results in different models, Model 1 has the lowest nowcasting performance, whilst adding the macroeconomic factors and Baidu index factors further improves the performance. Although Models 2 and 3, incorporating macroeconomic factors and Baidu index factors, are superior to Model 1 in their nowcasting performance, there is uncertainty regarding this performance. When the two factors are combined with Model 4 to nowcast tourism demand, however, nowcasting performance is substantially improved, and the nowcasting performance contribution becomes the greatest.
Finally, from the monotonicity test results in different regions, Model 1’s probability value of the monotonicity test for different regions is the largest compared with the other three models, which is also consistent with the results in Figure 4. The nowcast error of Model 1 gradually decreases during the forecast period, and its downtrend is substantially better than that of Models 2 through 4. Therefore, the probability of the monotonicity test of Model 1 is greater than that of the other three models. However, there are uncertainties in the monotonicity test results of Model 2 and Model 3 in the three regions. Generally speaking, the monotonicity probability value of Hong Kong and Taiwan is greater than Macau.
In summary, the combination of different data sources in this study substantially improves nowcasting performance. Furthermore, the application of the monotonicity test objectively illustrates that nowcasting performance shows a gradual increase with the continuous addition of new information. It is hoped that the results of this study will inform future nowcasting research on tourism demand in Hong Kong, Macau and Taiwan.
Footnotes
Acknowledgements
The authors are grateful to the editors and two anonymous reviewers for their valuable comments and suggestions. All remaining errors are the authors’ responsibility.
Declaration of conflicting interests
The author(s) declared no potential conflicts of interest with respect to the research, authorship, and/or publication of this article.
Funding
The author(s) disclosed receipt of the following financial support for the research, authorship, and/or publication of this article: This work was supported by the Natural Science Foundation of China (Grant No.: 72004077), Hong Kong Research Grant Committee (Grant No.: PolyU -15502120).
