
Abstract
Domestic tourism demand has dominated the global tourism market and has been more resilient during the COVID-19 pandemic; yet, it is under-studied compared to international tourism demand. Digital financial inclusion (DFI) enables the provision of formal financial products and services to small and medium-sized tourism enterprises and tourists through cost-effective digital means, potentially boosting domestic tourism demand. Integrating micro- and macro-level data from 335 prefecture-level regions in China, we investigate the impact of DFI on domestic tourism demand using spatial panel models. Our analysis reveals significant and positive effects, both direct and spillover, of DFI on domestic tourism demand within a region and across regions. Notably, among the three dimensions of DFI, the usage depth exhibits the most substantial spillover effects. Furthermore, our findings also highlight the crucial role of DFI in internalizing domestic tourism revenues. Our study provides practical implications for sustainable domestic tourism development in the digital era.
Keywords
Introduction
As the foundation of the national economy, the tourism industry plays an enormous role in promoting economic growth and generating employment opportunities. Before the COVID-19 pandemic, the tourism industry accounts 10.3% of global GDP (equivalent to USD 9.6 trillion) and supports 333 million jobs (WTTC, 2022). While the pandemic and economic downturn severely impacted tourism in recent years, global tourism demand is expected to recover strongly in 2023, driven by the attainment of herd immunity (Li et al., 2023; UNWTO, 2023). Notably, domestic tourism has traditionally dominated global tourism market even before the pandemic (Adamiak and Szyda, 2022). 1 Moreover, domestic tourism has shown faster resilience and recovery compared to international tourism in the post-pandemic period (UNWTO, 2020). Therefore, for countries like China, which possess abundant tourism resources and a large number of tourists, fostering and sustaining a strong domestic tourism demand is of paramount importance for ensuring the long-term sustainability of the tourism sector. 2
Financial development has been widely recognized as a significant driver of tourism demand (Churchill et al., 2022; Katircioglu et al., 2018; Khanna and Sharma, 2021; Menegaki and Tiwari, 2022). In countries or regions with higher levels of financial development, the impact on tourism demand is twofold. First, tourism-related enterprises are more likely to access financial support and standardized governance services, fostering innovation in tourism products and business models (Khanna and Sharma, 2021). Second, tourists can alleviate household credit constraints and achieve smoother consumption through more abundant financial products, leading to an increase in tourism demand (Yang and Zhang, 2022). Particularly, the majority of tourism enterprises are small and medium-sized enterprises (SMEs) (Carrillo-Hidalgo and Pulido-Fernández, 2019), and domestic tourism is often preferred by low- and middle-income groups. In this context, financial inclusion, which aims to provide affordable formal financial services and products to companies and individuals sustainably (Célerier and Matray, 2019; Yang and Zhang, 2022), emerges as a crucial aspect of financial development in the literature (Hu et al., 2023; International Monetary Fund, 2023; Yang and Zhang, 2022).
However, existing literature towards financial development or financial inclusion and tourism demand primarily focuses on international tourism (Gopalan and Khalid, 2022, 2023; Khanna and Sharma, 2021; Shi et al., 2021). This narrow focus can be attributed to the limited availability of indicators or proxies for measuring financial development or financial inclusion at subnational levels. The emergence of digital financial platforms and the availability of micro-level data of digital financial inclusion (DFI) offer a promising solution to this data and research dilemma (Yang and Zhang, 2022). DFI, in particular, is more likely to achieve broad financial inclusion as it eliminates the reliance on physical network associated with traditional financial system and hence significantly lowers the costs (Demir et al., 2022). In the current era of booming digital economy and FinTech, DFI has gradually surpassed traditional financial inclusion. For instance, in China, the number of ATMs and bank branches, which are key indicators of traditional financial inclusion, has decreased significantly. 3 It is therefore essential to consider digital rather than solely focusing on traditional financial inclusion when examining its relationship with tourism demand.
This study intends to investigate the effect of DFI on domestic tourism demand using micro- and macro-level data in China. China is a good case due to its status as the largest domestic tourism market globally and its notable advancements in DFI recently (Lin et al., 2022; Yang and Zhang, 2022). To assess the level of DFI, we utilize the DFI index, jointly developed by Peking University and Ant Group based on the massive user data from Alipay. 4 Further details regarding the DFI index can be found in the third section. In addition, we adopt data measuring domestic tourism demand, including domestic tourist arrivals and tourism revenues, as well as other relevant data for 335 prefecture-level regions in China from 2011 to 2019.
Previous studies have documented significant spatial spillover effects on domestic tourism demand in China (see, e.g., Yang and Wong, 2012; Yang and Fik, 2014; Zhang et al., 2011). Simultaneously, the promotion and development of DFI also exhibit spatial dependence due to demonstration and competition effects among neighboring regions (Guo et al., 2020; Zhang et al., 2023a). To mitigate bias and obtain reliable results, it is necessary to apply spatial econometric modeling to measure the impact of DFI on domestic tourism demand. This study employs the approach presented by Gunter et al. (2019) to rigorously determine appropriate spatial econometric model and other key details. Furthermore, we explore the direct, indirect, and total effects of different dimensions of DFI, namely, coverage breadth, usage depth, and digitization level, on domestic tourism demand by taking them as surrogate variables. To ensure the robustness of our findings, a comprehensive set of robustness checks including substituting dependent variables, substituting spatial weight matrices, adjusting sample period, and lagging DFI indexes, are also conducted.
Our study contributes to the literature linking financial development and tourism demand. First, this is the first study to highlight the positive impact of digital financial inclusion on domestic tourism demand, to the best of our knowledge. While previous studies on tourism demand have examined various determinants of domestic tourism demand, such as meteorological factors (Otero-Giráldez et al., 2012), income (Yang et al., 2014), vacation policy (Zhang et al., 2016), and transportation (Tsui, 2017), financial inclusion, especially digital financial inclusion, has been largely ignored. Second, we employ a DFI index based on extensive micro-level data and a multi-tiered index system. In contrast to the isolated DFI indicators commonly used in a limited number of previous studies (Gopalan and Khalid, 2022, 2023), this index provides a more comprehensive reflection of the complex multidimensional characteristics of DFI. Third, our study offers novel insights into the relationship between DFI and domestic tourism demand from a spatial spillover perspective. The findings of this research emphasize the significance of DFI for different stakeholders, including tourism practitioners and governments, to prioritize the importance of DFI and fully internalize the spillover effects of enhanced DFI in neighboring regions.
The remainder of the article is organized as follows. The second section reviews literature on financial development and financial inclusion promoting tourism demand, as well as spatial spillover in tourism demand studies. The third section introduces related data and methodology involved in this study. The fourth section analyzes empirical estimation results and performs robustness checks. The last section discusses and concludes this study with suggestions for future research.
Literature review
In this section, we provide a comprehensive review of advances in financial inclusion, with a special focus on DFI, in the tourism and general (non-tourism) literature, as well as research on spatial spillovers in tourism demand studies, leading to the formulation of our research hypotheses.
Financial inclusion and tourism demand
A review of the nexus between financial inclusion and tourism demand could be traced to the relatively broader literature linking financial development and tourism demand. According to the World Bank, financial development can be defined as the reduction of information, enforcement, and transaction costs in the financials through the presence of financial institutions, intermediaries, and markets (World Bank, 2015). Numerous researches at the single-country and regional levels have demonstrated the positive impact of financial development on economic growth and tourism demand, highlighting the corresponding feedback effect (Cannonier and Burke, 2017; Churchill et al., 2022; Katircioglu et al., 2018; Menegaki and Tiwari, 2022). Notably, Khanna and Sharma (2021) present the solid cross-country evidence to assess the influence of financial development on tourism demand using a sample of 207 countries.
In recent years, the view of financial inclusion as an integral dimension of financial development has been given due attention (International Monetary Fund, 2023). Especially for the tourism industry, where most of the enterprises are SMEs, financial inclusion calls for financial development to bring financial support to many SMEs instead of just concentrating on the top enterprises (Carrillo-Hidalgo and Pulido-Fernández, 2019). Only a handful of initial attempts have been made to investigate the role of financial inclusion in boosting tourism demand. For example, Shi et al. (2021) first formulate the impact of financial inclusion on tourism demand and compare the differences in this impact between developed and emerging economies. By contrast, Gopalan and Khalid (2022) and Gopalan and Khalid (2023) focus solely on emerging economies. Nonetheless, these above studies mainly consider international tourism demand including inbound tourism and outbound tourism, ignoring the huge domestic tourism demand. Considering the actual beneficiaries of financial inclusion, it seems that domestic tourism demand is more affected by financial inclusion than international tourism demand.
It is widely believed that fintech represented by digital financial services has significantly improved the accessibility and affordability of financial services, thereby driving the development of financial inclusion (Demir et al., 2022; Hu et al., 2023; Yang and Zhang, 2022). Recent studies have identified and confirmed the positive effects of such DFI on SMEs financing (Babilla, 2023; Hu et al., 2023; Zhang et al., 2023b), (household) entrepreneurship (Gao et al., 2022; Wu and Wu, 2023), household income (Zhang et al., 2020), and household consumption (Yang and Zhang, 2022). Back to tourism industry, DFI is expected to benefit both tourism SEMs and domestic tourists to promote domestic tourism demand. On the one hand, DFI extends formal bank credit to tourism SMEs lacking collateral assets through the utilization of big data credit investigation, which benefits tourism entrepreneurial activities and tourism product innovation (e.g., online travel booking), and consequently stimulate tourism demand (Gopalan and Khalid, 2022). Digital platform giants often start by offering digital financial products, followed by a package of digital transformation services. The large number of consumers enjoying digital financial products also drive SMEs to embrace the trend of digital transformation. Therefore, DFI could support the digital transformation of the tourism SMEs, enhancing management and operational efficiency (Guo et al., 2023). On the other hand, DFI smooths the flow of funds between investments, savings, and payments, which facilitates the consumption of tourists during their travel activities. DFI also potentially increases tourists’ leisure time by saving their shopping time through convenient payments. 5 Furthermore, tourists and tourism SMEs benefit from convenient, diverse, and transparent insurance products and services made possible through DFI. In view of the inherent variability and fragility of tourism demand, tourists and tourism enterprises can use insurance to dilute the risks in travel and business operations (Gopalan and Khalid, 2022), which also contributes to the sustainable development of domestic tourism demand. Considering that international tourism is expensive and mainly operated by large enterprises, the DFI’s mechanism for promoting domestic tourism demand is unsuitable for international tourism demand. Thus, the following hypothesis is proposed:
There is a positive and significant direct effect on domestic tourism demand with a region.
Spatial spillover in tourism demand studies
The spatial spillover effect refers to the indirect or unintentional influence of tourism demand among neighboring regions (Jiao et al., 2021; Yang and Wong, 2012). Various factors contribute to tourism flows spillover, including productivity spillover, market access spillover, joint promotion, negative events, and tourists with multi-destination travel plans, as summarized by Yang and Wong (2012). Failing to take spatial spillovers into account in modeling tourism demand may lead to biased and misleading coefficient estimates, which is not conducive to untangling the determinants affecting regional tourism demand growth (Yang and Fik, 2014). Pioneering studies by Yang and Wong (2012) and Yang and Fik (2014), have formulate the spatial auto-regressive models and spatial Durbin models to estimate the spatial spillover of tourist flows and their growths in China. On the basis of these studies, Zhou et al. (2017) and Tian et al. (2022) identify the spillover effects of attractions and transport improvement on China’s inbound and domestic tourism demand, respectively. Deng and Hu (2019) examine the spillover effects of outbound tourism demand from Chinese tourists to the “Silk Road” countries from the perspective of geographical and cultural proximity. Xu et al. (2020) reveals spatial heterogeneity of the direct and spillover effects of haze pollution on inbound tourism in the Central and Eastern China. Beyond China, scholars have also observed spatial spillovers in tourism demand of other countries, such as Italy and Spain, identifying specifications and the extent of spillovers of determinants (Alvarez-Diaz et al., 2020; Marrocu and Paci, 2013).
The above literature basically adopts the spatial econometric models to estimate the spatial spillover of tourism demand. Furthermore, Gap model (Li et al., 2011), distance model (Yang et al., 2017), and agent-based modeling (Li et al., 2021) are all used to capture this spatial spillover of tourism demand. In terms of the research geographical scale, aside from the common national, provincial, and city levels, the spillover effects of tourism demand at the level of attraction (Kim et al., 2022; Zhou et al., 2017), community (Li et al., 2022), and vacation town represented by Disney Resort (Weng et al., 2021) are investigated.
Although the promotion mechanism of tourism demand by financial inclusion has been preliminarily discussed in the literature (Gopalan and Khalid, 2022, 2023; Shi et al., 2021), little is known about the spatial interaction of financial inclusion in tourism industry. Given that DFI spreads across geographic boundaries but is also spatially dependent at region level (Guo et al., 2020; Yang and Zhang, 2022; Zhang et al., 2023a), exploring the effect of DFI on tourism demand from the lens of spatial spillover is helpful to better understand the dynamic interaction between DFI and domestic tourism demand. Therefore, we develop the following hypothesis:
There is a positive and significant spatial spillover on domestic tourism demand across regions.
Data and methodology
Digital financial inclusion in China
The emerging DFI can effectively serve the underserved long-tail users among SMEs and individuals, who cannot be covered by the traditional financial system. DFI is already booming in China. The digital financial platforms represented by Alipay and WeChat Pay not only provide convenient payment services, but also extend their provision to credit, insurance, funds, and various other financial services. For example, Yu’ E Bao, a popular monetary fund launched by Alipay, allows fund holders to make payments at any time while enjoying the fund’s earnings. With 741 million fund holders in the middle of 2022, Yu’ E Bao stands as the largest financial inclusion product in money management in China and even in the world.
Digital financial inclusion index system.
Note: This index system is constructed by Guo et al. (2020).
The DFI total index is synthesized in the following three steps (Guo et al., 2020). First, all the specific indicators are dimensionless using the logarithmic efficiency coefficient method. Next, the variance coefficient method is employed to determine the weight of each specific indicator on the corresponding secondary index. Finally, the weights of the secondary and primary indexes on the upper level indexes are determined by the analytic hierarchy process.
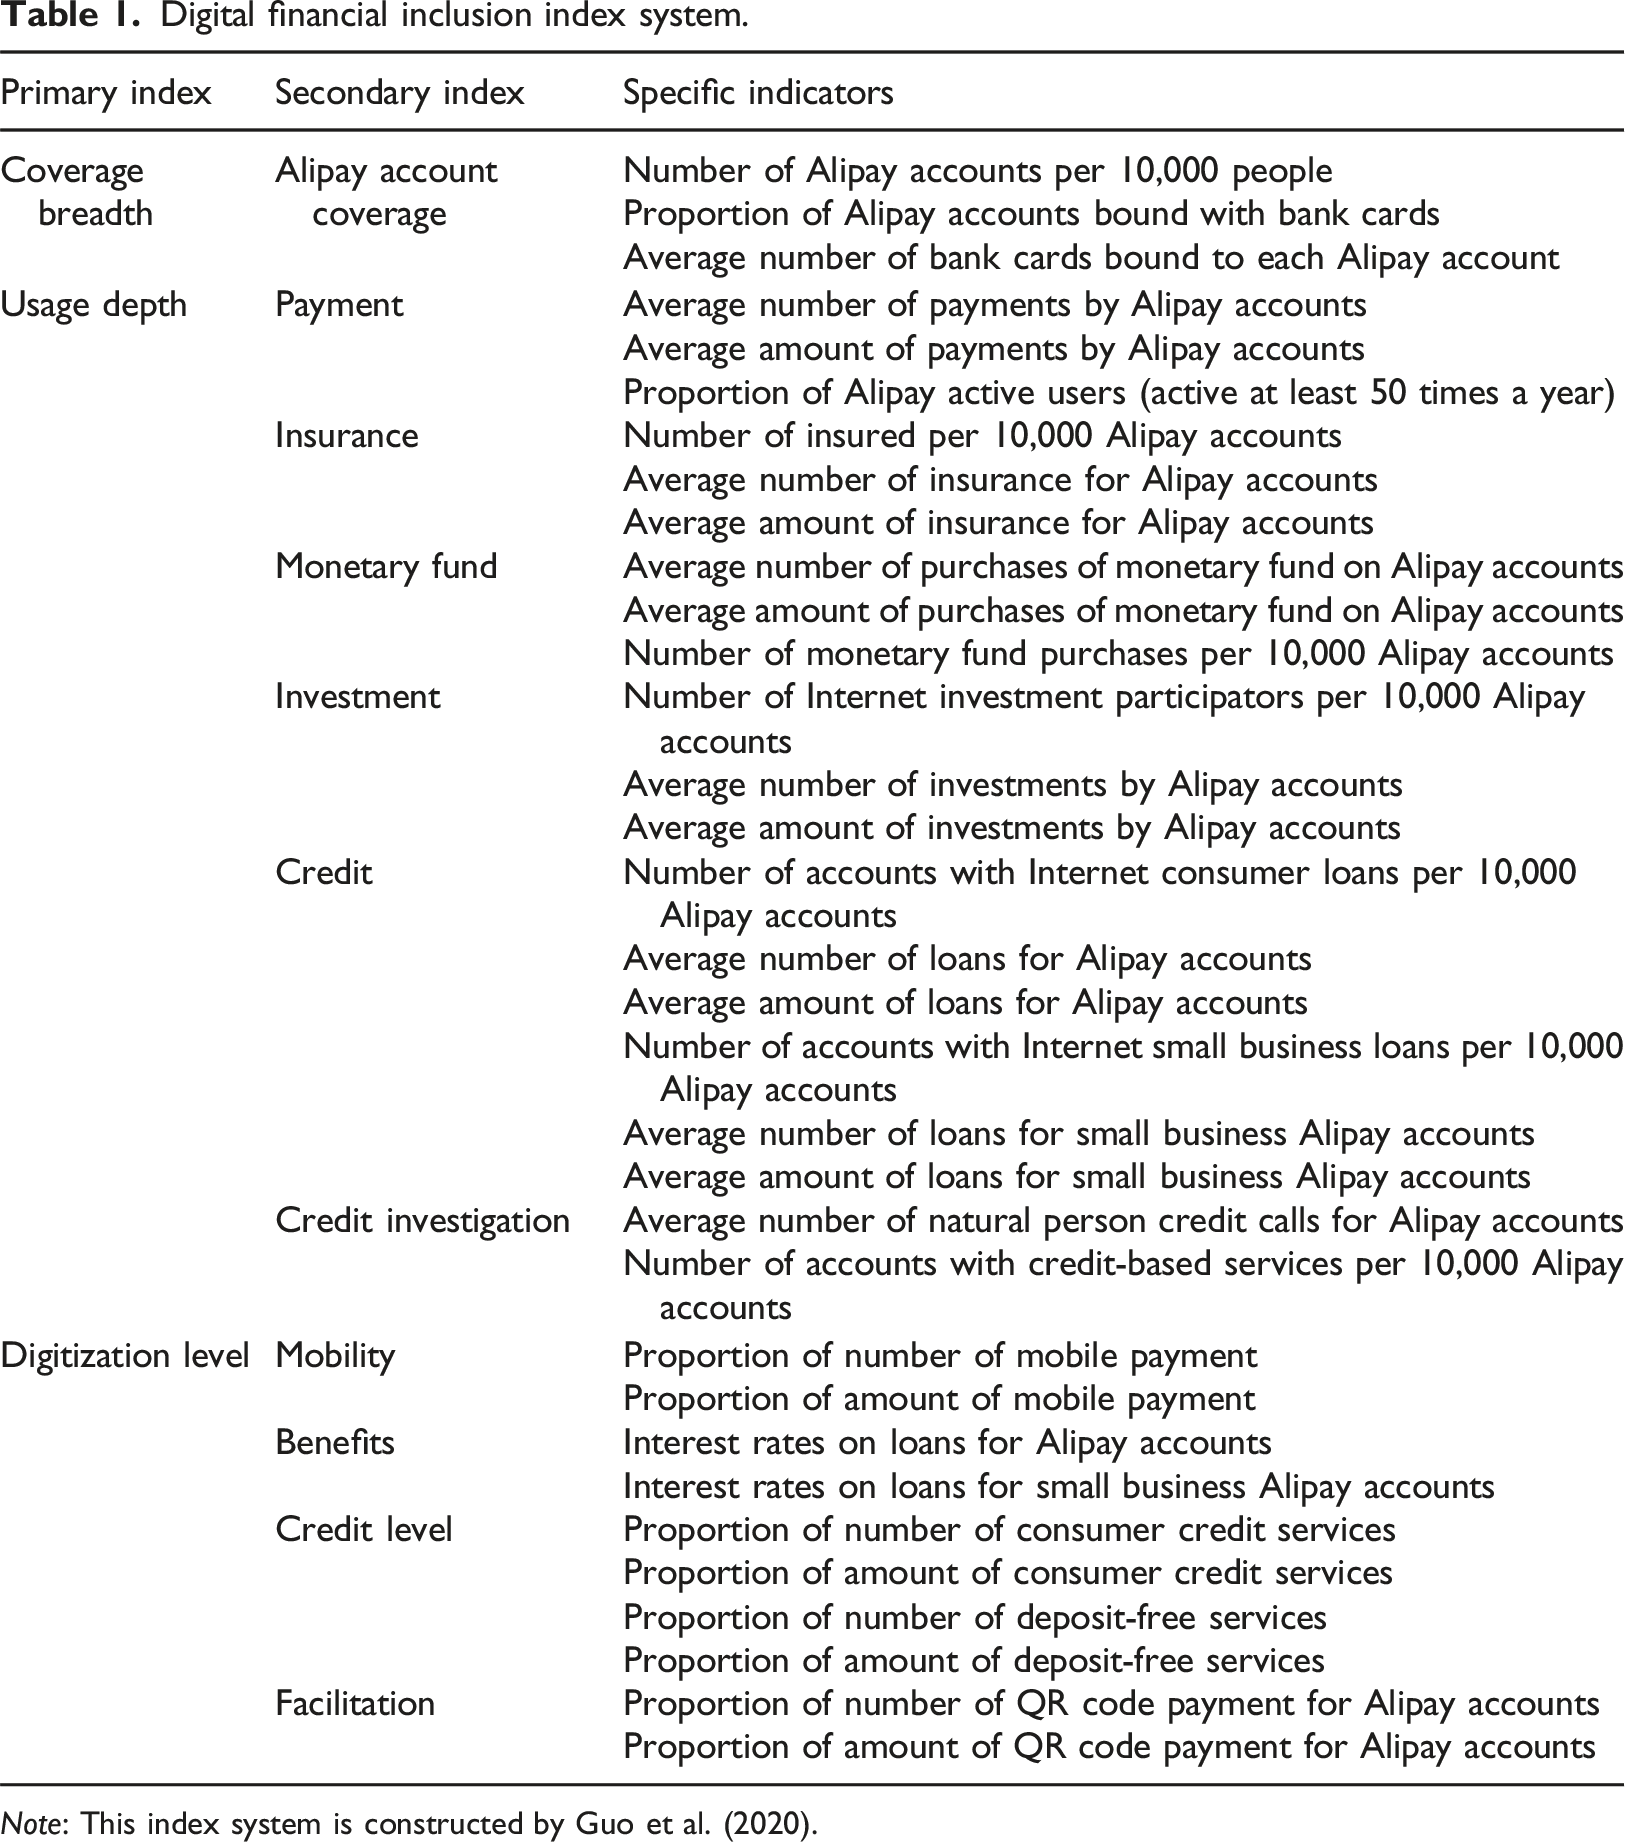
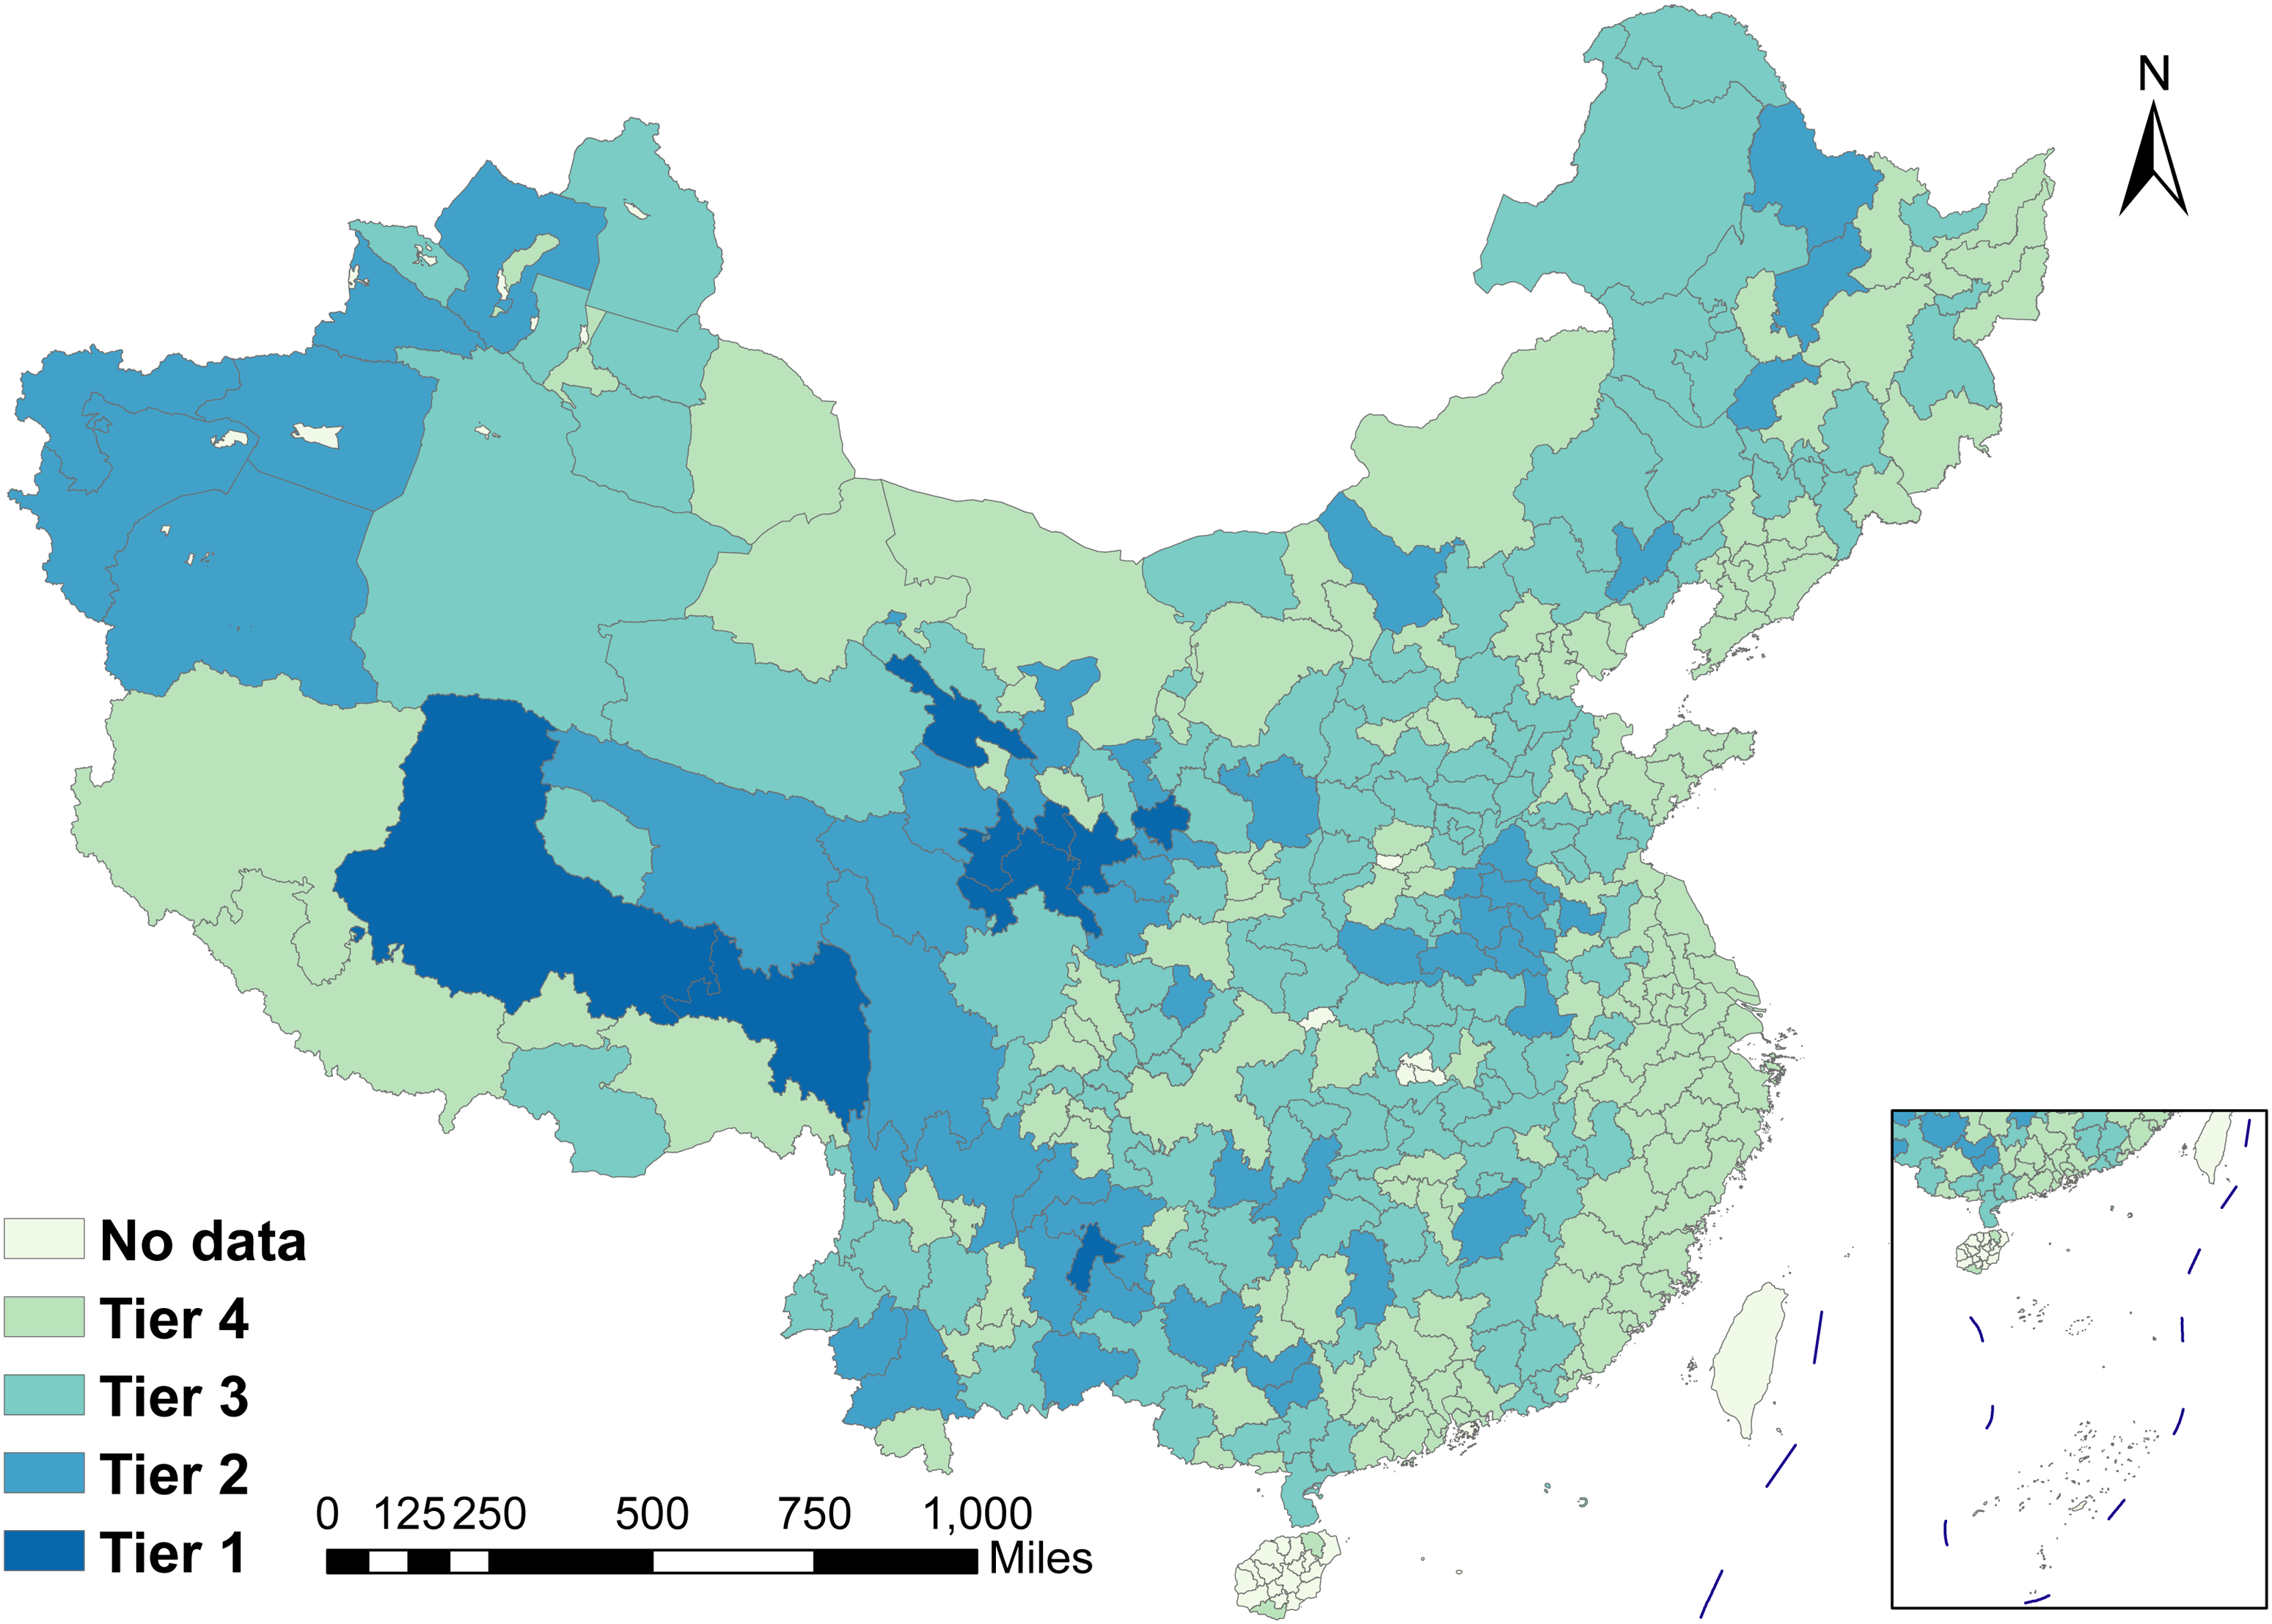
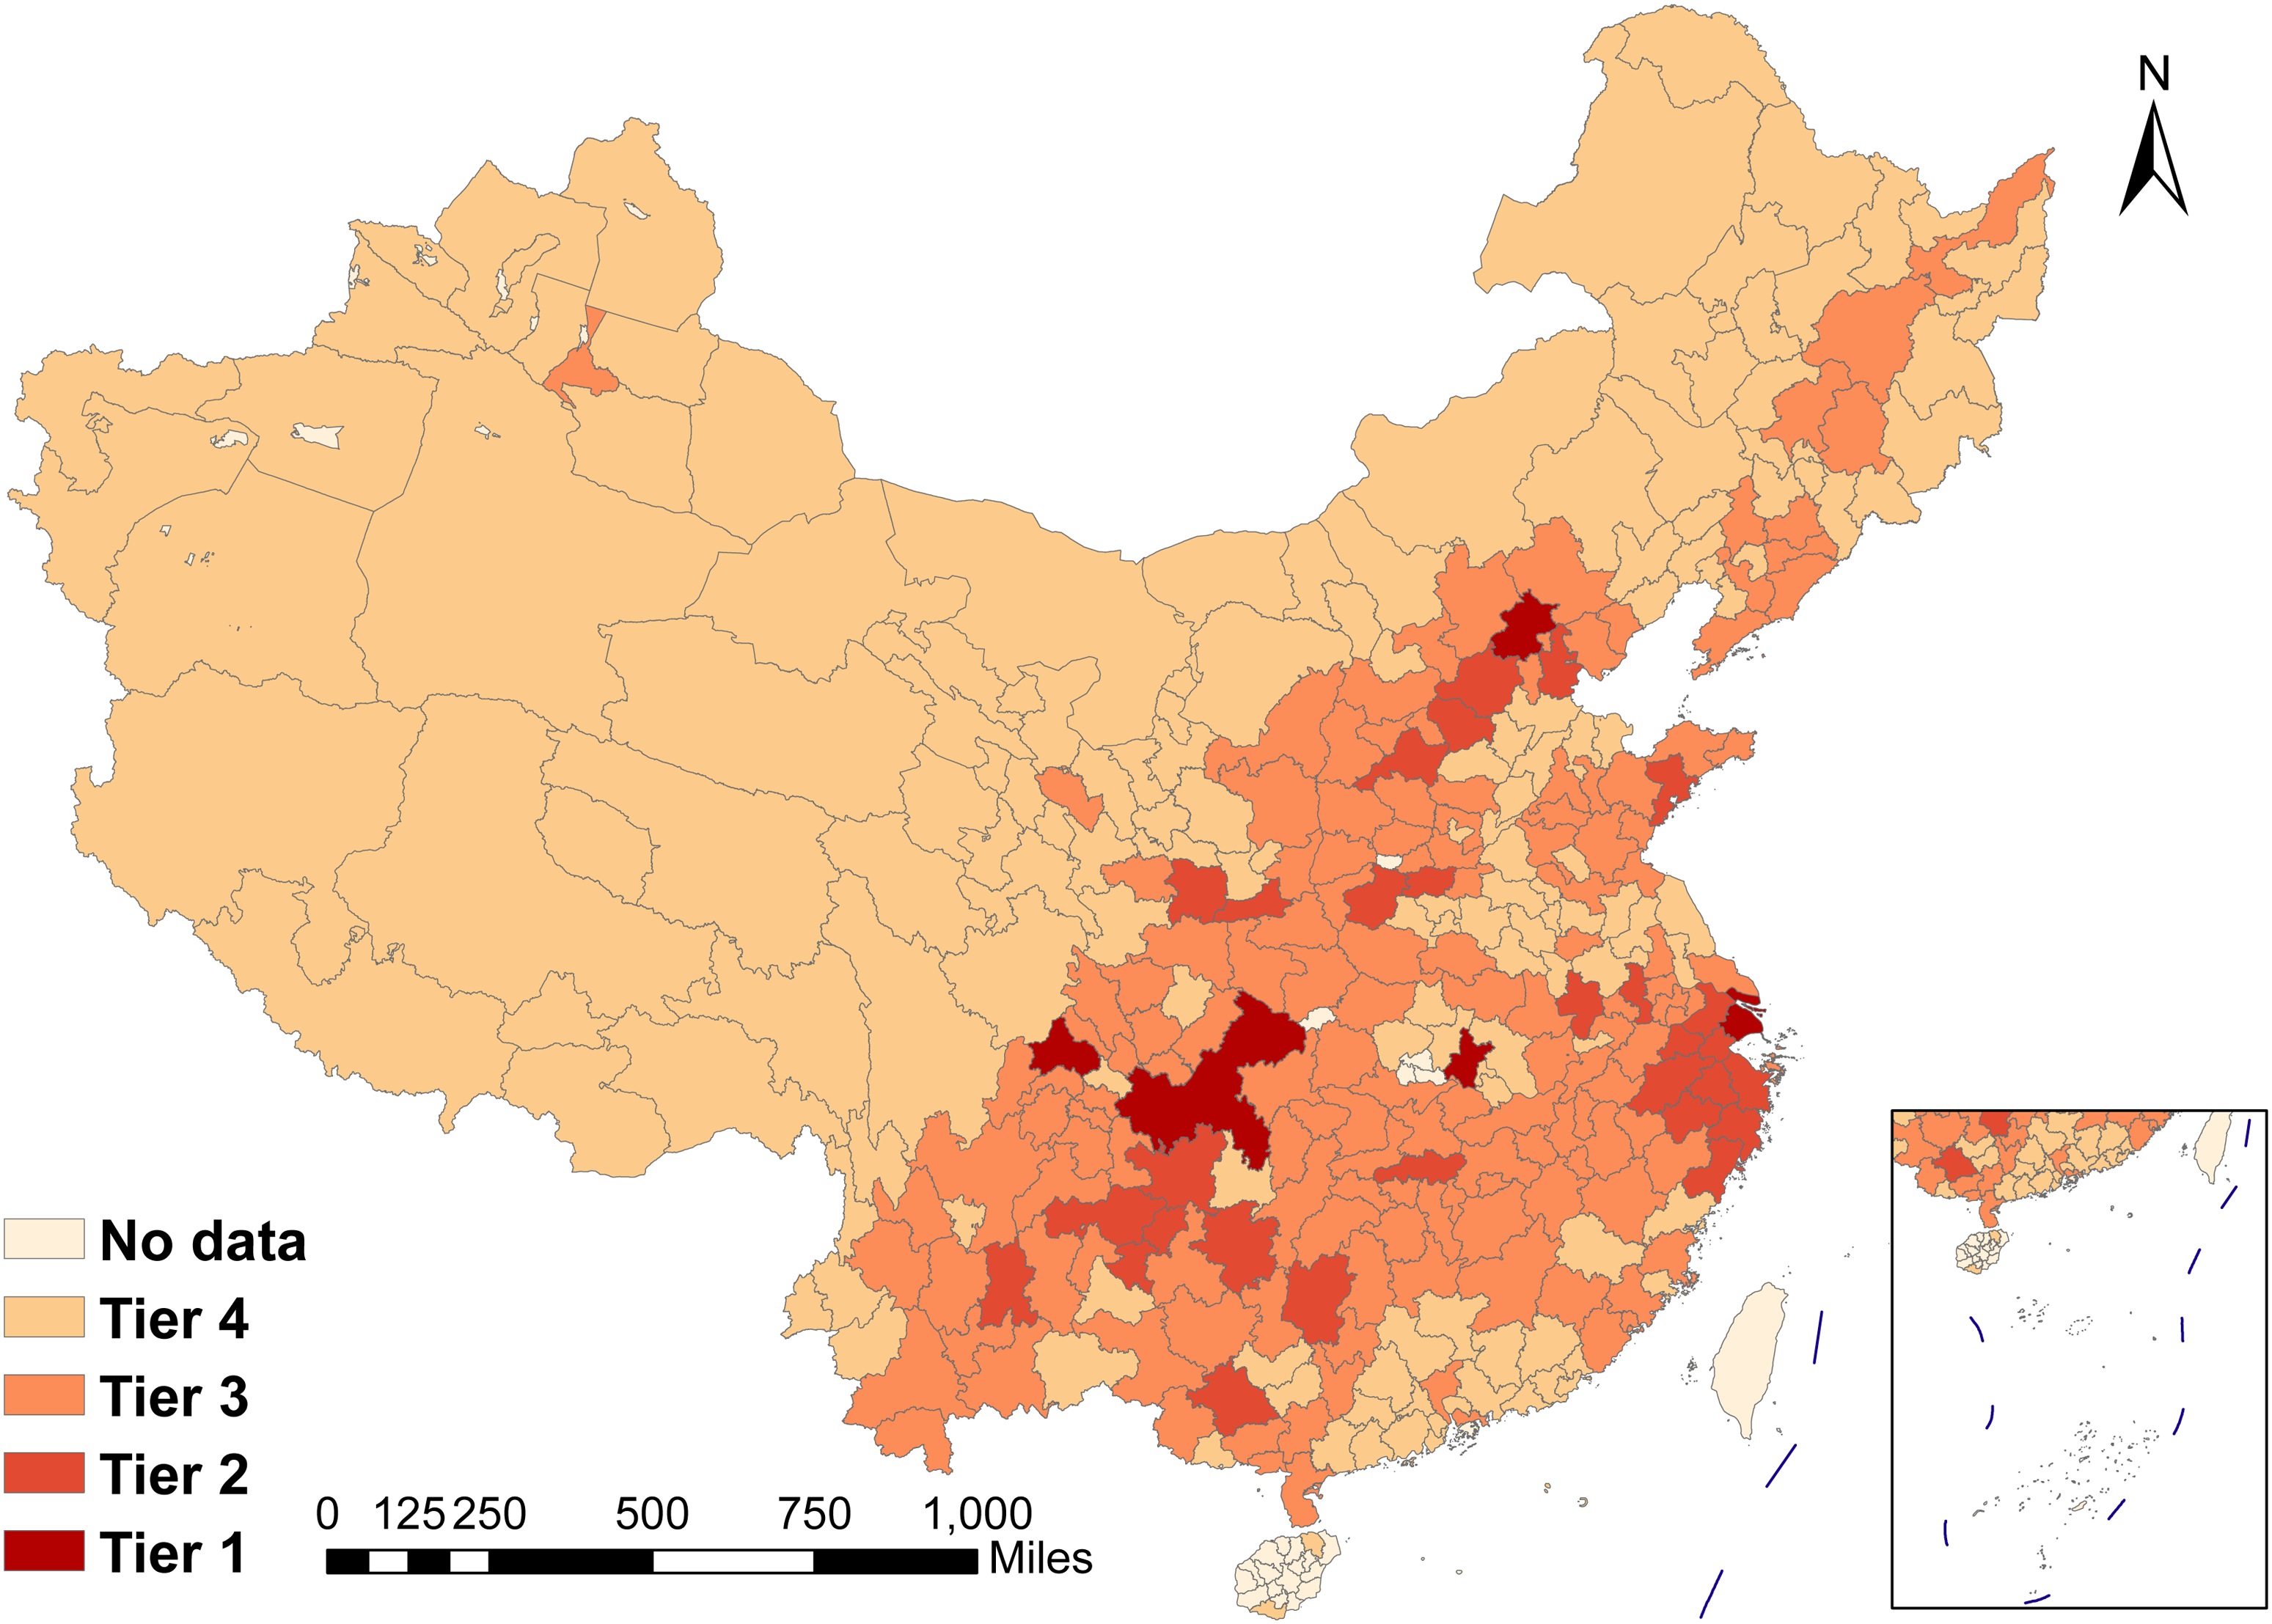
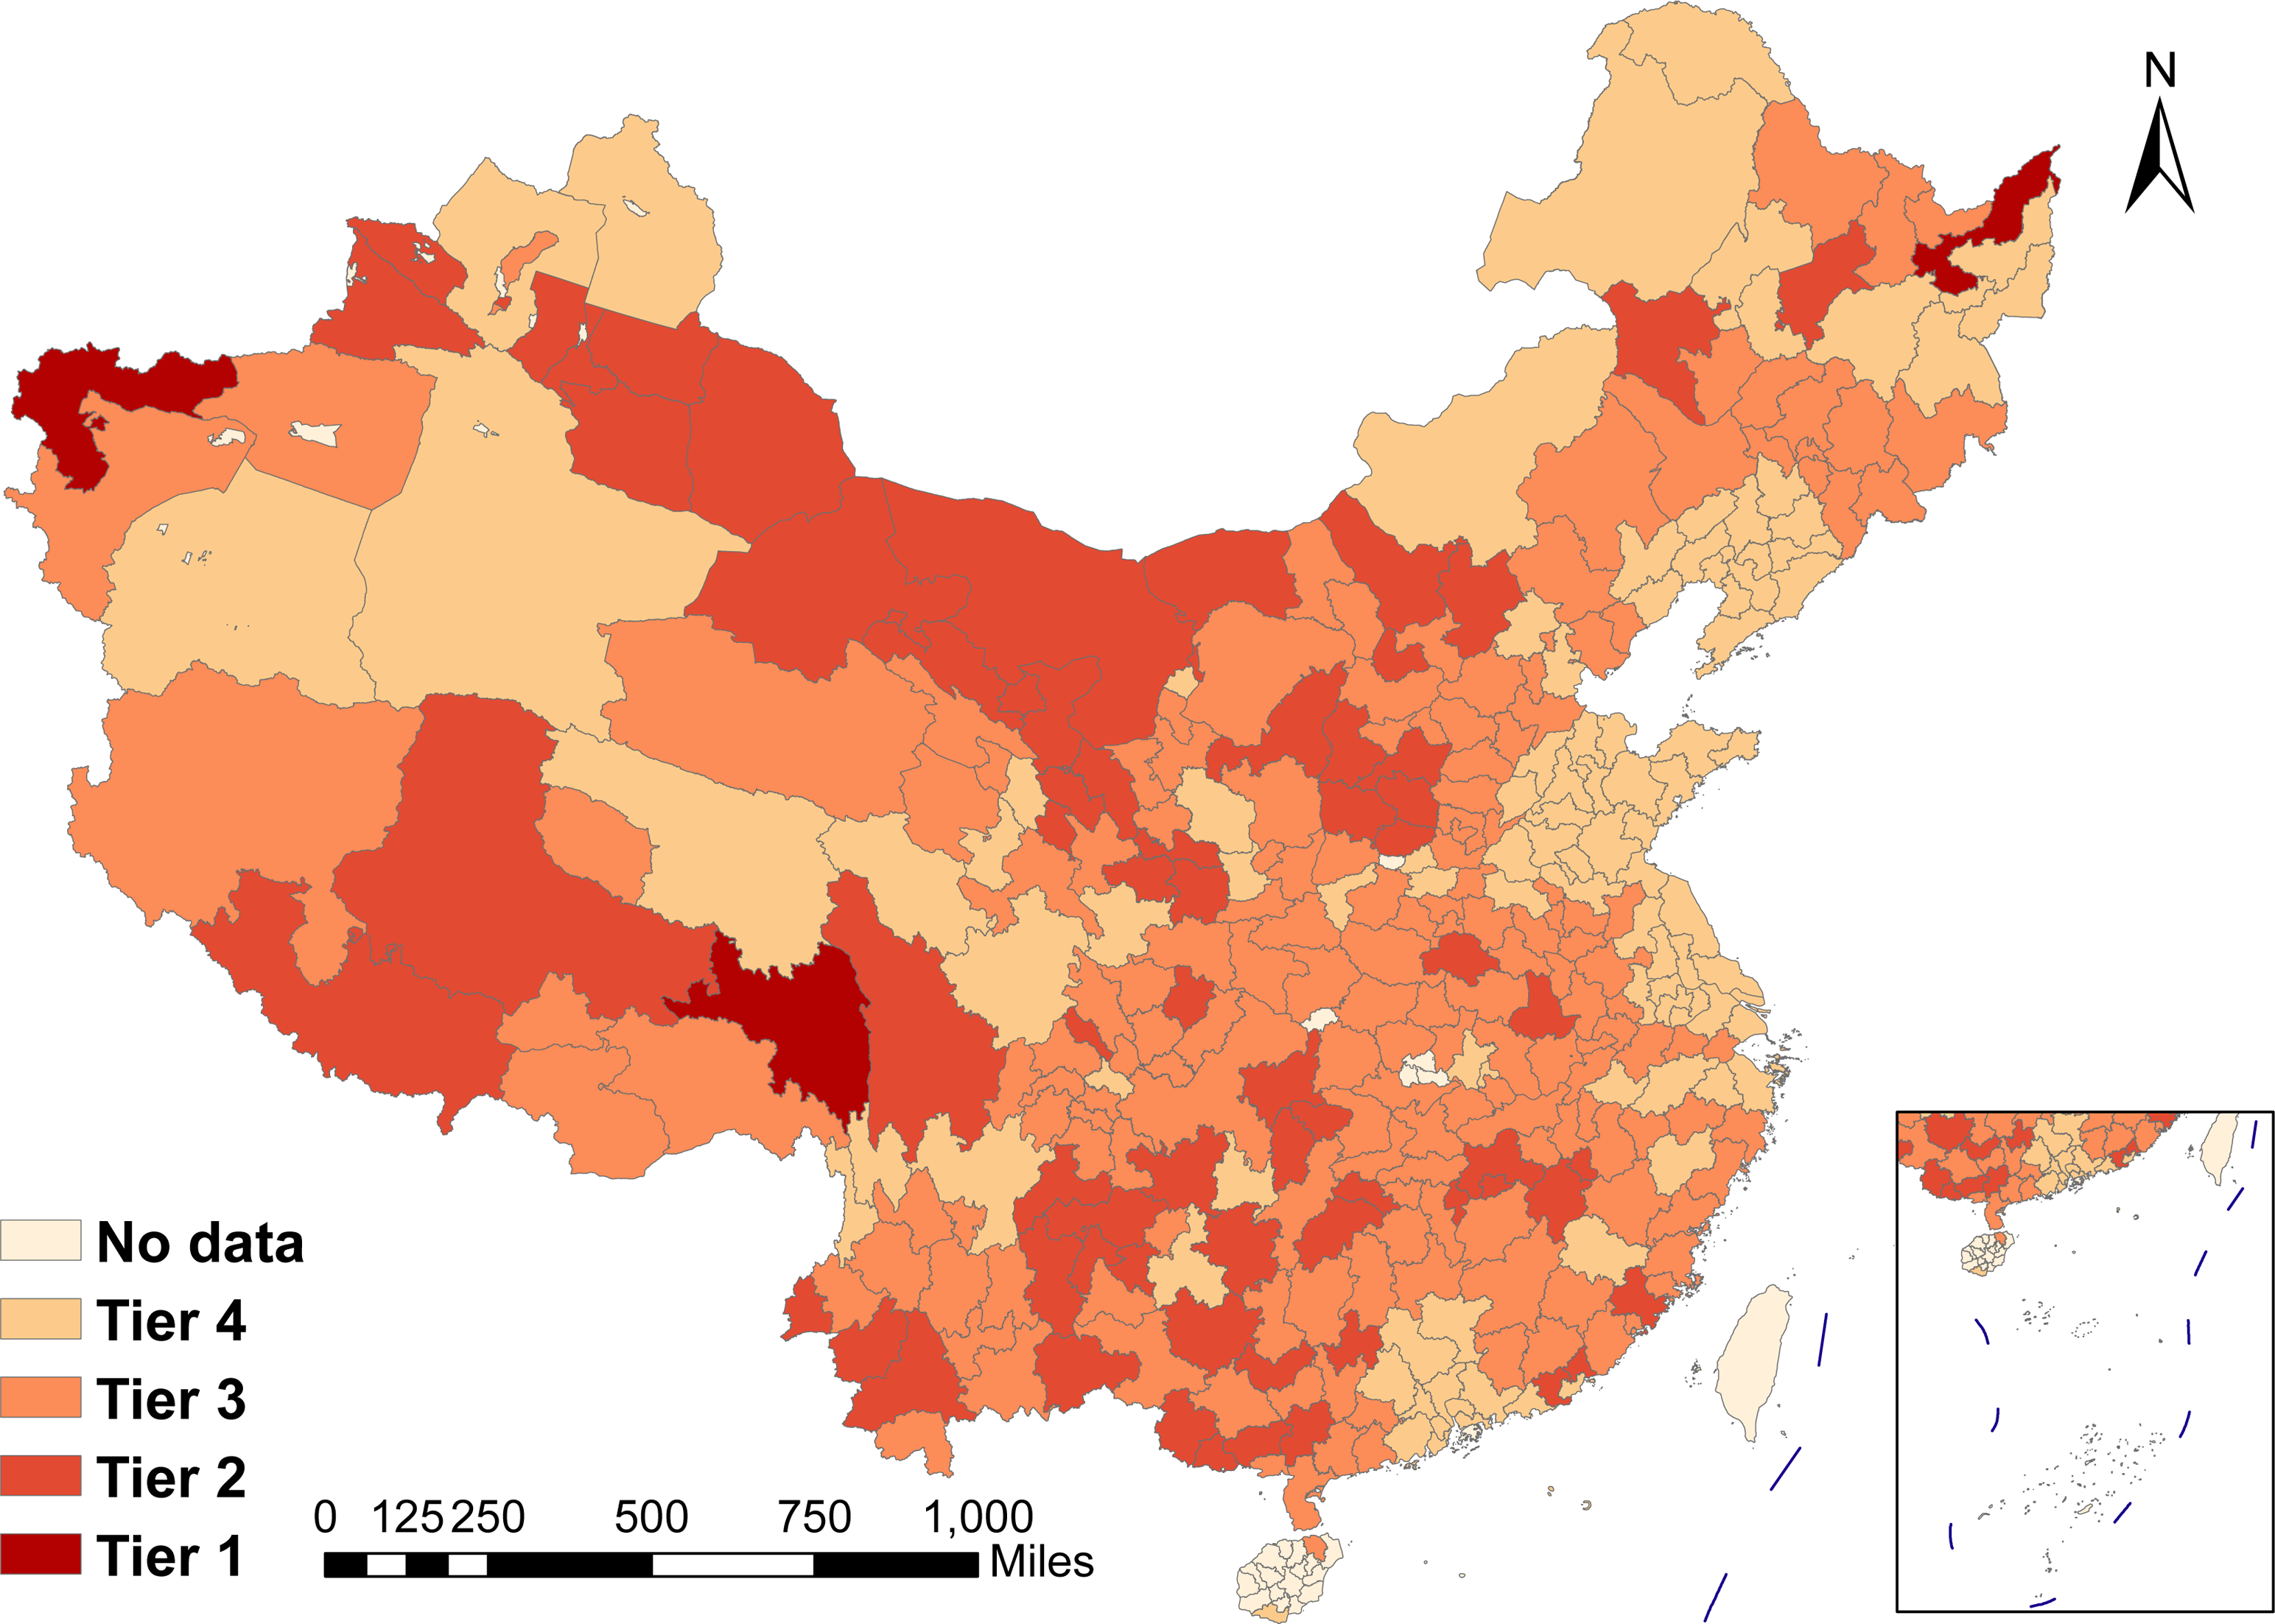
Figures 1 and 2 display the spatial distribution of the DFI index in 2019 and the growth rate of the DFI index from 2011 to 2019, respectively. Figures 3 and 4 depict the spatial distribution of the Chinese domestic tourist arrivals in 2019 and the growth rate of the Chinese domestic tourist arrivals from 2011 to 2019, respectively. Darker colors in the figures indicate higher levels or growth rates of DFI or domestic tourism demand. There is conspicuous agglomeration and consistency in the spatial distribution of both the DFI and domestic tourism demand. Although the level is higher in the Eastern region, the growth rate is faster in the Midwest. This intuitive finding also implies that spatial rather than non-spatial models are more suitable for estimating coefficients. Digital financial inclusion index in China, 2019. Growth rate of digital financial inclusion index in China from 2011 to 2019. Domestic tourist arrivals in China, 2019. Growth rate of domestic tourist arrivals in China from 2011 to 2019.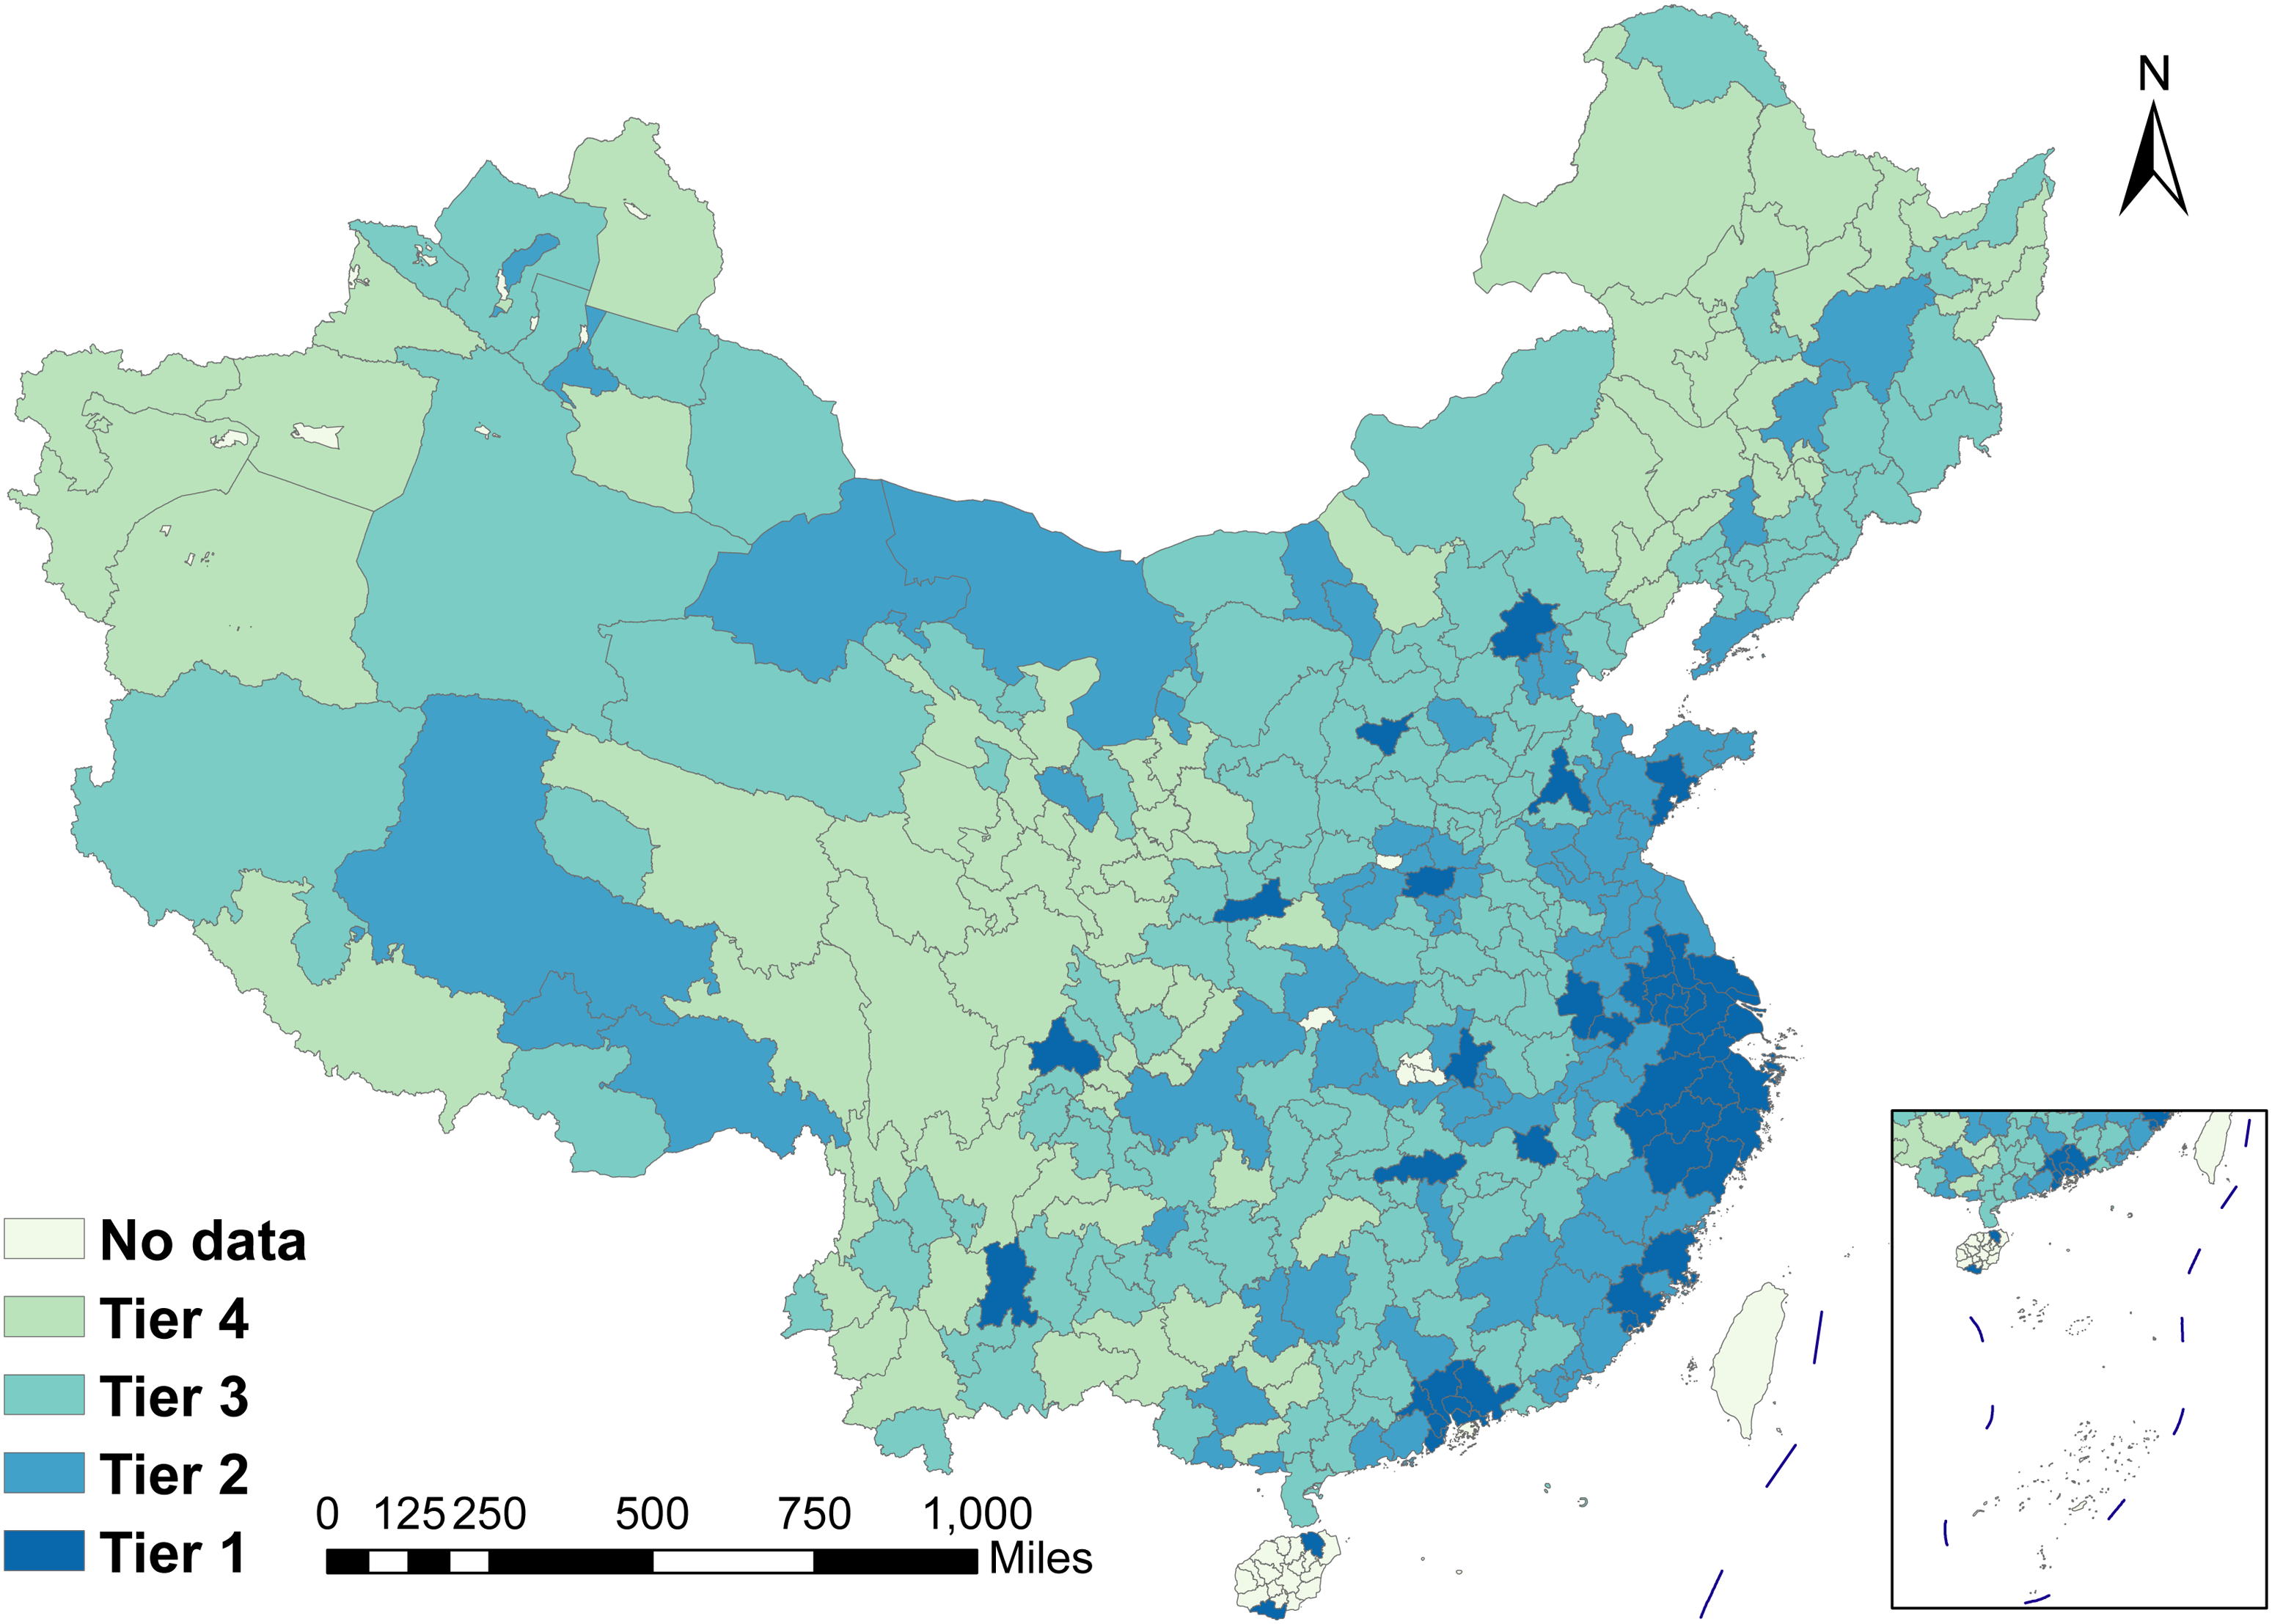
Data collect and descriptions
This study uses panel data of 335 prefecture-level regions in Mainland China from 2011 to 2019 to establish the spatial panel models. Specifically, the dependent variable is ln arrival (the logarithm of domestic tourist arrivals, in 1000) or ln revenue (the logarithm of domestic tourism revenues, in million RMB). The data for the dependent variables are from the China Premium Database in CEIC Data (https://insights.ceicdata.com) and the statistical yearbooks of prefecture-level regions in China. The primary explanatory variables consist of DFI indexes, namely, ln DFI_total (the logarithm of DFI total index), ln DFI_breadth (the logarithm of DFI coverage breadth index), ln DFI_depth (the logarithm of DFI usage depth index), and ln DFI_level (the logarithm of DFI digitization level index). With regards to other explanatory variables (control variables), we select the following ones based on the literature review and data availability. To control the influence of extreme observations, we winsorize the top and bottom 1% of all continuous variables. (i) ln road_den is the logarithm of road density in a region (in km/km2), which indicates the capacity of land transport facilities in a region (Tian et al., 2022; Yang and Wong, 2012). Data on road density (road length divided by administrative area) are also obtained from the China Premium Database in CEIC Data. (ii) ln flight is the logarithm of one plus the flight number at all civil aviation airports (CAAs) within a region, which measures the capacity of air transport facilities in a region (Chow et al., 2021; Tian et al., 2022; Yang and Wong, 2012). We first collect the flights number at each CAA from the annual CAA production statistics report issued by the Ministry of Transport of China (https://www.mot.gov.cn/), and then aggregate it by region. (iii) ln resource is the logarithm of one plus the number of 5A-level scenic spots and national parks within a region. This variable captures the tourism resource endowment. We refer to Yang and Fik (2014) to construct this weight variable, in which 5A-level scenic spots and national parks each contribute half the weight. The World Heritage sites mentioned in the previous literature (Yang et al., 2014) are not considered as most of them fall under the categories of 5A-level scenic spots or national parks. The relevant data are from the websites of Ministry of Culture and Tourism of China (https://www.mct.gov.cn/) and Ministry of Housing and Urban-Rural Development of China (https://www.mohurd.gov.cn/). (iv) ln GDP_per is the logarithm of the real GDP per capital in constant prices of 2011 (in RMB). This variable reflects the income level in a region (Tian et al. 2022; Yang and Wong 2012). Regions with higher income levels invest more in tourism, which means better tourism infrastructure and better experience for tourists. GDP data is also collected from the China Premium Database in CEIC Data.
Descriptive statistics of variables.
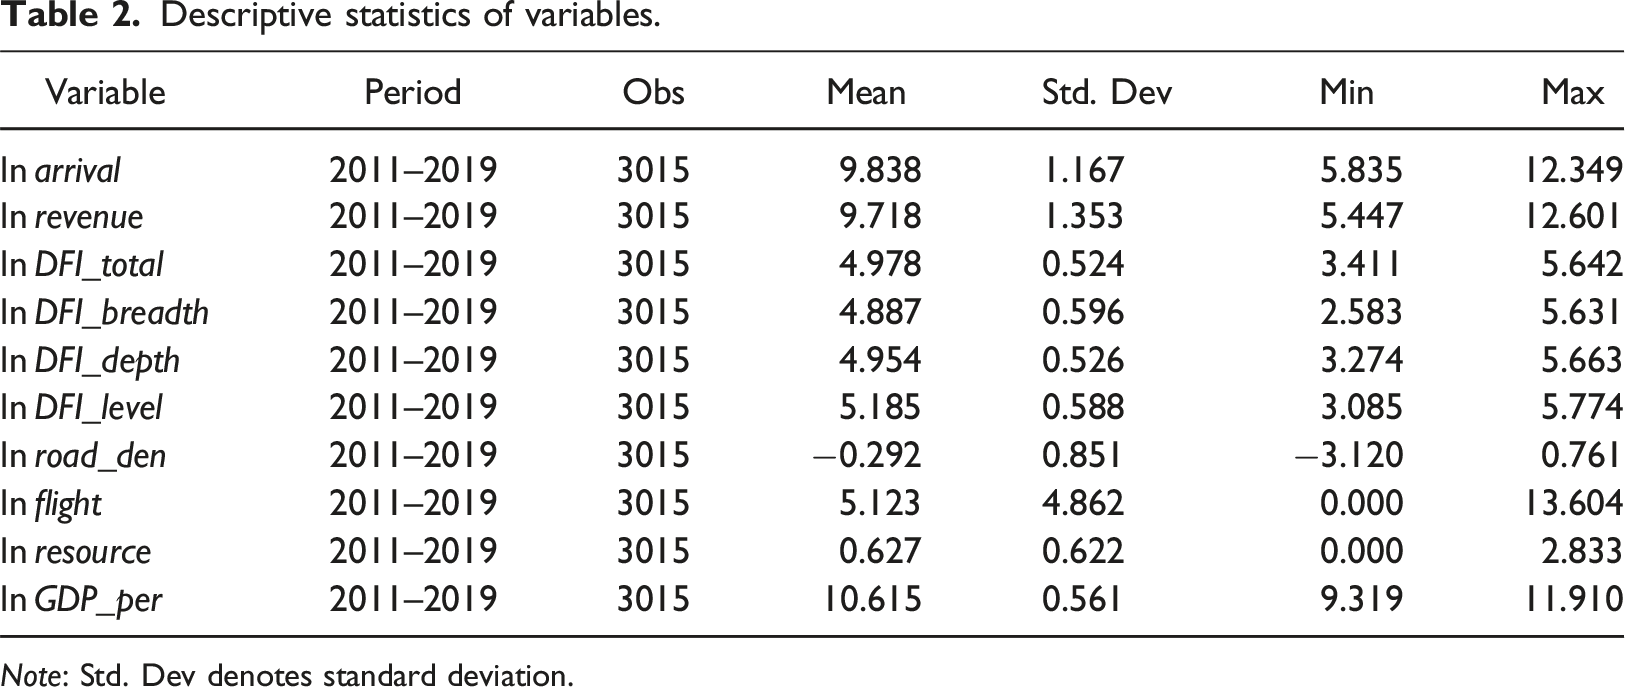
Note: Std. Dev denotes standard deviation.
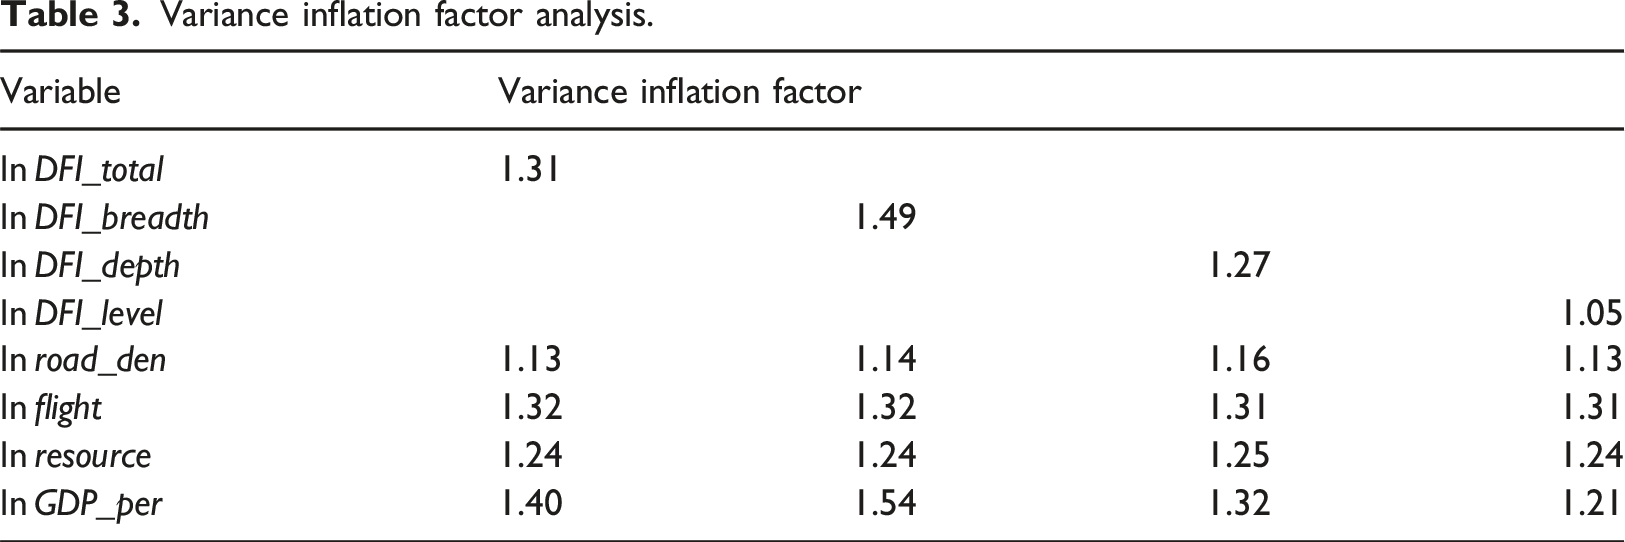
Variance inflation factor analysis.
Panel unit root tests.
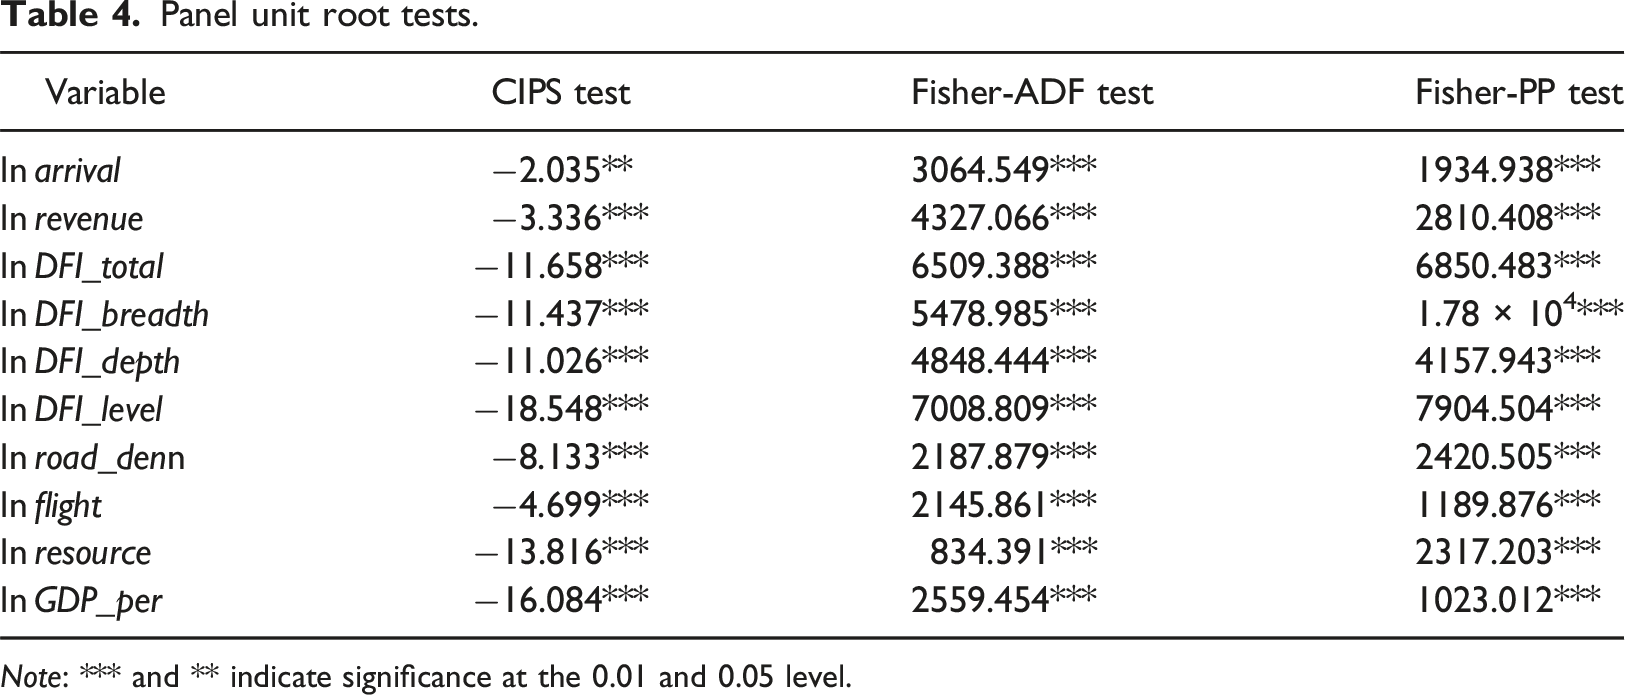
Note: *** and ** indicate significance at the 0.01 and 0.05 level.
Spatial panel models
The common spatial panel models include spatial auto-regressive (SAR) model, spatial error model (SEM), and spatial Durbin model (SDM). The SAR model incorporates the spatially lagged dependent variable, which takes the following specification form: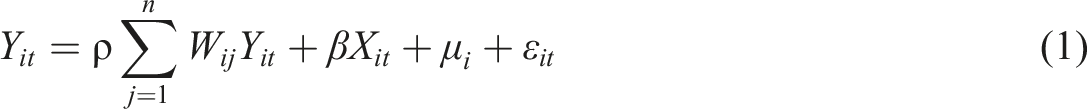
The SEM contains the spatial lagged error term to reflect the spatial correlation of omitted and unobservable factors, which is in the form of
The SDM is the extension of the SAR model, which includes the spatial lagged dependent and all explanatory variables. The SDM is specified as follows:
Given the spatial lags of the dependent variable and explanatory variables in spatial panel models (except for SEM), the marginal effect of the explanatory variables on the dependent variable is not equal to the coefficients estimated by the models (Yang and Fik, 2014; Zhang et al., 2021). LeSage and Pace (2009) propose an approach to decompose complicated spatial effects to obtain direct, indirect, and total effects. The direct effect measures the impact of the explanatory variables in the focal region on the dependent variable in the same focal region, including the feedback effect via neighboring regions. The indirect effect, also known as spatial spillover effect, measures the influence of the explanatory variables in the focal regions on the dependent variable in the neighboring regions. The total effect is the sum of the direct effect and indirect effect, measuring the cumulative impact of the explanatory variables in the focal region on the dependent variable in all regions.
This study adopts the Stata command of xsmle, developed by Belotti et al. (2017), to establish these spatial panel models. In xsmle, all spatial panel models are fitted by quasi-maximum likelihood estimation. The spatial weight matrix specifies the connection form and influence degree between spatial regions. We follow the pioneers of spatial tourism demand research in China (Yang and Fik, 2014; Yang and Wong, 2012) and adopt the K-nearest neighbor matrix, in which W ij equals 1 if region j is the one of the K-nearest regions to region i, otherwise W ij equals 0. The K-nearest neighbor matrix is the composite of adjacency matrix (including bishop, queen, and rook) and distance-based matrix, which contributes to the balance of weight matrix structure and the stability of model convergence.
Empirical results
Spatial autocorrelation
We first conduct spatial autocorrelation tests on the dependent variables and DFI indexes. The Moran’s I is one of the most popular methods for measuring spatial autocorrelation of variables (Akamavi et al., 2022; Deng and Hu, 2019), which can be expressed in the following equation: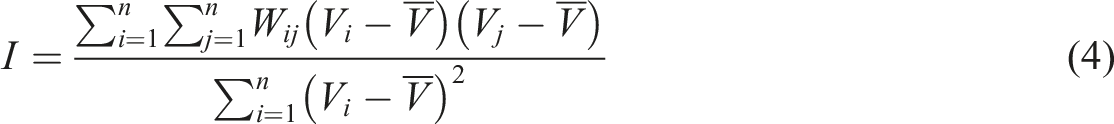
Moran’s I values of main variables.
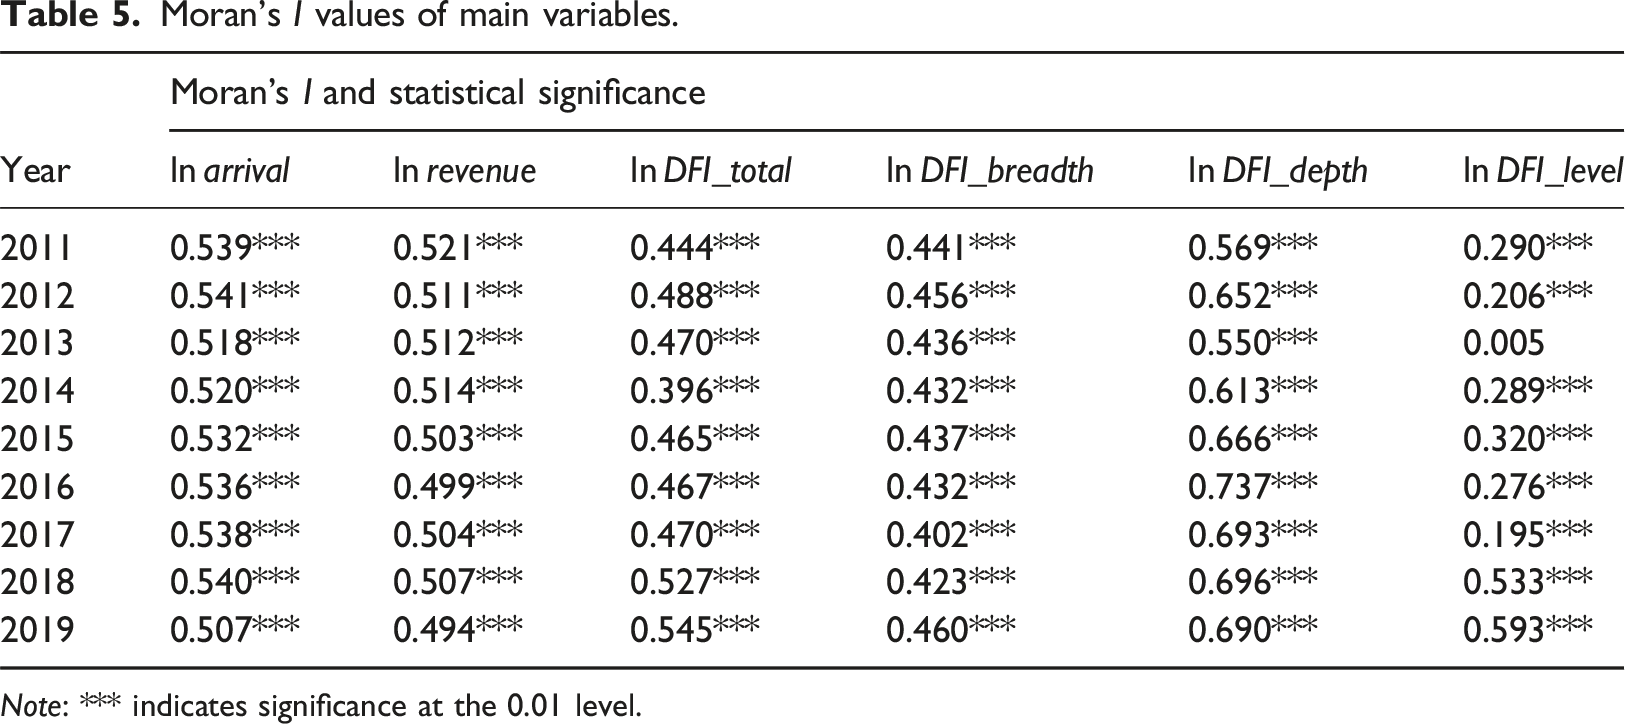
Note: *** indicates significance at the 0.01 level.
Estimation results
Estimates of Non-spatial and spatial panel models.
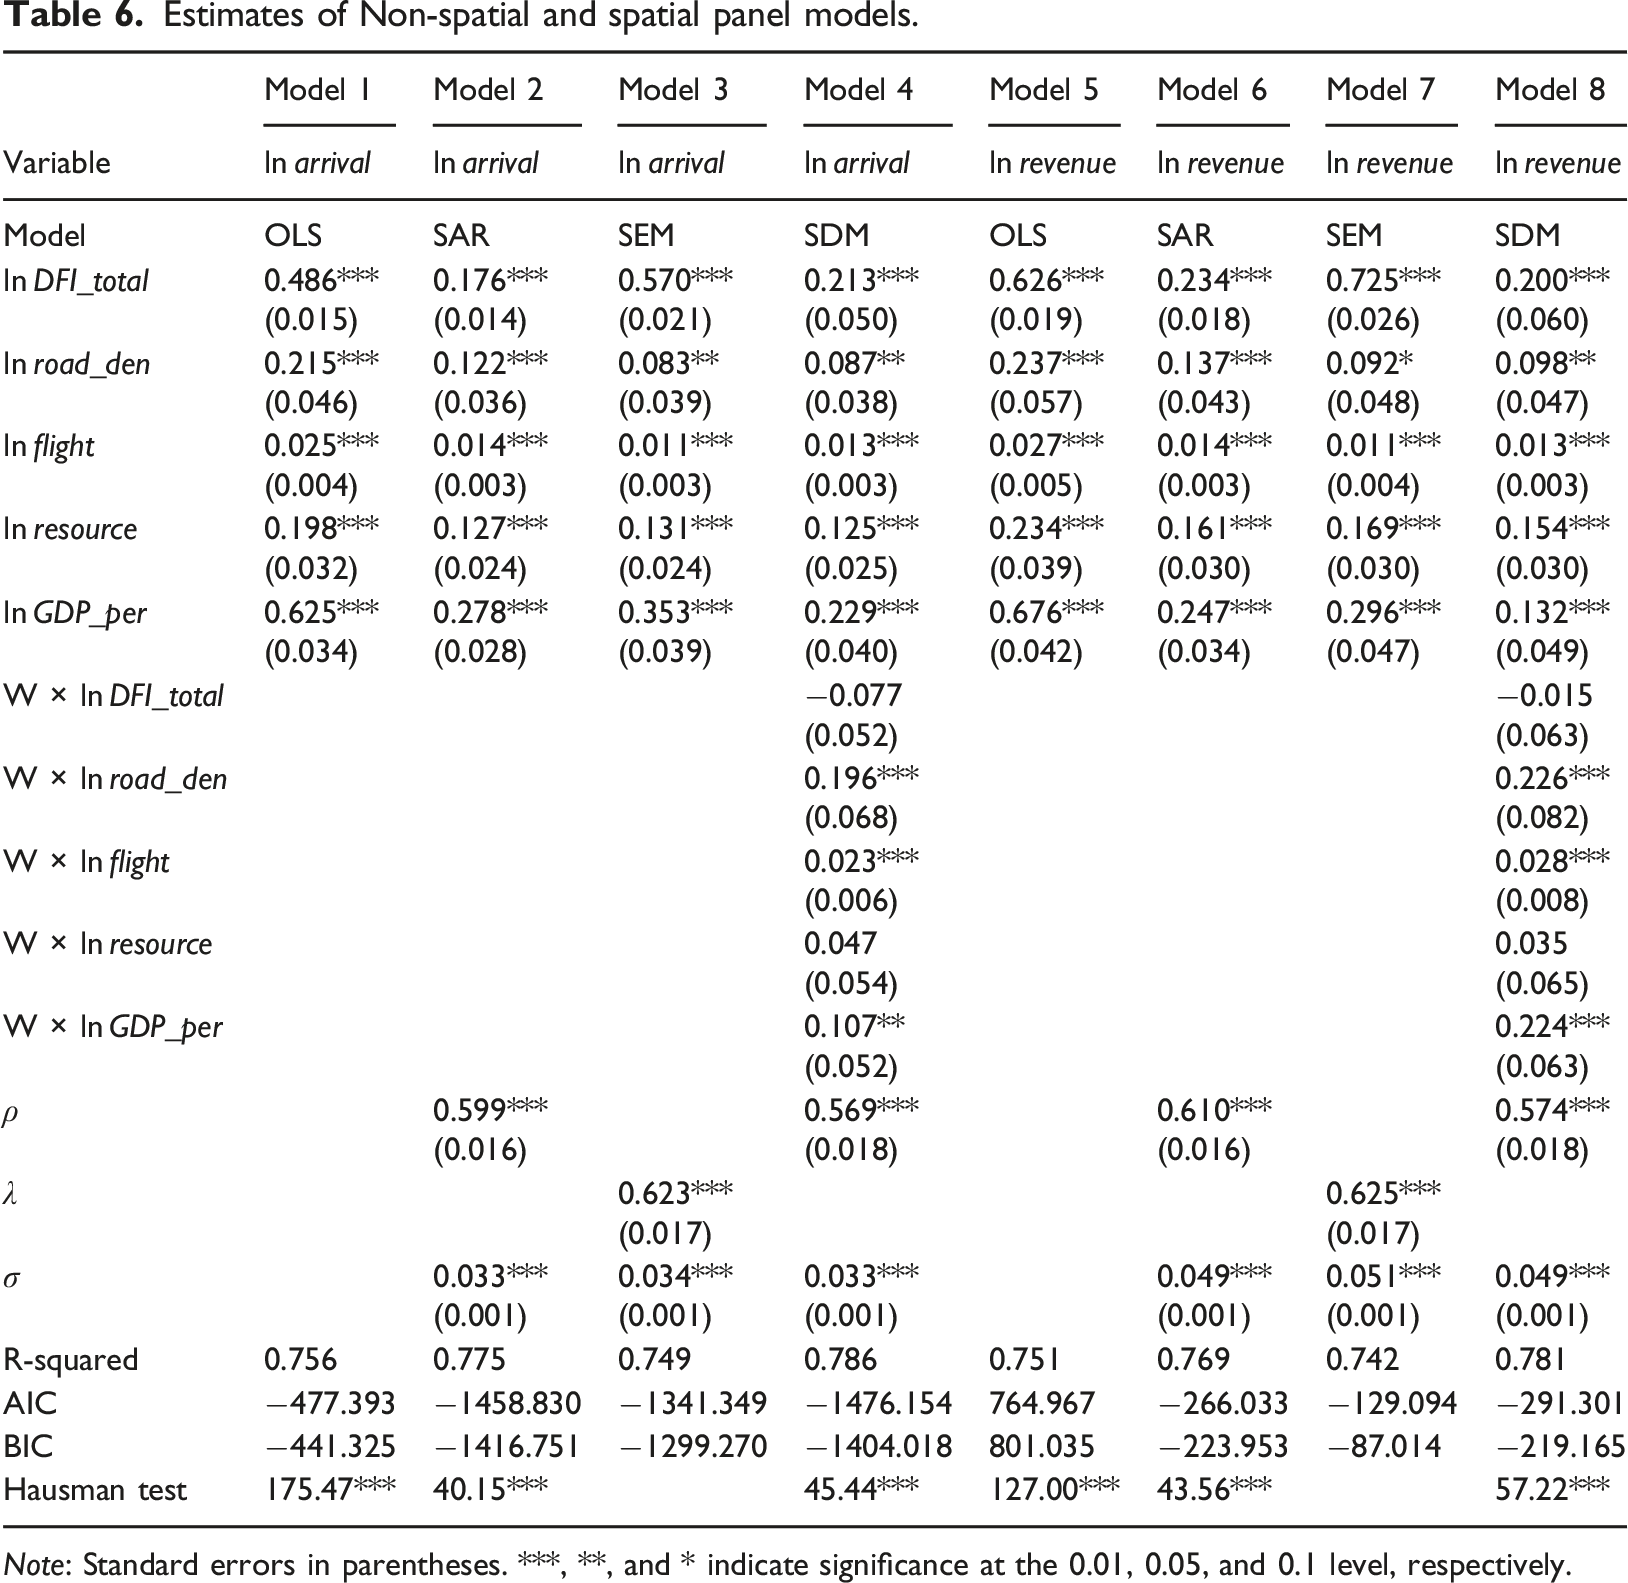
Note: Standard errors in parentheses. ***, **, and * indicate significance at the 0.01, 0.05, and 0.1 level, respectively.
The results of the robust Hausman test are all positive and significant, which supports the usage of fixed effect (FE) rather than random effect (RE) in panel models. Kim et al. (2021) suggest that FE is better suited to spatial data for all regions of a country because FE can mitigate potential bias caused by omitted variables.
Model 1 and 5 (OLS models) in Table 6 reveal the significant promoting of DFI and control variables on domestic tourism demand, among which the coefficient of ln GDP_per ranks first and the coefficient of ln DFI_total ranks second. Model 2–4 and 6–8 present the estimation results of spatial panel models for domestic tourist arrivals and domestic tourism revenues, respectively. The SDM specifications (Models 4 and 8) have the best fit by combining R-squared, Akaike information criterion (AIC), and Bayesian information criterion (BIC) values, compared with the other two spatial panel models and non-spatial panel models. This highlights that the inclusion of spatial lags of the independent variables favorably improves the goodness of fit of models. Consequently, the interpretation of the models focuses on the SDM specification, which also allows the investigation of spatial spillover effects of DFI. 6
Decomposition of spatial effect.
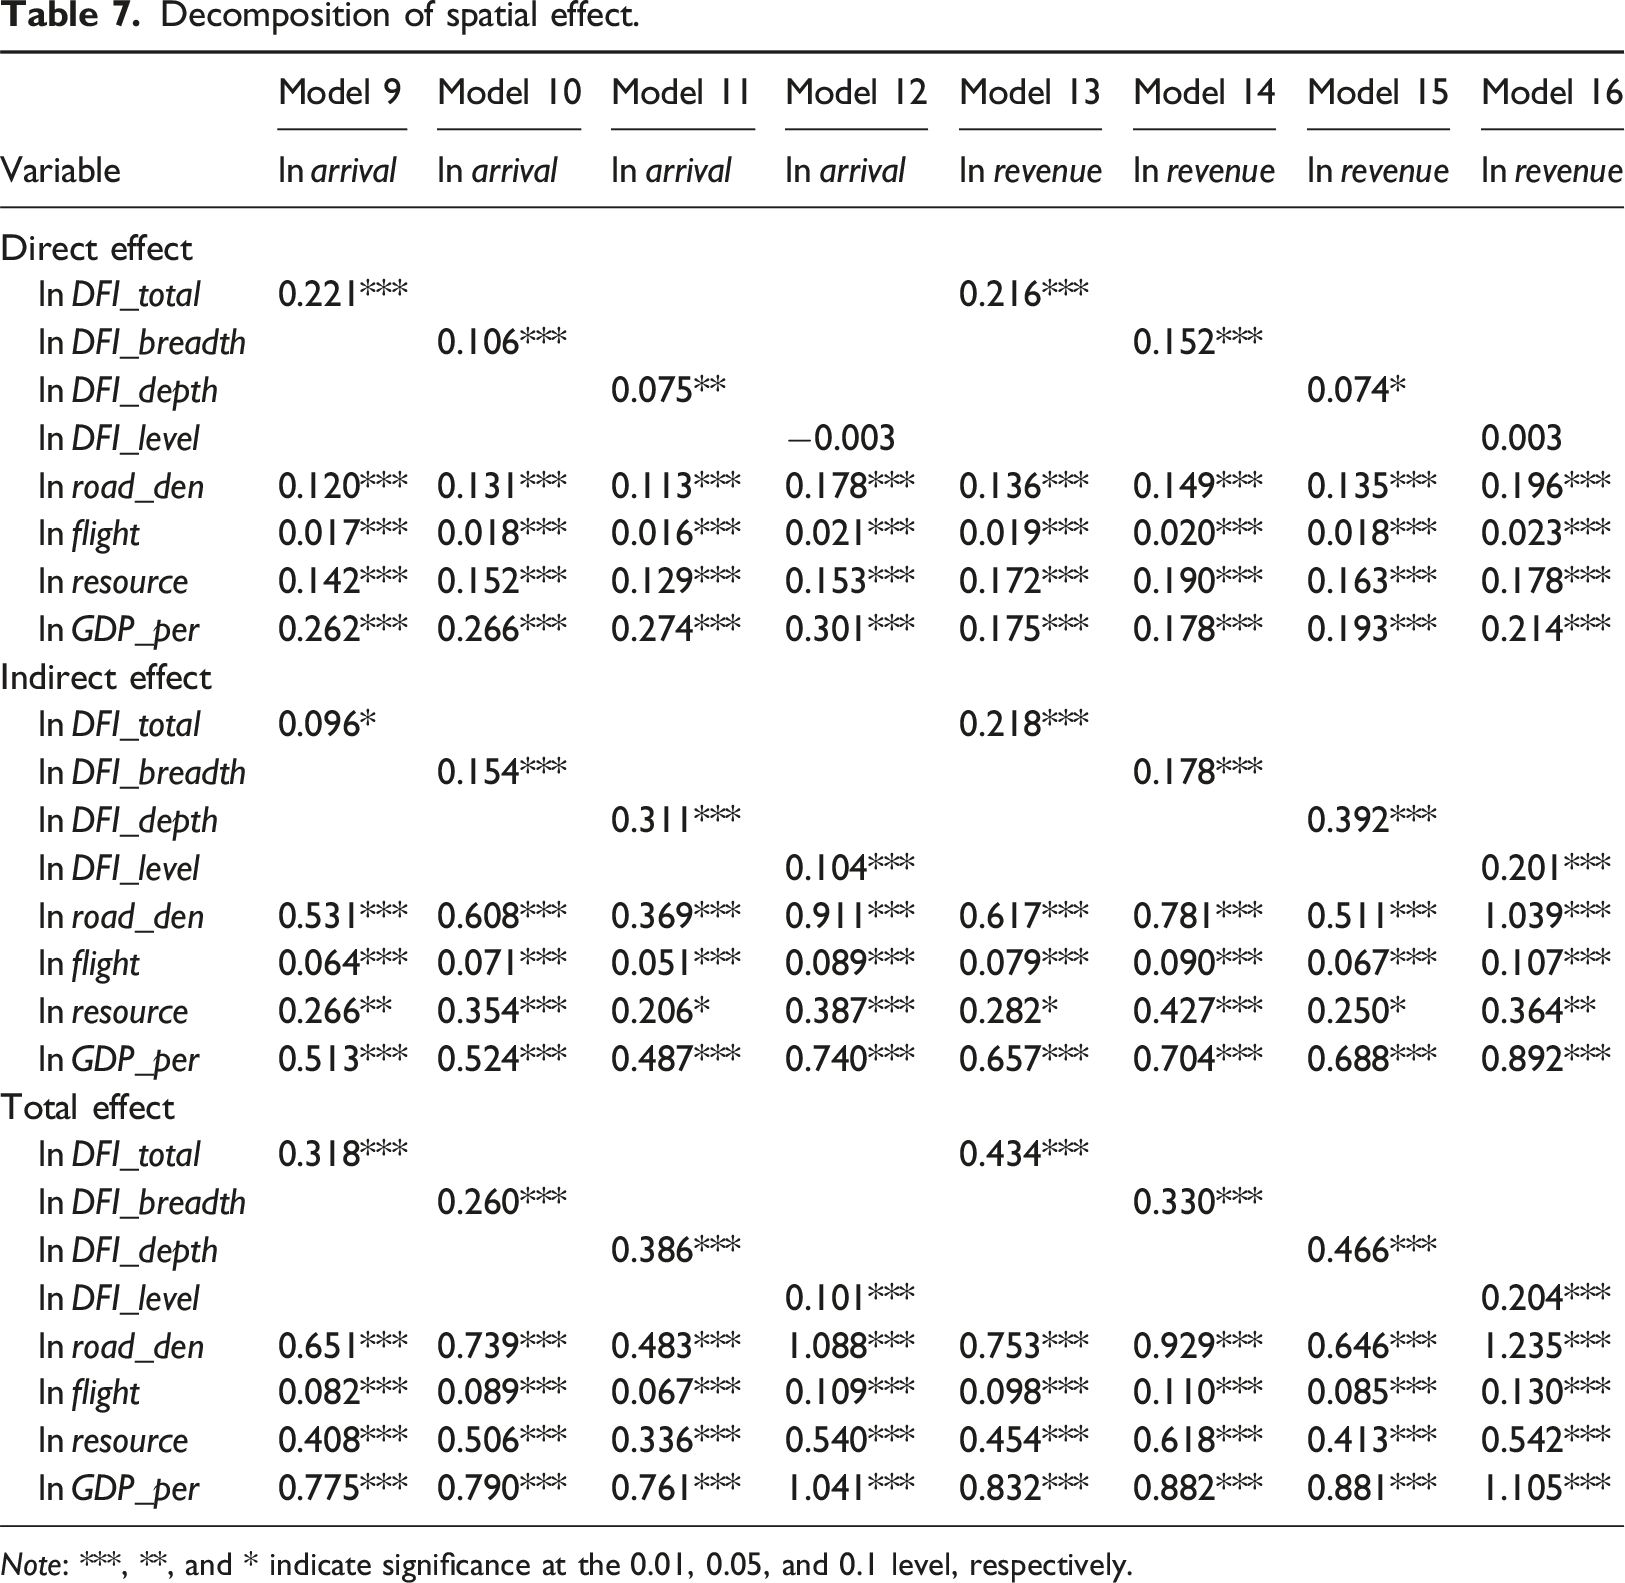
Note: ***, **, and * indicate significance at the 0.01, 0.05, and 0.1 level, respectively.
In addition, the direct and spillover effects of control variables such as ln road_den, ln flight, ln resource, and ln GDP_per are significantly positive with the expected signs. Among them, the coefficient of ln GDP_per is the largest in almost all the models, both the direct and spillover effects, which highlights the crucial role of economic development and income increase in increasing the domestic tourism demand.
Robustness checks
To confirm the findings of this study are robust, a battery of checks are implemented. First, the measures of tourism demand typically include tourist arrivals and tourism revenues (Song et al., 2023b). In our study, the consistent estimation results of models with the above two variables as dependent variables can support each other.
Estimations under alternative spatial weight matrices.
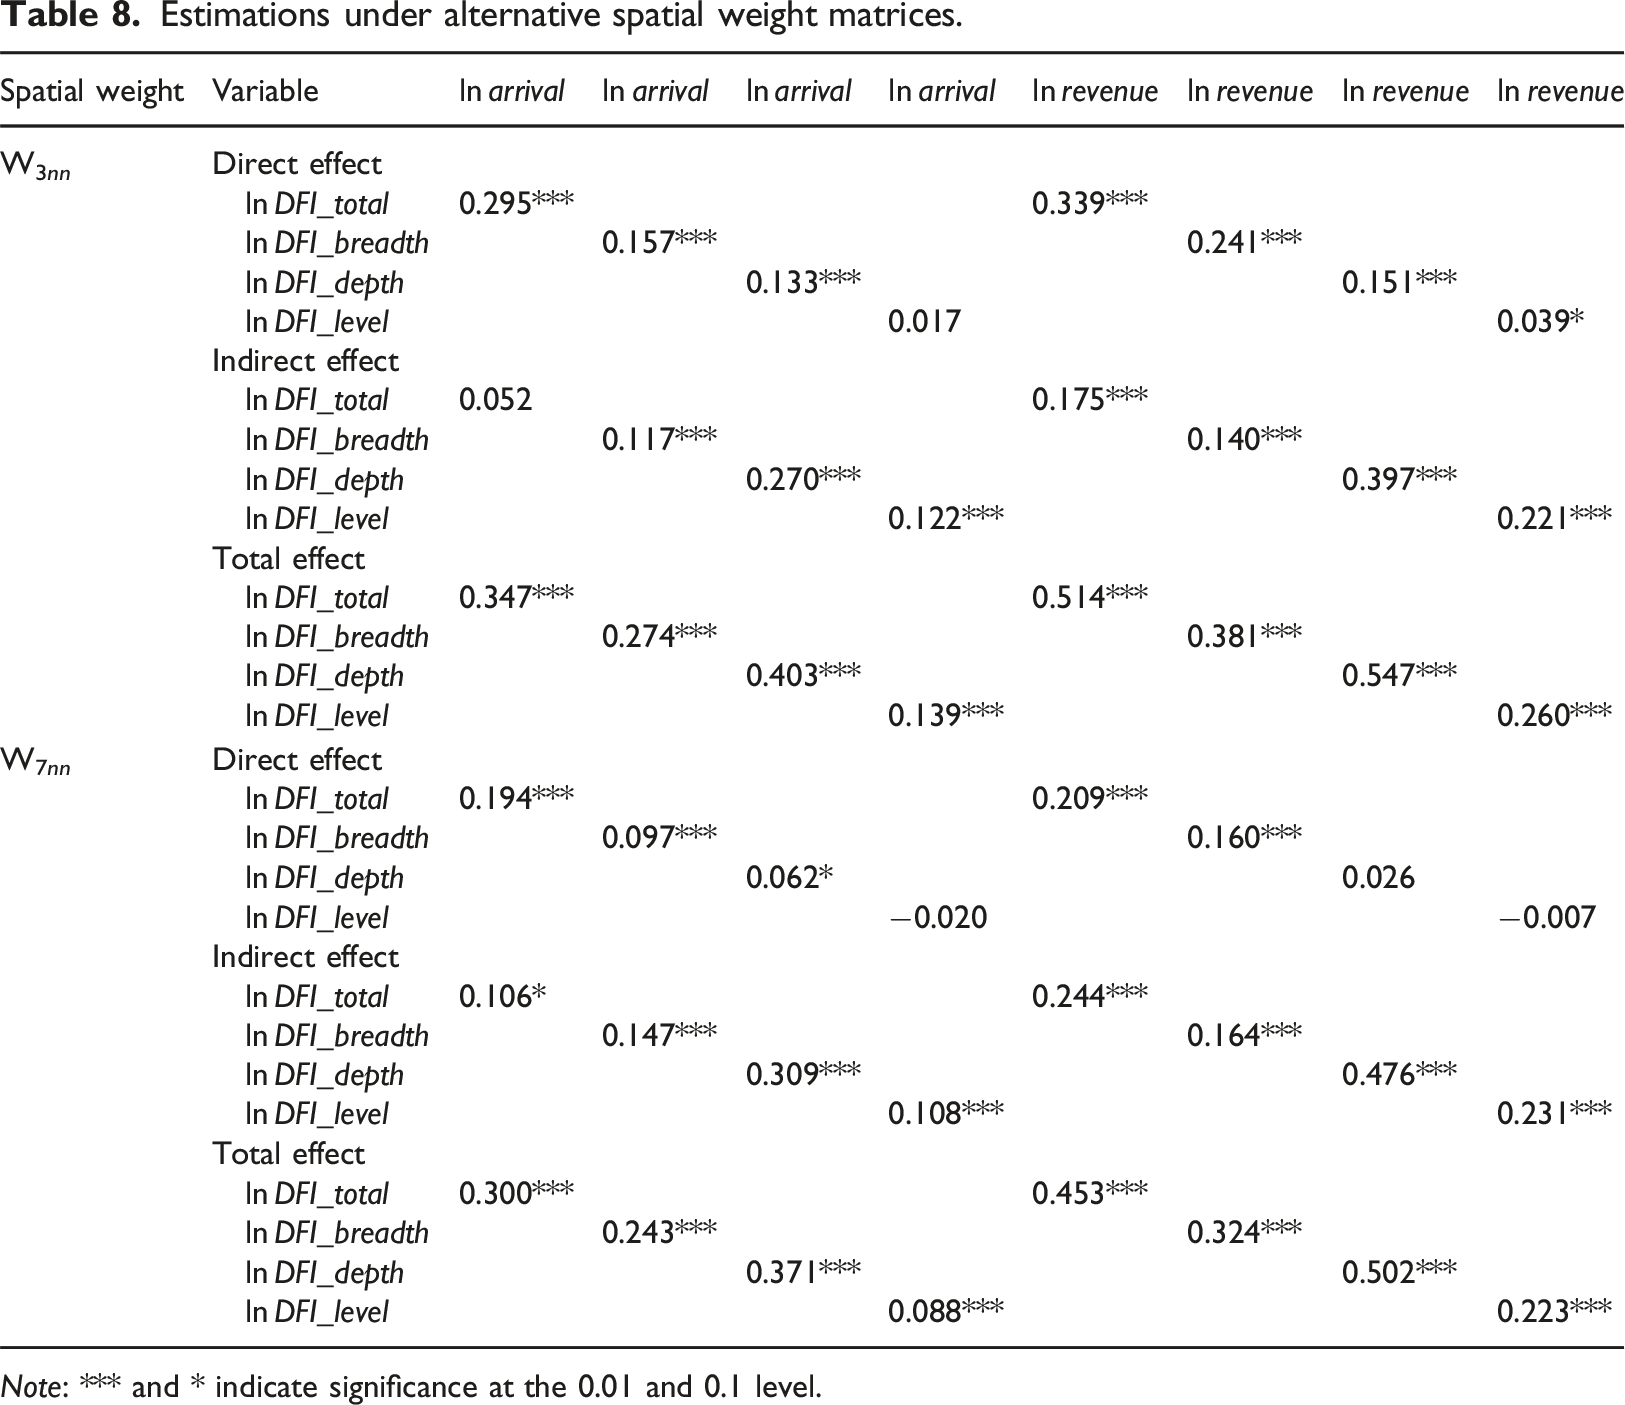
Note: *** and * indicate significance at the 0.01 and 0.1 level.
Estimations in the sub-sample periods.
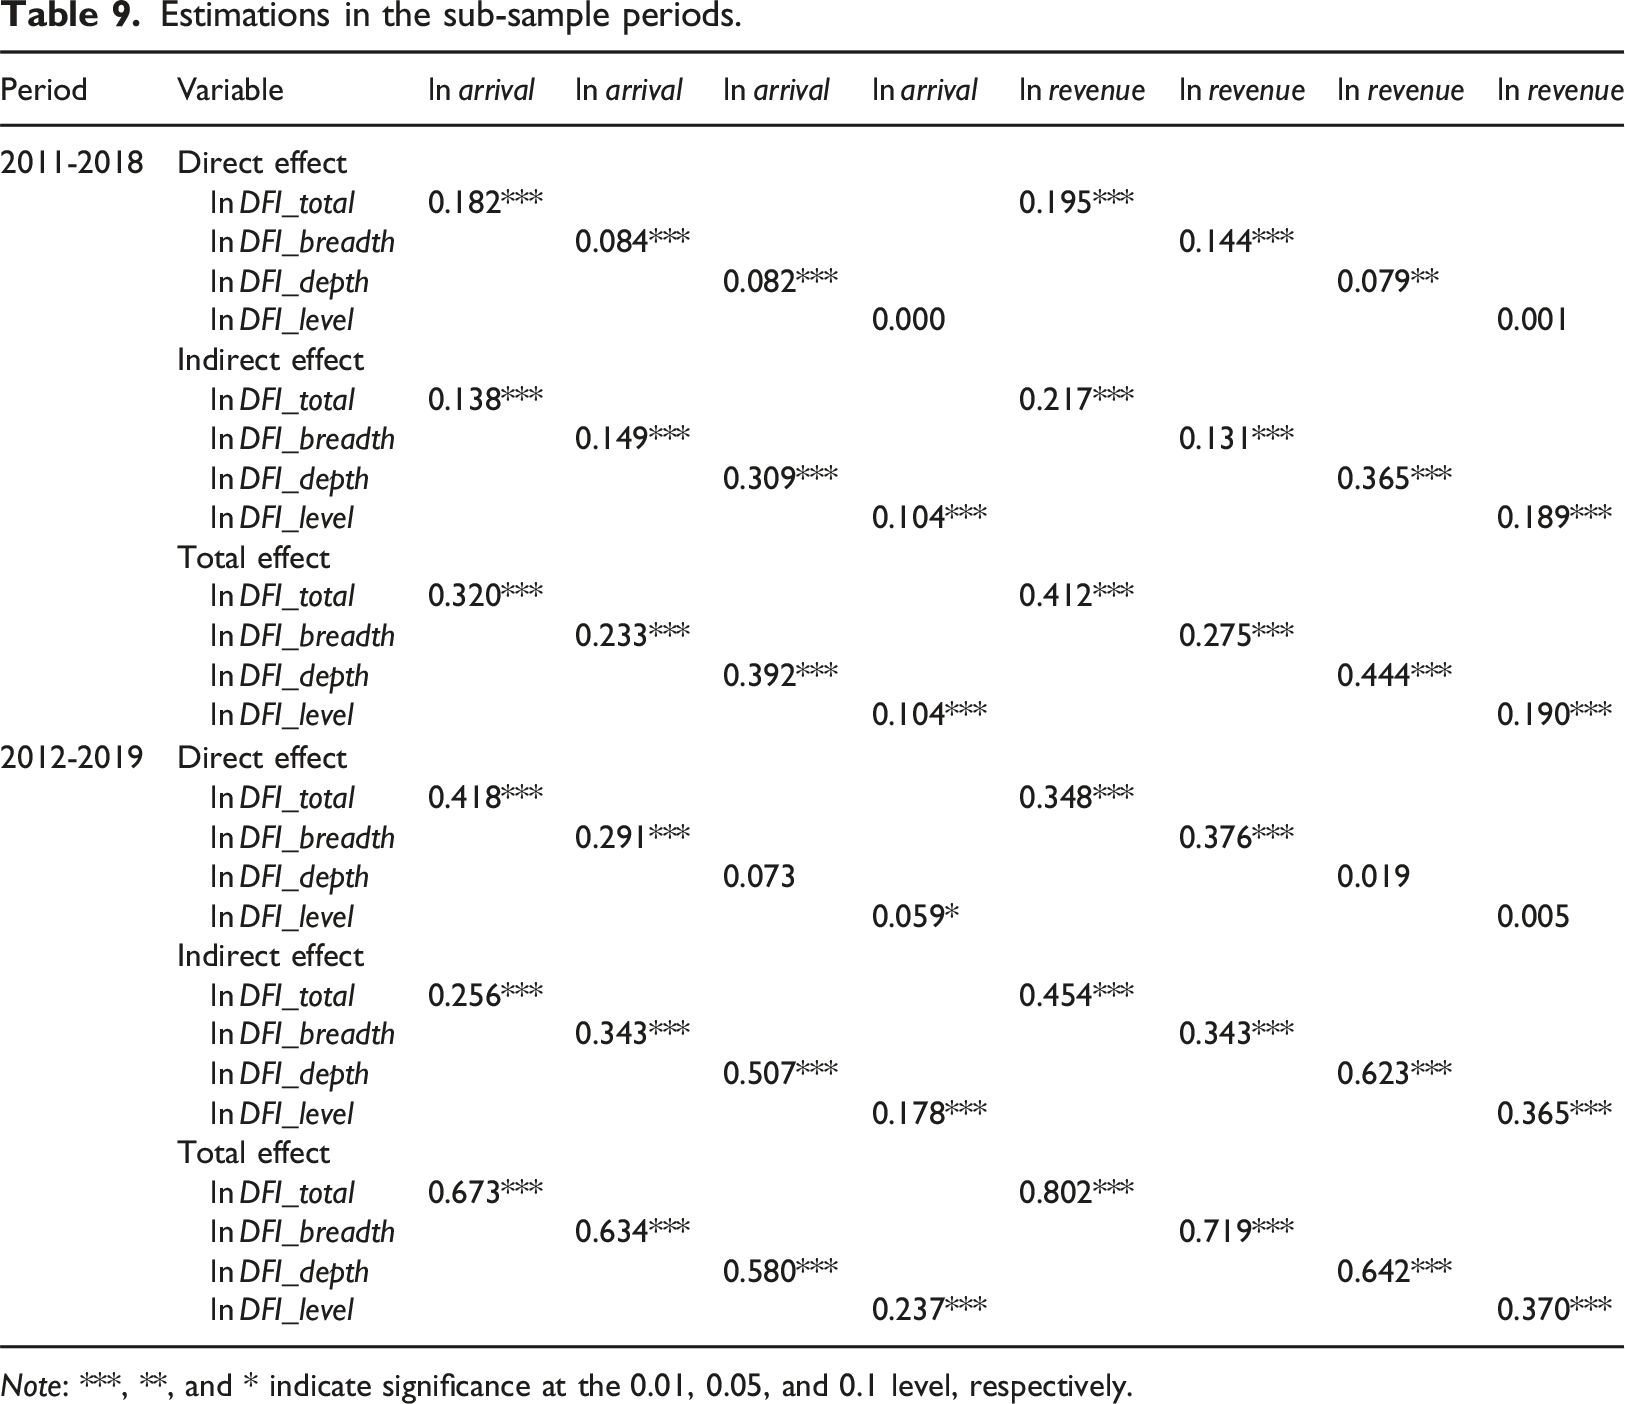
Note: ***, **, and * indicate significance at the 0.01, 0.05, and 0.1 level, respectively.
Estimations under the DFI indexes with a one-year lag.
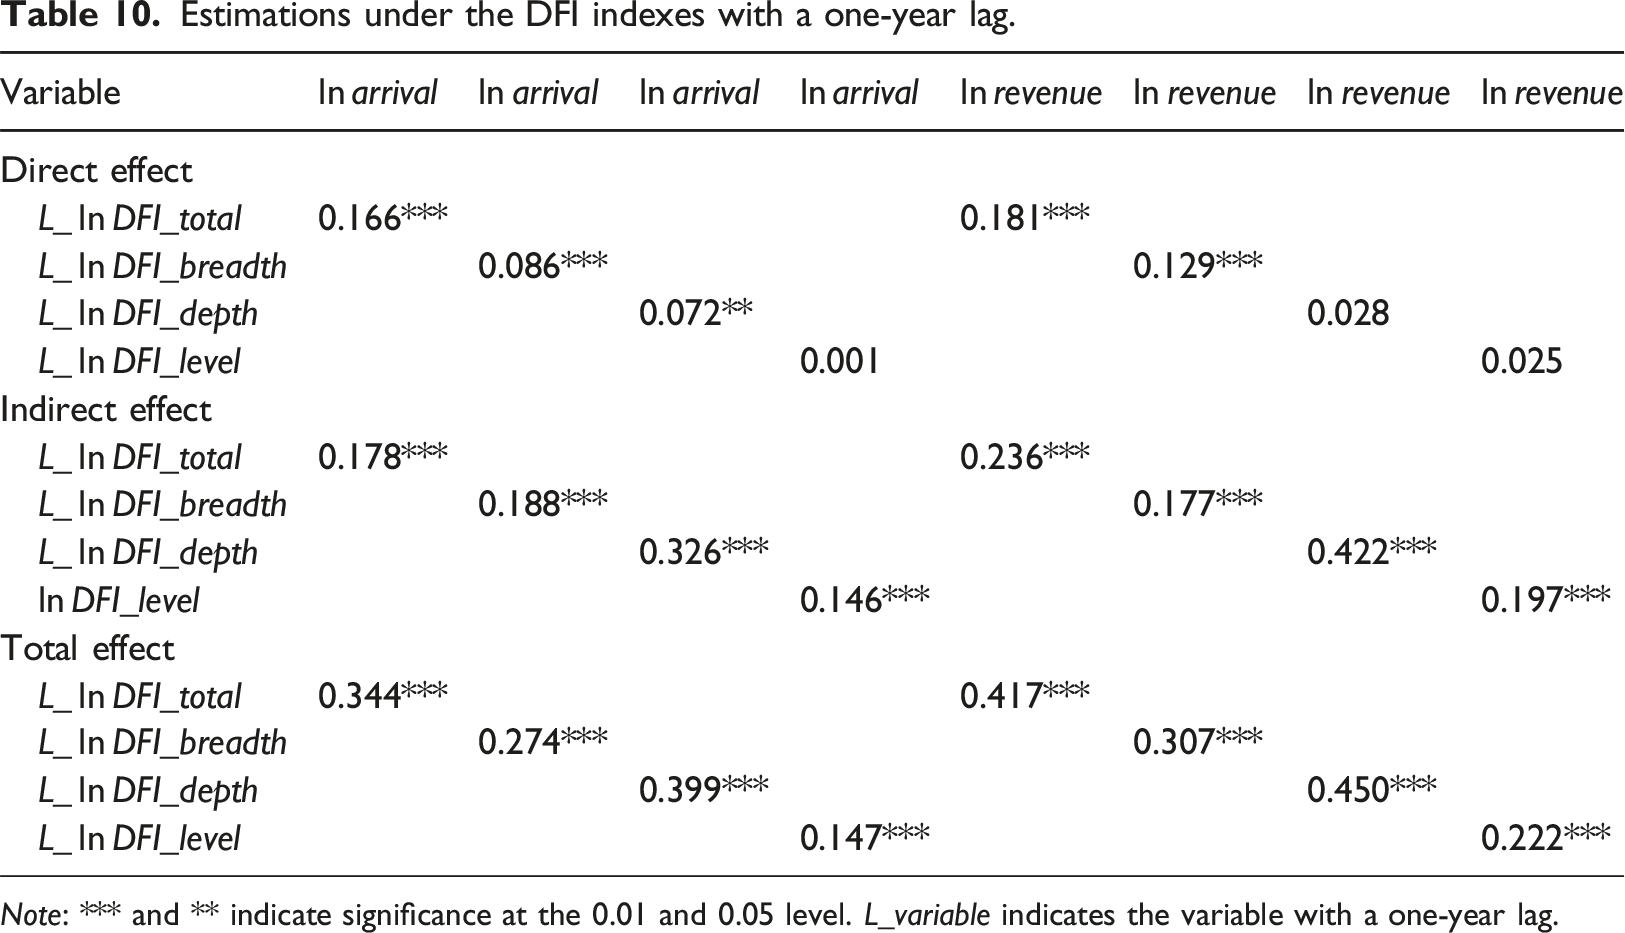
Note: *** and ** indicate significance at the 0.01 and 0.05 level. L_variable indicates the variable with a one-year lag.
Discussion and conclusion
Domestic tourism has been praised for reducing spatial inequality, mitigating seasonality and leakage, and being more sustainable (Canavan, 2013; Stone and Nyaupane, 2019). For example, Goh et al. (2015) and Li et al. (2016) state that compared with international tourism, domestic tourism can better promote balanced regional development and reduce regional income inequality in China. A recent study also suggests the importance of domestic tourism in reducing economic vulnerability (Canh and Thanh, 2020). Tourism enterprises have also been benefited from domestic tourism. During the COVID-19 pandemic, many tourism enterprises have turned to domestic tourism to stay afloat. The low entry barrier of domestic tourism has allowed household/unregistered SMEs to participate, thereby improving livelihoods and boosting social welfare (Seyfi et al., 2022).
DFI, which involves providing formal financial services to previously excluded individuals and businesses through digital means, has attracted increasing attention from governments, academics, and practitioners in recent years (Demir et al., 2022; Hu et al., 2023; Yang and Zhang, 2022). In the context of global tourism, especially domestic tourism, recovering from the COVID-19 pandemic, it is of great significance to understand the mechanism of DFI in boosting domestic tourism demand. In this study, we estimate and analyze the direct and spatial spillover effects of DFI on domestic tourism demand with region-level balanced panel data.
The main findings and implications are as follows. During the sample period, the total index of DFI and its sub-indices in three dimensions exhibit significant spatial autocorrelation, which are consistent with the two measures of domestic tourism demand, namely, domestic tourist arrivals and tourism revenues. DFI and its three dimensions have significant and positive direct and spillover effects on domestic tourism demand, among which the spillover effects and total effects of the usage depth are larger than those of the other two dimensions. These findings emphasize the importance for regional planners and policy makers to not only develop DFI comprehensively and in a coordinated manner but also focus on enhancing the usage depth of DFI. Moreover, the spillover effects of DFI on domestic tourism demand in the tourist revenues models are larger than that in the corresponding tourism arrivals models, highlighting the effectiveness of DFI in internalizing regional tourism economic benefits.
The current digital economy is fundamentally reshaping the tourism industry (Perelygina et al., 2022; Sharma et al., 2020). As a crucial infrastructure for digital economy development, DFI connects financial institutions, tourism enterprises, and tourists through the establishment of digital financial platforms and the application of digital technologies, promoting the allocation and flow of financial resources and enhancing the efficiency and vitality of the tourism economy. Governments should prioritize the implementation of digital platforms and technologies, such as DFI, and incorporate them into strategic planning and policy frameworks. Tourism enterprises, especially SMEs, should actively embrace the digital trend, fostering business model innovation, improving operational efficiency, and providing tourists with more convenient and comfortable services.
A study closely related to our research is Gopalan and Khalid (2022), which mainly focuses on the impact of (traditional) financial inclusion on (international) tourism demand in the context of emerging markets and developing economies. They also investigated the role of DFI through several isolated indicators. In contrast, we adopt a composite DFI index system and limit the study scope to domestic tourism demand by fully considering the applicability of this index system. 7 Our findings support the pending hypothesis of Gopalan and Khalid (2022) about DFI. Moreover, from a methodological perspective, we also identify the spatial spillover effect of DFI with the help of spatial econometric techniques.
A recent authoritative review graphically illustrates the determinants of tourism demand that have been revealed in research over the past five years (Song et al., 2023b). Silva et al. (2017) and Silva and Hassani (2022) comprehensively summarize the leading indicators related to tourism demand forecasting explored by the study published during the period of 1997 to 2021. These determinants and leading indicators mainly include economic variables (e.g., income-like and price-like variables), transport variables (e.g., expressway mileage), environment and climate variables (e.g., air quality), political stability variables, and Internet data (e.g., Google search intensity index). The determinants are leading indicators in the specific forecast scenarios, while the leading indicators are often reflectors to tourism demand rather than determinants (Song et al., 2023b). In this study, we identify DFI as a determinant of domestic tourism demand. It is foreseeable that DFI has the potential to serve as a candidate leading indicator to help improve the performance of annual tourism demand forecasting in the digital economy era. In the context of the COVID-19 pandemic, tourism demand forecasting has shifted to a fine-grained forecasting paradigm (i.e., weekly, daily, or even hourly forecasting) to support tourism stakeholders in implementing flexible and actionable measures to cope with high uncertainty (Bi et al., 2023; Li et al., 2023; Yang et al., 2022). Future research should investigate high-frequency leading indicators related to DFI (e.g., online sales of tourism tickets or insurance).
Nevertheless, this study has several limitations. First, due to the ongoing COVID-19 pandemic, data is only available until 2019. While we acknowledge the unprecedented role of DFI in boosting domestic tourism demand during the COVID-19 pandemic, quantifying the implications is outside the scope of this study. Second, the data used in this study is limited to China. Future research can investigate the impact of DFI on domestic tourism demand in other popular domestic tourism destinations, such as the United States, India, Spain, and Australia. In addition, in a destination where both international and domestic tourists have access to the same digital financial services (e.g., Eurozone), it is interesting to compare the difference in the impact of DFI on international and domestic tourism demand. Finally, the local spatial models, such as the geographically weighted regression model and its variants, can further reveal the spatial heterogeneity of the effect of DFI on domestic tourism demand. We leave the discussion of these questions for future research.
Footnotes
Acknowledgements
We would like to thank the editor and two anonymous referees for their valuable feedback and suggestions.
Declaration of conflicting interests
The author(s) declared no potential conflicts of interest with respect to the research, authorship, and/or publication of this article.
Funding
The author(s) disclosed receipt of the following financial support for the research, authorship, and/or publication of this article: This research work was supported by the Construction and Demonstration of Shaanxi Science and Technology Holding Group Financial Service Platform (2019ZDLGY11-03), the Science and Technology Project of China Huaneng Group (HNKJ20-H87), the China Scholarship Council (202206280179), the Natural Science Basic Research Program of Shaanxi (2023-JC-QN-0785), Singapore Ministry of Education Academic Research Fund Tier 1 (RG143/19), and the Society of Actuaries Education Institution Grant.