



Abstract
Objective
To determine the relationship between cost and quality in European hospitals.
Methods
Juran’s cost–quality curve served as a theoretical framework, linked to basic efficiency concepts. Based on systematic database searches, citation searches and cross-referencing, we identify 1093 empirical studies. After exclusion of studies from outside Europe (699), non-hospital settings (10 studies), lack of a cost parameter (194) or a quality parameter (27 studies), 22 studies (28 analyses) were assessed for direction of association and methodological heterogeneity.
Results
There was evidence of positive, negative, two-directional and no association between cost and quality. We examined whether diagnosis, procedure, type of quality measure and specification of the econometric model could explain the inconsistent evidence, but no clear explanation is identified. Despite the significant policy relevance, evidence on the relationship between costs and quality is limited. The literature is characterized by substantial methodological heterogeneity and lack of explicit definitions of the chosen cost and quality parameters, the econometric model and the underlying hypothesis for the cost–quality relationship.
Conclusion
It has been more than 60 years since Juran introduced the idea of failure costs, which implied that the marginal costs of quality could be non-constant. It seems imperative to acknowledge this idea in future studies.
Introduction
The political focus on quality in European hospitals has increased in recent years. 1 At the same time, pressure on public budgets has remained a challenge due to new technology, aging populations and the increased service expectations of users. Knowledge about the cost–quality relationship and, in particular, about the determinants of cost-effective or cost-saving quality interventions is an obvious and powerful basis for guiding priorities.
Empirical studies of the cost–quality relationship have received little interest probably due to the lack of individual-level cost data. However, with the introduction of Diagnosis-Related Grouping (DRG) systems across Europe, most countries have established reference cost databases for the calculation of DRG tariffs, which can be used to study the cost–quality relationship.
In North America, the cost–quality relationship has been investigated for more than three decades. The literature published since 1990 was recently reviewed by Hussey and colleagues who identified 61 empirical studies. 2 Their conclusion was that the evidence was inconclusive and that the methods used to study this relationship are inconsistent with regard to the unit of analysis, the cost measure, the quality measure and the statistical methods used to handle confounders. Extrapolation to Europe is complicated by contextual differences as most European health care systems are national and publicly funded, which, ceteris paribus, reduces the incentive for cost and quality competition. 3
There could be good theoretical reasons for the inconsistent results of empirical studies. Several authors have proposed a U-shaped relationship, in which the marginal costs of quality are not constant.4–6 Poor quality can be costly, when there are complications that could have been prevented and use of ineffective therapies. Good quality can also be costly when a provider invests in more effective technology or provides higher service levels. Given that the cost–quality function is U-shaped, the position of a hospital on the curve could influence the findings.
Theoretical framework
Price and quality competition is limited in Europe where patient choice is restricted due to the dominance of public financing models. Optimal cost and quality levels are thus not determined by the market but can be regarded as the choices of policy makers, subject to the values and goals of the health care system.
‘… the definition of quality may be almost anything anyone wishes it to be, although it is, ordinarily, a reflection of values and goals current in the medical care system and in the larger society of which it is a part’. 7 The World Health Organization has suggested six dimensions: effectiveness, efficiency, access, patient preference, equity and safety. 8 Further, it has been suggested that ‘A quality health service is one which organizes resources in the most effective way to meet the health needs of those most in need, for prevention and care, safely, without waste and within higher level requirements’. 9 Narrower views have often been adopted.10,11
In the past, cost and quality were assumed to be linearly and positively related. Juran was one of the first authors to recognize the cost of poor quality as a subject for quality management.
12
He suggested quality cost consists of failure costs, which result due to poor quality of the product, and appraisal and prevention costs, which are necessary to improve quality such that failure costs can be reduced or even eliminated.
13
The total cost of quality is thus the sum of these costs, which forms a U-shaped function (Figure 1).
The cost of quality.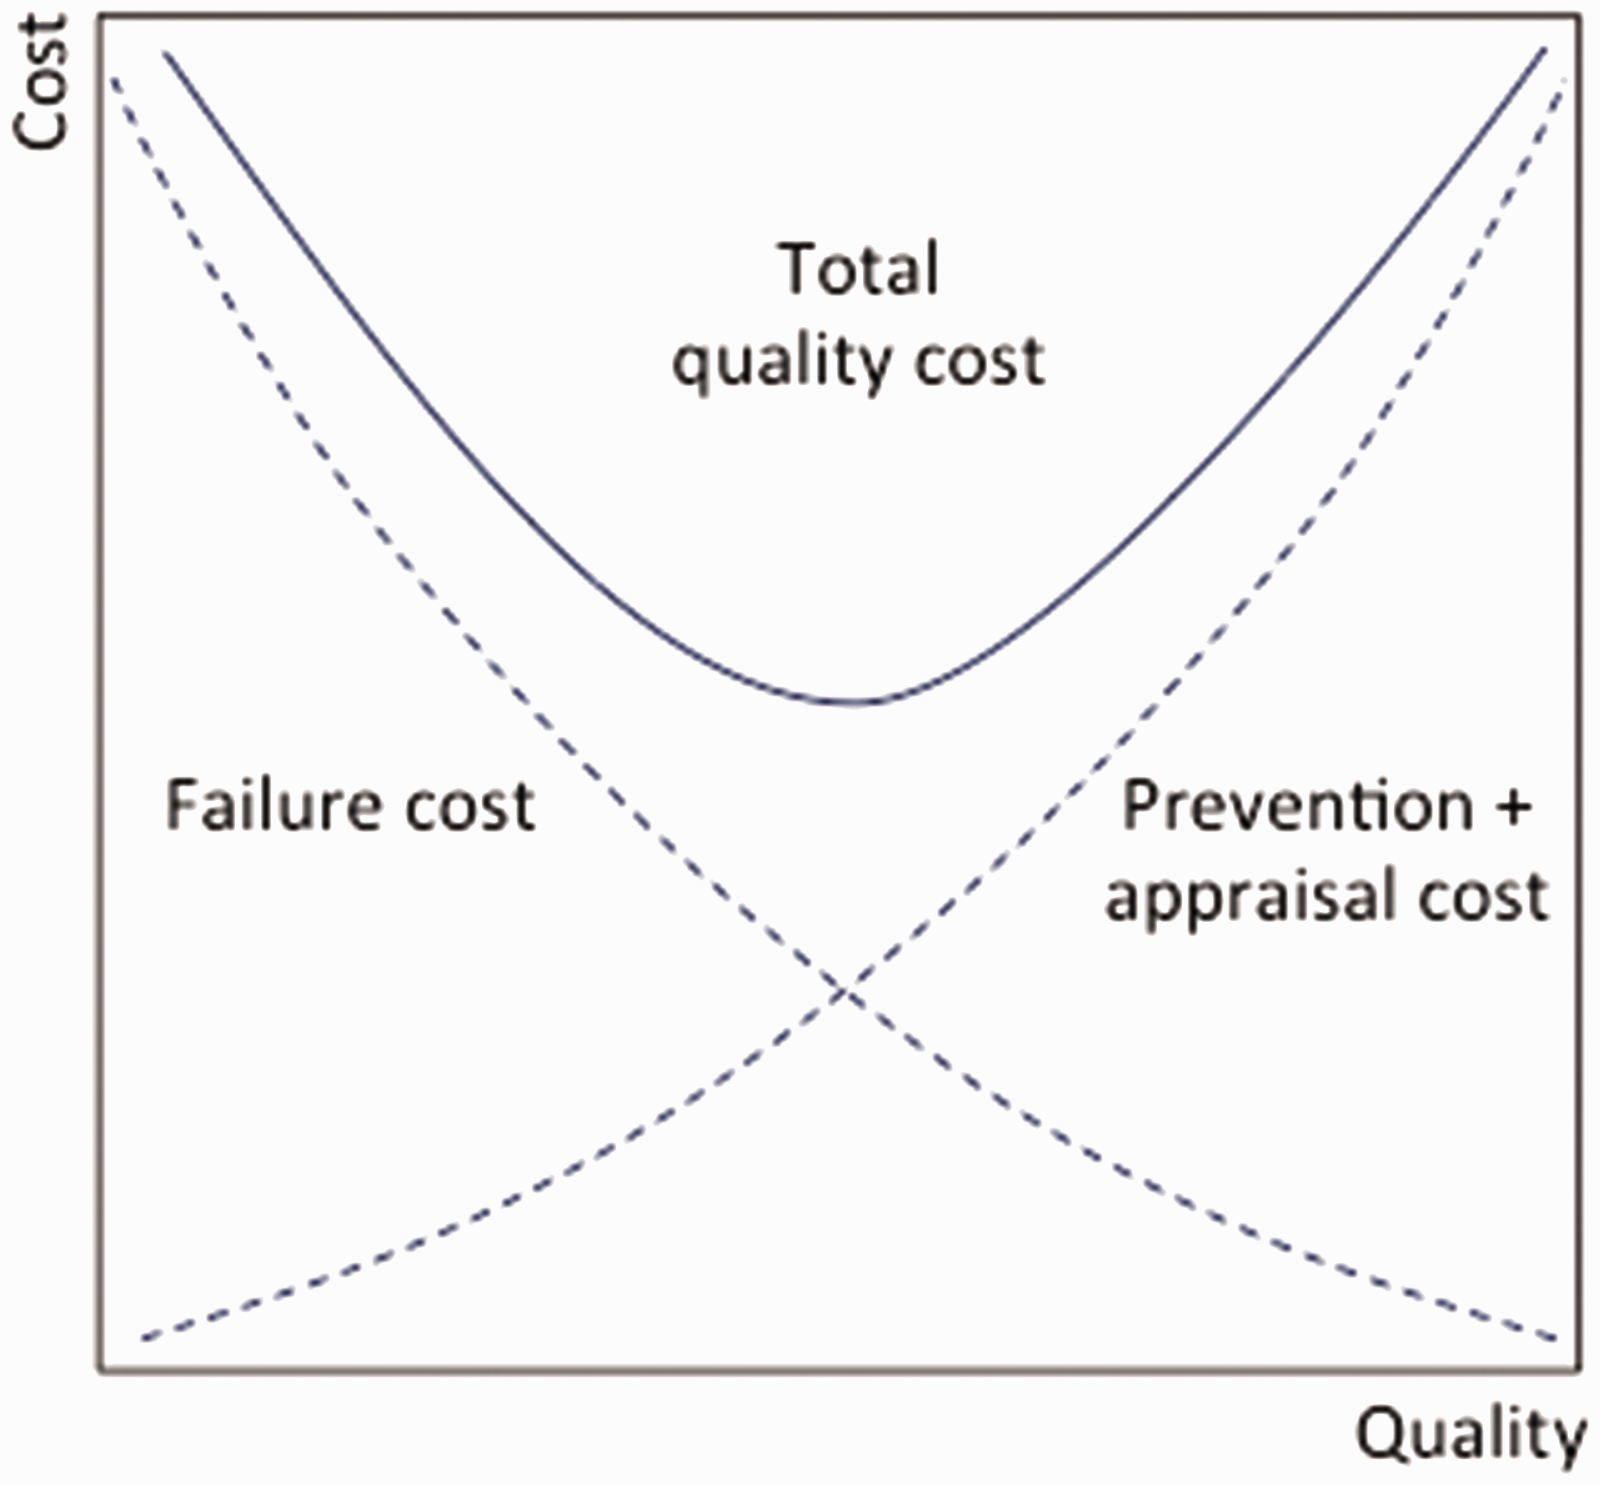
The lowest cost of quality is reached when any increase in appraisal and prevention costs is exactly outweighed by a decrease in failure cost. Operation on the downward sloping part of the curve is thus inefficient because higher quality could be achieved within the same budget if failures are identified and prevented. 14 Operation on the upward sloping part of the curve is also inefficient but can be the result of an informed choice based on minimum quality level goals.
Alternative technologies, organization of processes, physical structures, education, and other factors might shift the total quality cost curve. For a fixed budget, efficient quality production is defined by a production curve with its minimum tangent to the budget threshold (Figure 2).
Total quality cost and technical efficiency.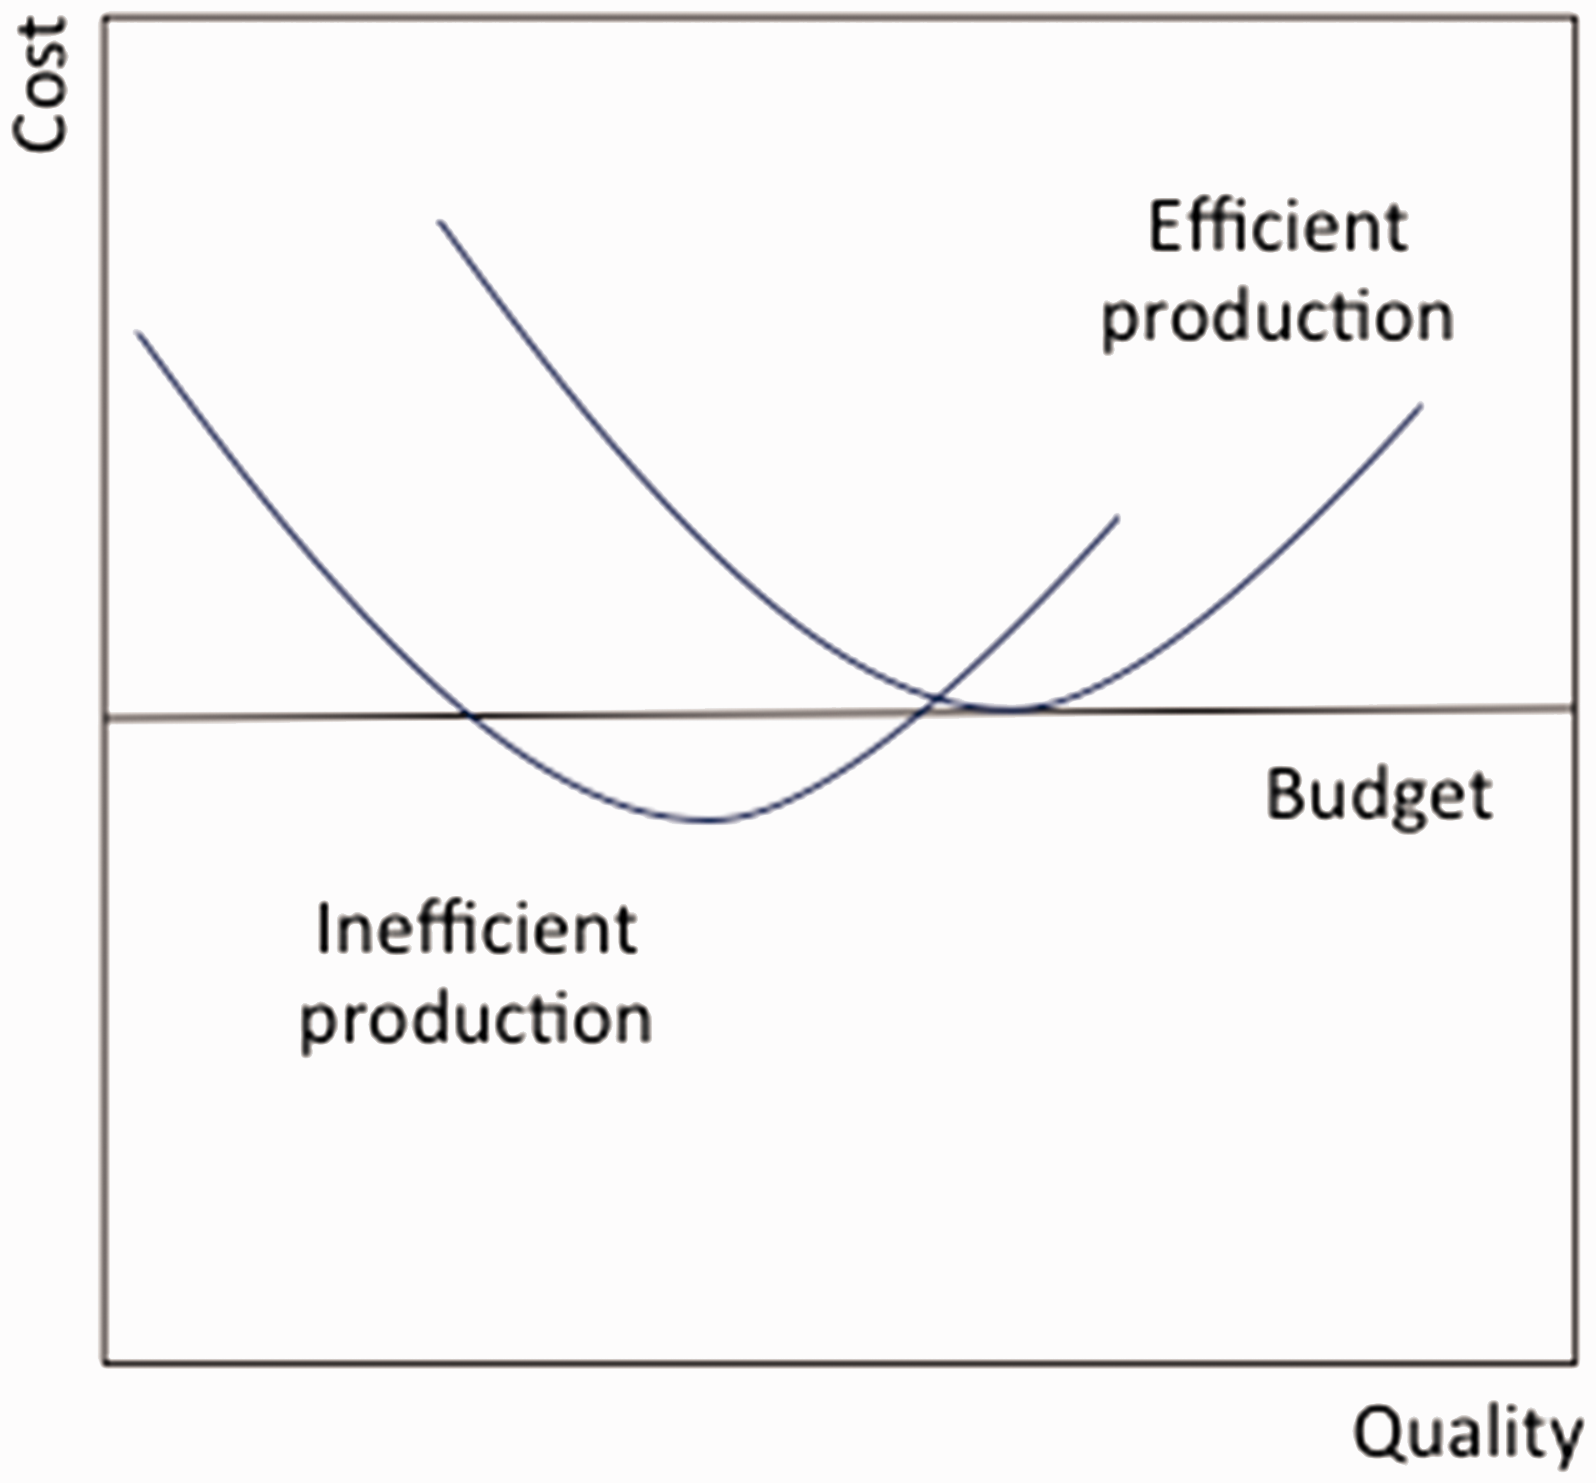
Given that production is technically efficient, the optimal level of quality would be a matter of allocative efficiency and thus the point at which the marginal social cost of quality is equal to the marginal social benefit of quality – at least from a neoclassical economic theory perspective. Quality effort, however, is not directly contractible and social policy makers instead use payment systems, such as incentives in accordance with standard agency theory. 15 However, quality is only one goal of hospital governance 16 and, in some cases, has been found to conflict with other criteria. For example, activity-based funding based on the DRG system has been shown to have detrimental effects on quality, which can be explained by the underlying incentive scheme favouring activity over quality. 17 Similarly, it has been shown that the suggested productivity gain of the DRG system does not consider internal failure costs due to the measurement focus on (desirable) production output. 18 Attempts to contract quality more directly such as paying for performance models have shown a short-term benefit, whereas long-term results have not been convincing.19,20 The objective of this study was to examine the relationship between hospital costs and quality in Europe and to determine the potential explanations for eventual divergence.
Methods
Identification of papers
We conducted a systematic literature review in line with the PRISMA statement 21 up until 7 July 2015. All English-language articles and working papers simultaneously assessing the costs and quality of hospital services in Europe were included without restrictions on epidemiological design. Economic evaluations of specific technologies were excluded.
Literature searches were conducted in PubMed, EconLit, EMBASE and Web of Science using the following criteria: (1) the title or abstract should include the word ‘cost’ or ‘costs’ and not the words ‘cost-effectiveness’, ‘cost effectiveness’, ‘cost-utility’, ‘cost utility’, ‘cost-benefit’, ‘cost benefit’ or ‘economic evaluation’; (2) the title or abstract should include the word ‘quality’; (3) the title or abstract should include the word ‘hospital’ and (4) the full-length text should include the words ‘regression’, ‘multivariate model’ or ‘instrumental variable’.
The results of the four searches were exported to EndNote X7 reference software (Thomson Reuters, Philadelphia, PA, USA) and duplicates were removed. Two assessors independently screened the eligibility of studies and the resulting lists were compared and consensus was reached through discussion. A citation search in Web of Science was conducted for all of the included studies, which was again based on independent procedures between the assessors to base the final selection on consensus.
The search strategy was supplemented by a search for working papers in the RePEc (Research Papers in Economics) database, which was accessed via EconPapers using the search terms cost*, quality and hospital. Finally, the reference lists of all of the included studies were checked for additional relevant studies.
Data collection and assessment
Two independent assessors extracted information from the included articles and the results were based on consensus after discussion. The first round collected information about setting, year, cost and quality parameters, statistical models and main findings. The second round explored similarities between studies with findings of a positive or negative association between cost and quality.
Results
Study selection
Figure 3 illustrates the flow of studies. A large number of papers were ineligible due to being conducted in a non-European or non-hospital setting, and/or not including a cost or a quality parameter. Finally, 22 studies and 28 analyses were included.4,5,22–41
Flow of information.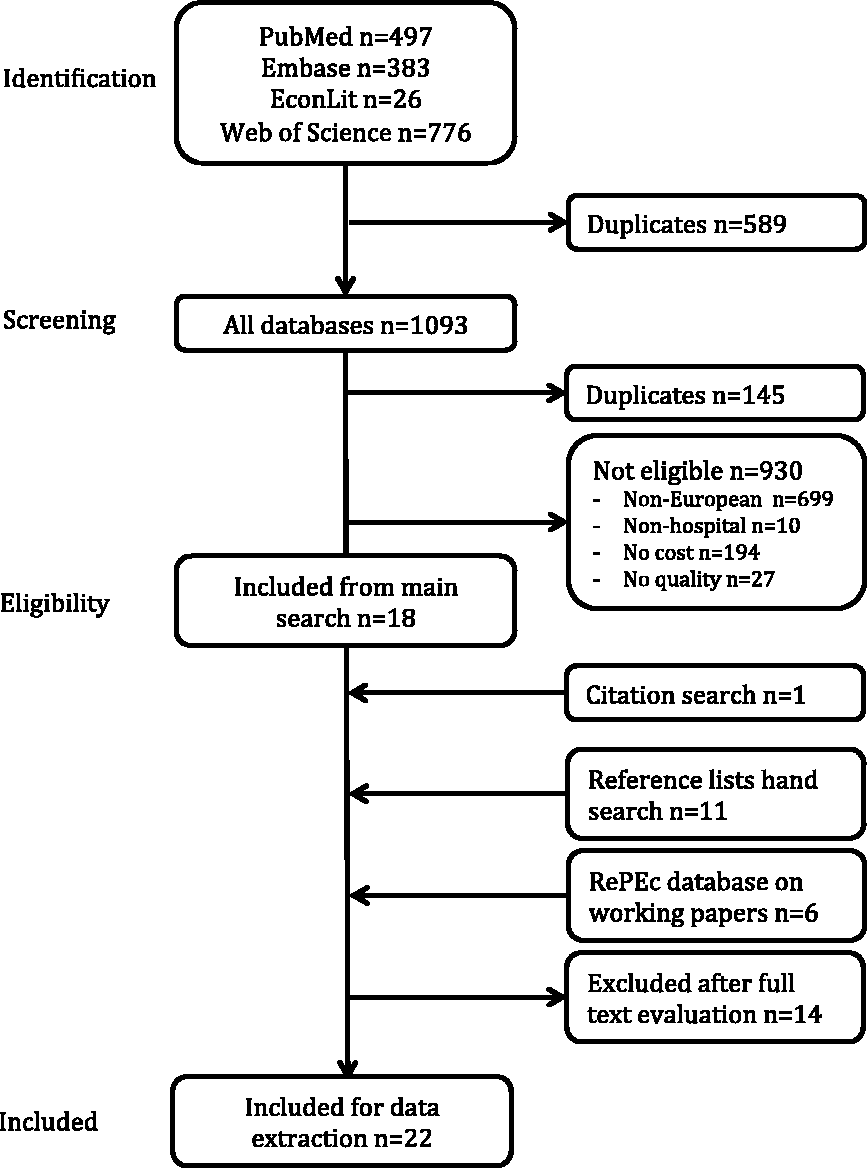
Characteristics of studies
The studies were conducted for high-volume treatments in cardiovascular, gastroenterological and orthopaedic surgery, as well as pharmaceutical treatment for stroke (online Appendix 1). Almost all of the original 15 countries of the European Union were represented. Eight studies were conducted as part of the EuroDRG project for the purpose of assessing the extent to which DRG tariffs explain cost variation. These studies were conducted for different populations in seven countries and were based on a common method. 42 The remaining studies reflected substantial heterogeneity, particularly in terms of choice of quality indicator and specification of the statistical model.
The quality indicators included process indicators and outcomes (errors, mortality, patient-reported quality of life). The statistical models ranged from conventional ordinary least squares regression to multilevel models in which random cost variation at the patient level can be distinguished from systematic variation at the provider level.
With one exception, all of the studies included some form of adjustment for case-mix (severity of disease, comorbidities). Similarly, most studies included some form of adjustment for hospital characteristics but they were often restricted to a single hospital dummy or a few variables, such as teaching status, number of beds or volume of procedures. The endogeneity problem – that quality is to some extent determined by case-mix or that cost is to some extent determined by the general cost level – was addressed using instrumental variables or two-stage models in some studies, while it was ignored in others.
Main findings and heterogeneity
Categorization of cost–quality analyses according to type of service and the direction of main findings.
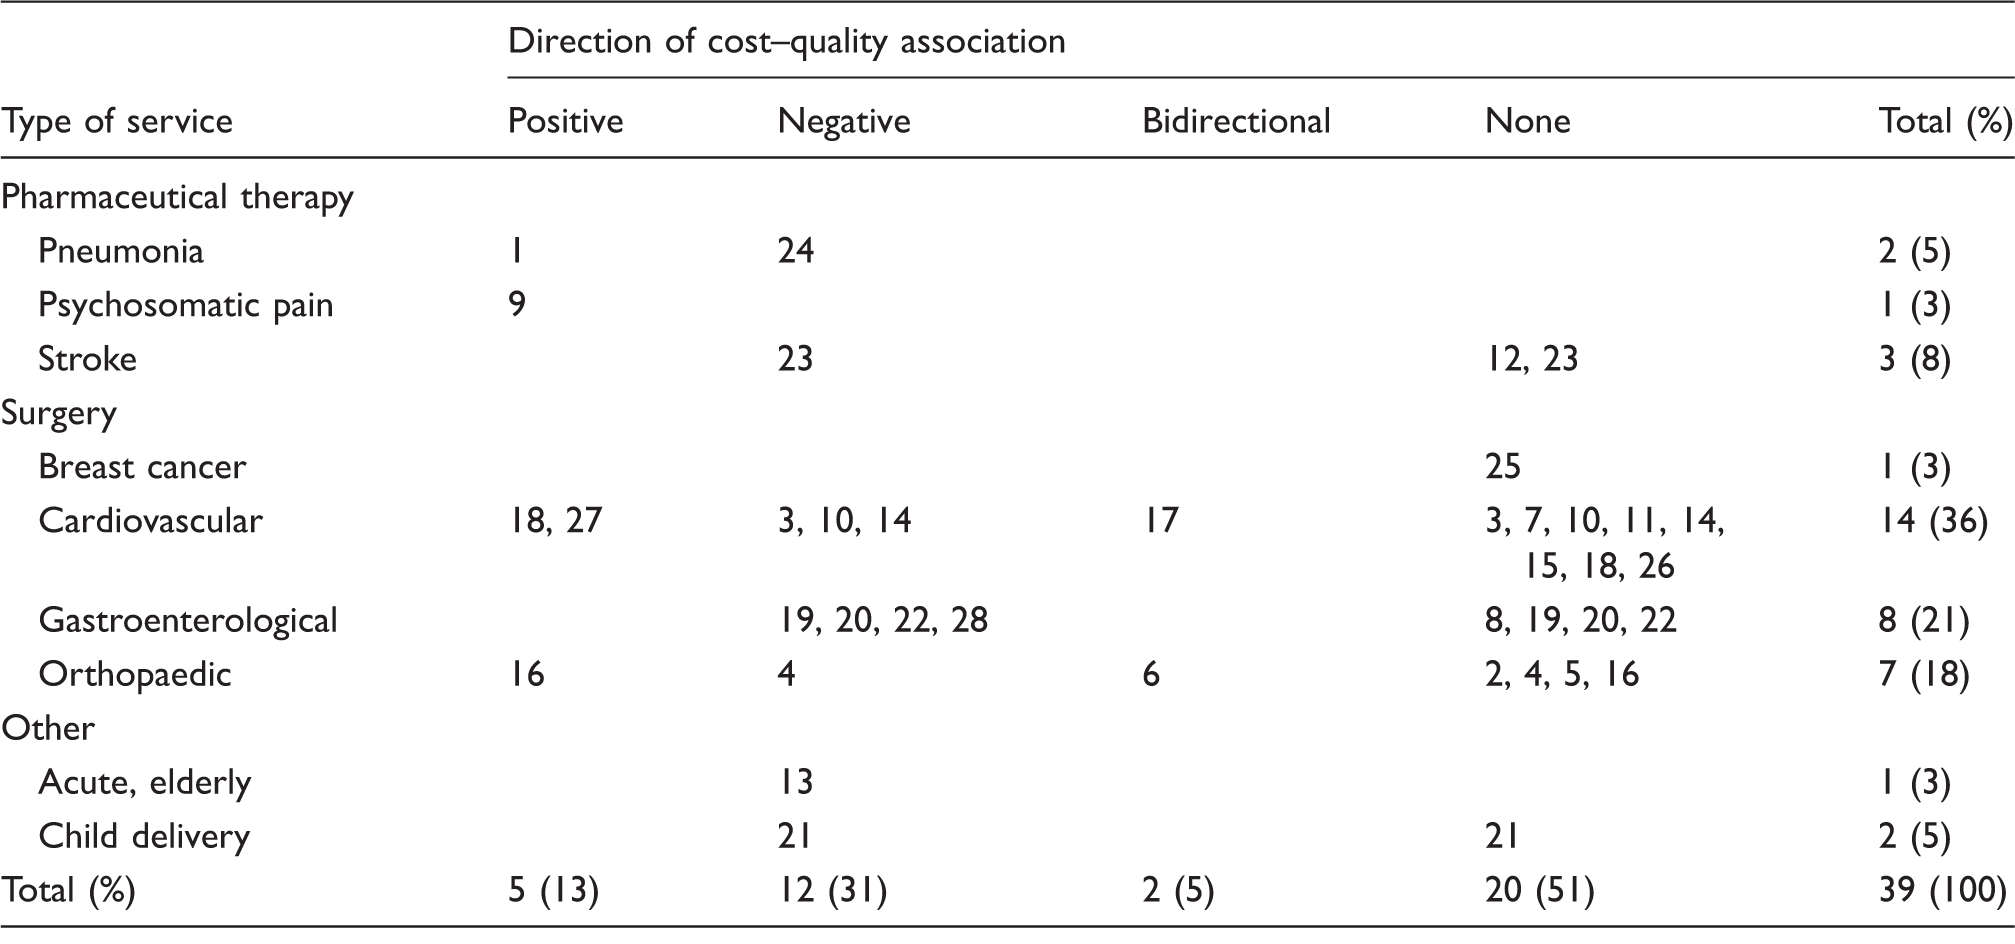
Note: The numbers refer to analysis ID, which is defined in Appendix 1. Some analysis IDs appear more than once due to reporting results that point in different directions for different quality indicators.
Categorization of cost–quality analyses according to the choice of quality indicator and the direction of main findings.
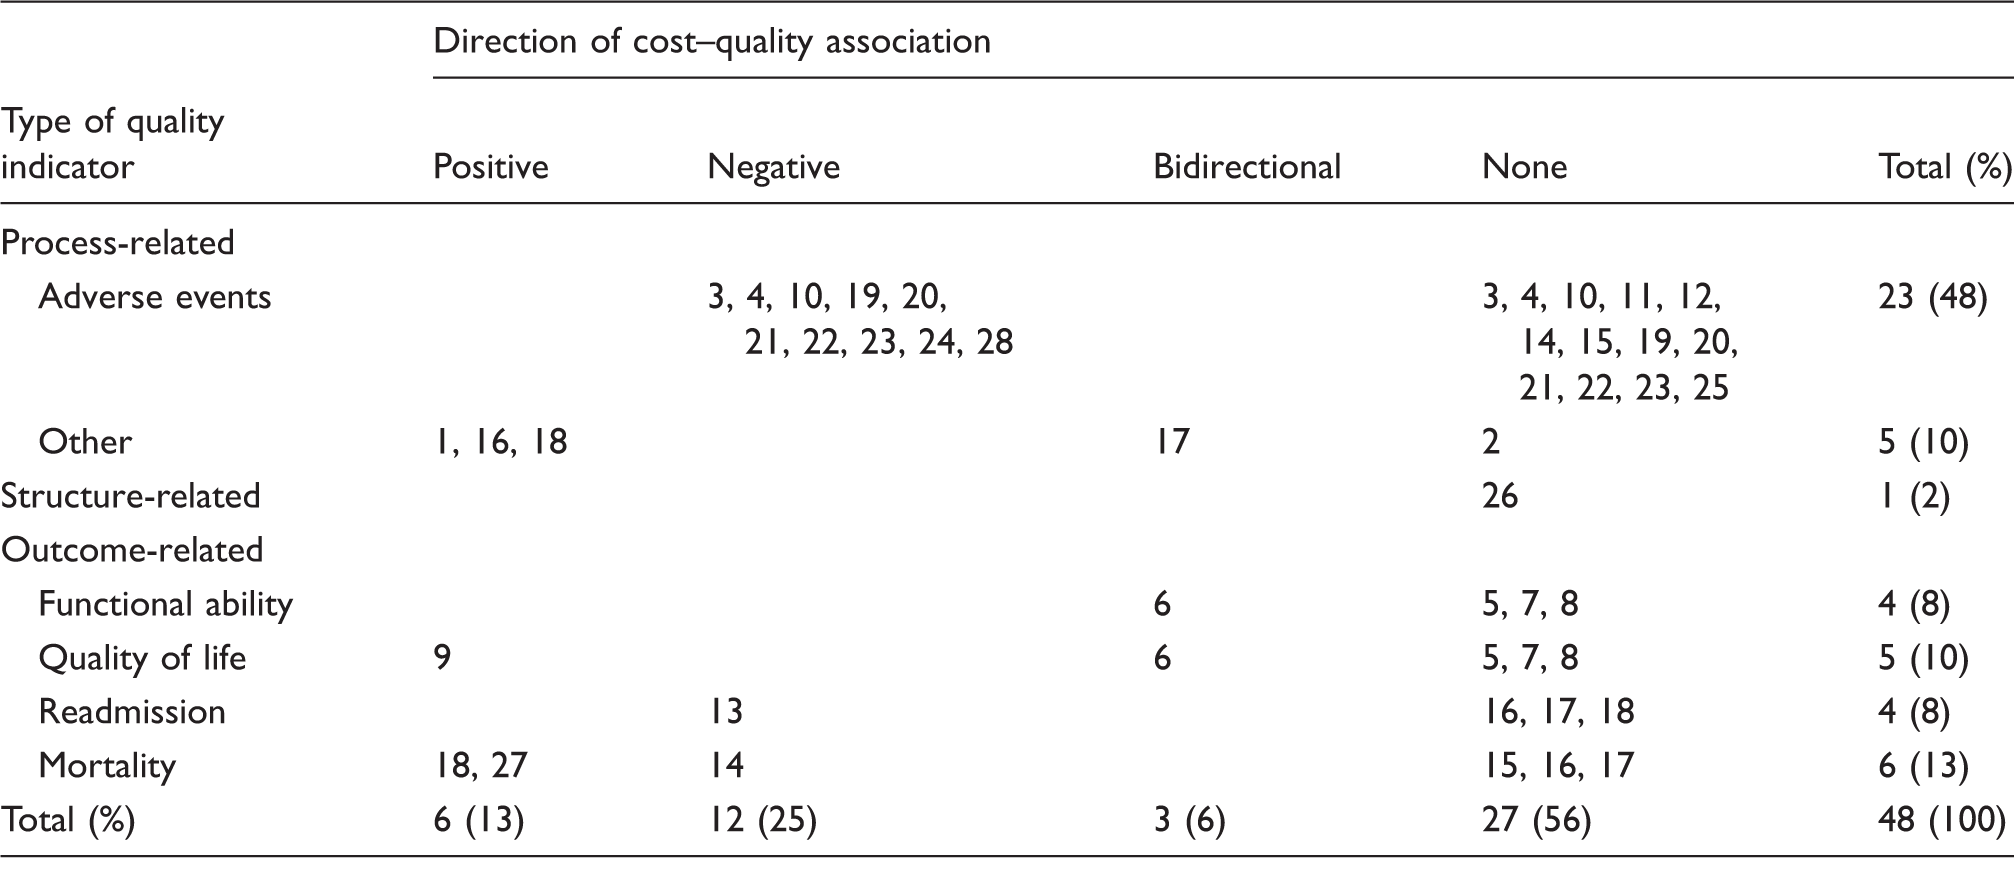
Note: The numbers refer to analysis ID, which is defined in Appendix 1. Some analysis IDs appear more than once due to reporting results for more than one type of quality indicator or due to results pointing in different directions within a group of quality indicators of the same type.
Categorization of cost–quality analyses according to the econometric model specification and the direction of main findings.
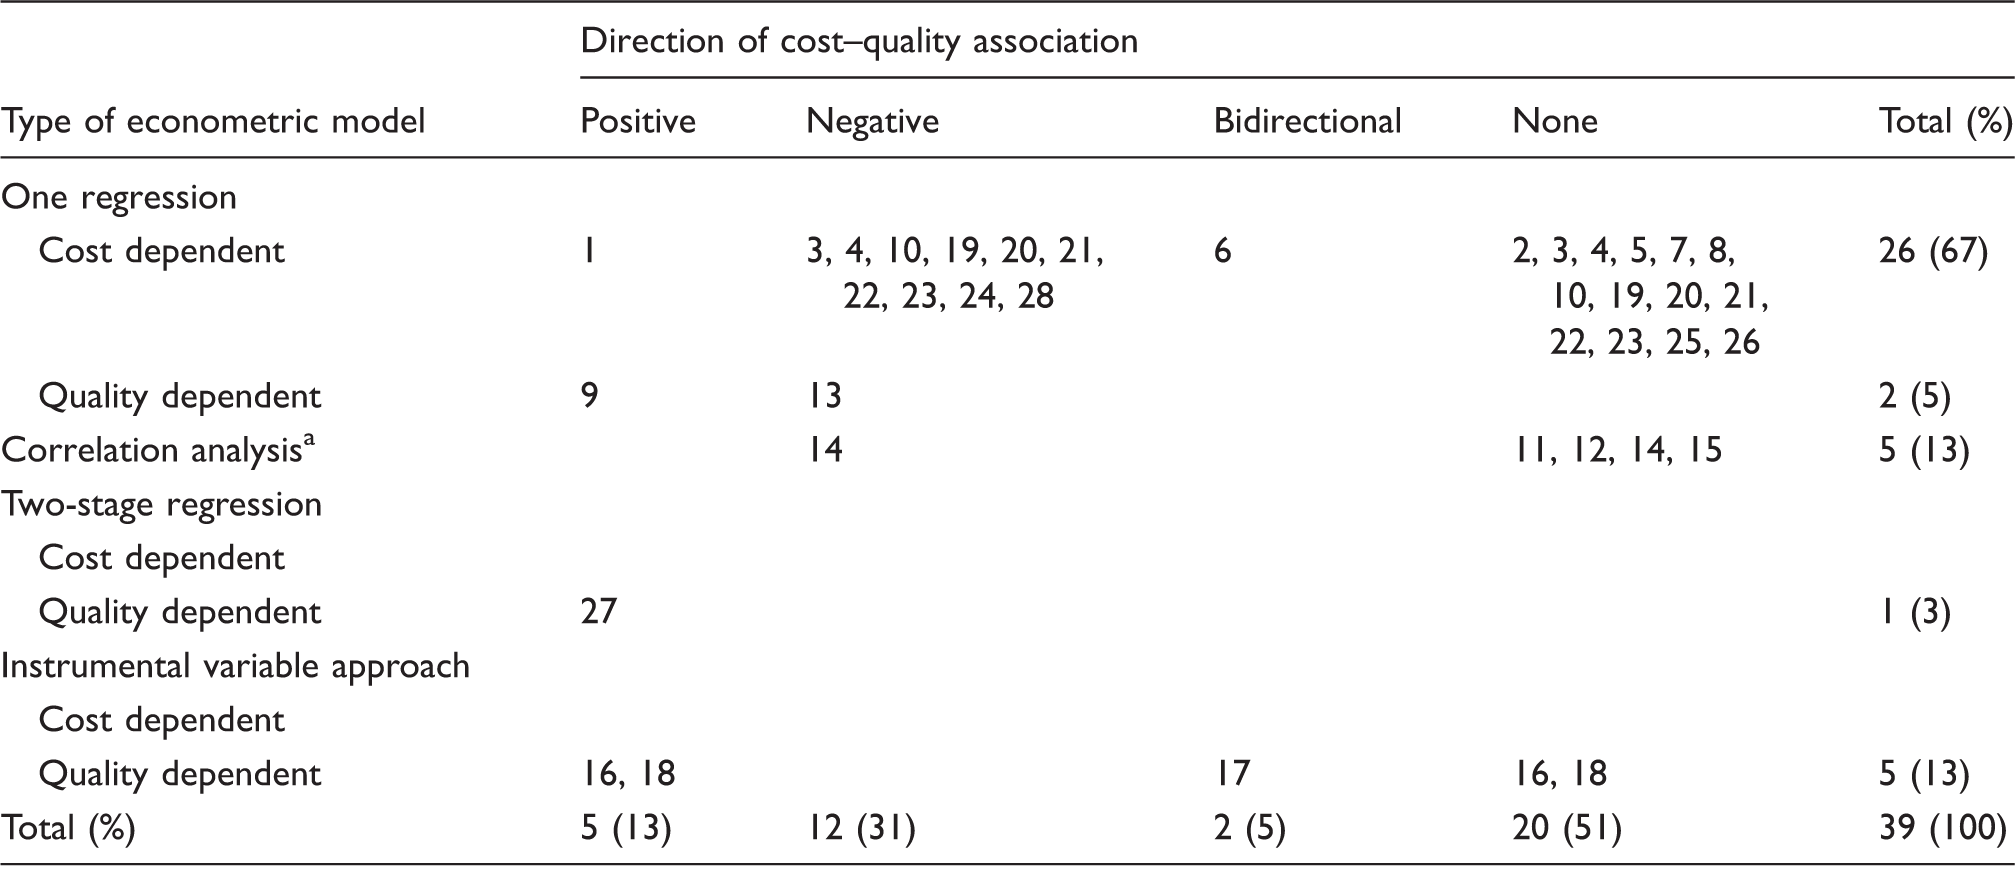
Note: The numbers refer to analysis ID, which is defined in Appendix 1. Some analysis IDs appear more than once due to reporting results for more than one quality indicator.
Department-level scatter plot based on separate regressions for cost and quality.
Only one study had accommodated a U-shaped association in the econometric model specification. 4 The investigators included a quadratic form of patient-reported outcome and showed that better outcomes were associated with cost reduction for hip replacement patients with modest treatment responses (−£64 per 1-unit outcome score at the 25th percentile), whereas outcomes were associated with higher costs for patients with average treatment responses (£90 per 1-unit outcome score at the mean). The authors found no such relationship in knee replacement, groin hernia repair and varicose vein surgery. In another study, a sensitivity analysis that included a squared cost parameter was performed and found the model fit to improve significantly. 5
Discussion
Main findings
The literature on the cost–quality relationship in European hospitals is limited and points in all directions in terms of the cost of quality. This is not surprising due to methodological and contextual heterogeneity. This review identifies aspects that need attention in empirical research. We attempted to explain the role of selected dimensions but found no clear answers except for complexity and methodological sophistication not necessarily being balanced, in particular, with respect to conceptualization of quality, costing of important overhead resource use, and specification of an econometric model that allows for non-linear marginal costs of quality.
Focal points for future studies
Donabedian defined quality as being a reflection of social values 7 although it is often referred to in the reduced form of the trichotomy of structure–process–outcome. What is clear today is that these dimensions do not necessarily capture the same underlying construct or even what we perceive as quality as a reflection of social values.43,44 A more nuanced definition of quality could also consider the perspective of analysis (whose value is captured – patient, staff or organization) and what aspect of quality is actually captured (medical/technical, interpersonal or organizational). The cost of quality as an exhaustive construct is a naïve formulation where a more precise terminology would be the cost of a certain aspect of a certain dimension of quality from a certain perspective. This is in line with the position of recent commentators that micro- and macro-system approaches should be seen as potentially divergent 45 and illustrate the importance of bearing the purpose of investigation in mind when specifying the quality parameter – whether that be to inform departmental efficiency or system investment in quality.
The majority of studies based their cost parameters on the reference costs used for the calculation of national DRG tariffs, but it was generally not mentioned whether these studies included all patients or only those who were selected as typical cases on which to base the DRG tariff calculations. In the latter case, the patient-level variation was underestimated, and explanatory power could have been lost. Similarly, it was generally not reported whether the reference costs included capital and other overhead costs. These costs could be important for quality in cases in which they reflect modern logistics, new technology or a general improvement in service management. It should also be noted that the ‘hidden’ cost of maintaining a quality improvement readiness and capacity in an organization is likely to be both substantial and directly linked to quality performance. Consequently, conceptualization of costs is equally critical to the findings as the conceptualization of quality and, although it might seem simpler at first sight, it is not a trivial task to quantify all relevant costs. Careful consideration is warranted in order to judge the validity of cost measures even in the presence of detailed reference cost databases.
The econometric specification of the cost function should clearly allow for a non-linear relationship and depending on the purpose of analysis also tackle hierachical levels of covariation that will otherwise introduce confounding. Different models in the literature excel on different aspects (e.g. the studies of the EuroDRG project are based on well-designed cost models 42 but do not allow for non-linear relationship with quality). This is demonstrated by Gutacker et al. 4 A couple of studies have used correlation analysis and scatter plots to examine the cost–quality relationship.28,30,31 In the future, mapping of the cost–quality relationship to area/center/hospital/health care system/policy characteristics could aid identification of cost-effective strategies for quality improvement.
Health care in Europe is highly regulated. Applying the theoretical proposition that quality investments are worthwhile as long as the marginal benefit of higher quality exceeds the marginal cost under different regulatory environments will result in different optimal levels of quality. This calls for attention to the nature of the regulatory environments when attempting to assess the cost–quality relationship, yet such environmental factors are rarely included in the empirical models.
Finally, even if social values, populations and health care systems were the same, there is little reason to expect equal return on quality investments across providers and even less reason to expect that there is a one-size-fits-all quality improvement strategy. This should be considered when interpreting cost–quality results. Rather than guiding acceptance or rejection of an explicit quality improvement strategy, results would perhaps be best used as a driver for dialogue about the design of ad hoc strategies.
Limitations
The main limitation was the ad hoc search strategy due to studies generally not using relevant MeSH terms. Also, no quantitative synthesis of the results or additional analysis seemed appropriate.
A great proportion of the included studies were originally conducted for a different purpose than assessing the cost–quality relationship, which might indicate that the quantification of the cost or the quality parameter or the choice of analytical strategy was not as robust as it would have been if the primary purpose of the analysis had been to examine the cost–quality relationship.
Conclusion
The methodological diversity of the literature might be justified by different policy goals having a particular type of quality. However, it might also be a reflection of data availability. Regardless of the reason, surprisingly few of the studies reported considerations of the appropriateness of the chosen cost and quality parameters, the econometric model or the underlying hypotheses for the cost–quality relationship. A stronger focus on these issues would endow the literature with greater transparency and credibility. In particular, it is surprising that very few studies allowed for a non-linear relationship in the econometric model even though it is more than 60 years since Juran introduced the ideas of failure, appraisal and prevention costs, which hypothesize that the marginal costs of quality could be non-constant. 12 This inclusion seems imperative in the future.
Footnotes
Acknowledgement
The authors would like to thank librarian Bente Østergaard for assistance on literature search.
Declaration of conflicting interests
The author(s) declared no potential conflicts of interest with respect to the research, authorship, and/or publication of this article.
Funding
The author(s) received no financial support for the research, authorship, and/or publication of this article.