




Abstract
Objectives
To evaluate the effect of Care Quality Commission external inspections of acute trusts on adverse event rates in the English National Health Service.
Methods
Interrupted time-series analysis including all acute NHS trusts in England (n = 155) using two control groups (new versus historical inspection regime and trusts not inspected). Multilevel random-coefficient modelling of (1) rates of falls with harm and (2) pressure ulcers, from April 2012 to June 2016, was undertaken using the new, resource-intensive regime of Care Quality Commission inspections as an intervention. Data used in the model included dates and type of inspection, patient safety indicators, demographic characteristics and financial risk of hospitals.
Results
In one year, Care Quality Commission inspected 66 acute trusts (42% of all English trusts) using their new regime and 46 (30%) using their previous one. Prior to inspections being announced, rates of falls with harm and pressure ulcers were improving in both intervention and control hospitals. The announcement of an inspection did not affect either indicator. After inspections, rates of falls with harm improved more slowly, and pressure ulcer rates no longer improved for trusts inspected using both regimes.
Conclusions
Neither form of external inspection was associated with positive, clinically significant effects on adverse event rates. Any improvement happening before the announced Care Quality Commission inspections slowed after the inspection.
Introduction
The English National Health Service (NHS), like all health systems, has unwarranted variations in quality and clinical outcomes, 1 and the Care Quality Commission (CQC) exists to regulate and improve quality. 2 CQC ratings are a form of inspection-based accreditation, which is a common approach to quality improvement, 3 although evidence on its effectiveness is inconsistent and of low quality. 4 CQC sets standards, monitors compliance, undertakes onsite inspections and has enforcement powers. 5 It can request compliance actions, modify conditions of registration, issue warning notices, recommend trusts are put under ‘special measures’ and even prosecute Trust Boards. 6
Economic theory suggests that in a market, organizations compete for ‘customers’. In the NHS, competition and provider numbers are often limited, so the main incentive to provide quality health care is reputational concern. 7 , 8 Any approach that relies on performance measures carries the risk that trusts will engage in gaming behaviours to gain perceived advantage. 8
Aside from gaming, trusts might ‘improve’ following an inspection through various mechanisms. 9 Preinspection, trusts can self-assess their level of compliance and obtain information from trusts previously inspected. Any remedial action undertaken can increase the awareness of safety and increase reporting of adverse events. During inspections, regulators may suggest improvements, and postvisit, alongside regulator-directed changes, organizations can make changes based on lessons learned. Stakeholders (for example, commissioners and patients’ groups) can influence organizations to improve, and the publication of inspection results may lead to further changes. These potential CQC improvement mechanisms have been explored qualitatively but the lack of a system-wide quantitative examination of CQC inspections means that their effects remain uncertain. 4
CQC’s perceived lack of sensitivity to detecting or avoiding unacceptable failures of care 10 led to modification of the inspection regime in 2013. 11 Historically, the CQC’s teams of two to five inspectors, visiting a trust over two to three days, focused on whether a trust met 28 essential standards, required improvement or required enforcement actions to meet the standards. 12 The new regime 13 outlines legally enforceable fundamental standards of care, uses ‘intelligent monitoring’ of over 150 indicators, uses more inspectors for longer, rates core services and the whole trust, allows for unannounced visits postinspection and permits joint inspection (with the financial regulator, NHS Improvement). The new regime uses more resources, but the effect on processes and outcomes has been not quantitatively evaluated. 14
We sought to explore the effect of external inspections of acute trusts by the CQC on rates of adverse events in the English NHS.
Methods
Study design and setting
We undertook a controlled interrupted time-series analysis using data on adverse events prospectively and routinely reported by all English acute NHS trusts (n = 155) from April 2012 to June 2016. Five trusts had missing data and were excluded. The interruption point was a CQC inspection between September 2013 and September 2014. In that period, a new inspection regime was introduced and applied to 66 acute NHS Trusts. Since CQC performs comprehensive inspections (at least) once every three years, 5 some trusts were inspected under the old regime (n = 46), whilst others were not inspected (n = 38), which permitted us to use two nonequivalent controls. The announcement of the inspection occurring, 16–20 weeks before a visit, was treated as a further intervention point.
Outcome measures
We focused on two adverse events which are proxies for quality of nursing care. 15 Falls with harm are unplanned or unintentional descent to the floor requiring at least first aid, minor treatment or extra observation or medication. 16 Pressure ulcers are those that developed 72 h or more after patient admission and are categorized using the European Pressure Ulcer Scale. 16 Data on these outcomes are collected monthly in a single-day census by trained staff using the NHS Safety Thermometer (NHS ST), 17 a national quality improvement initiative that rewards trusts for collecting high(er) quality safety data. 18 Falls with harm and pressure ulcers are indicators of quality used in CQC documentation and inspections, but are not used in CQC ‘intelligent monitoring’ algorithms to target inspections. 5
Statistical analysis
We used a multilevel random-coefficients linear model for estimating changes in the level and trend in rates of falls with harm and pressure ulcers after each interruption.
The multilevel model estimates intervention effects for an average trust and for all individual trusts. To determine the preinspection change rate, time was used as an explanatory variable. A dummy variable, indicating a level change in adverse events rates, and an interaction term (i.e. group × time × postintervention time), indicating a change in slope, were included in the model. Time was centred on the inspection month. In the case of not-inspected hospitals, an interruption was introduced in November 2013 (i.e. the month with the highest number of inspections). Outcome variables were logarithmically transformed, and coefficients were exponentiated to express them in the original scale. The assumptions of uncorrelated model residuals and normally distributed random effects were met.
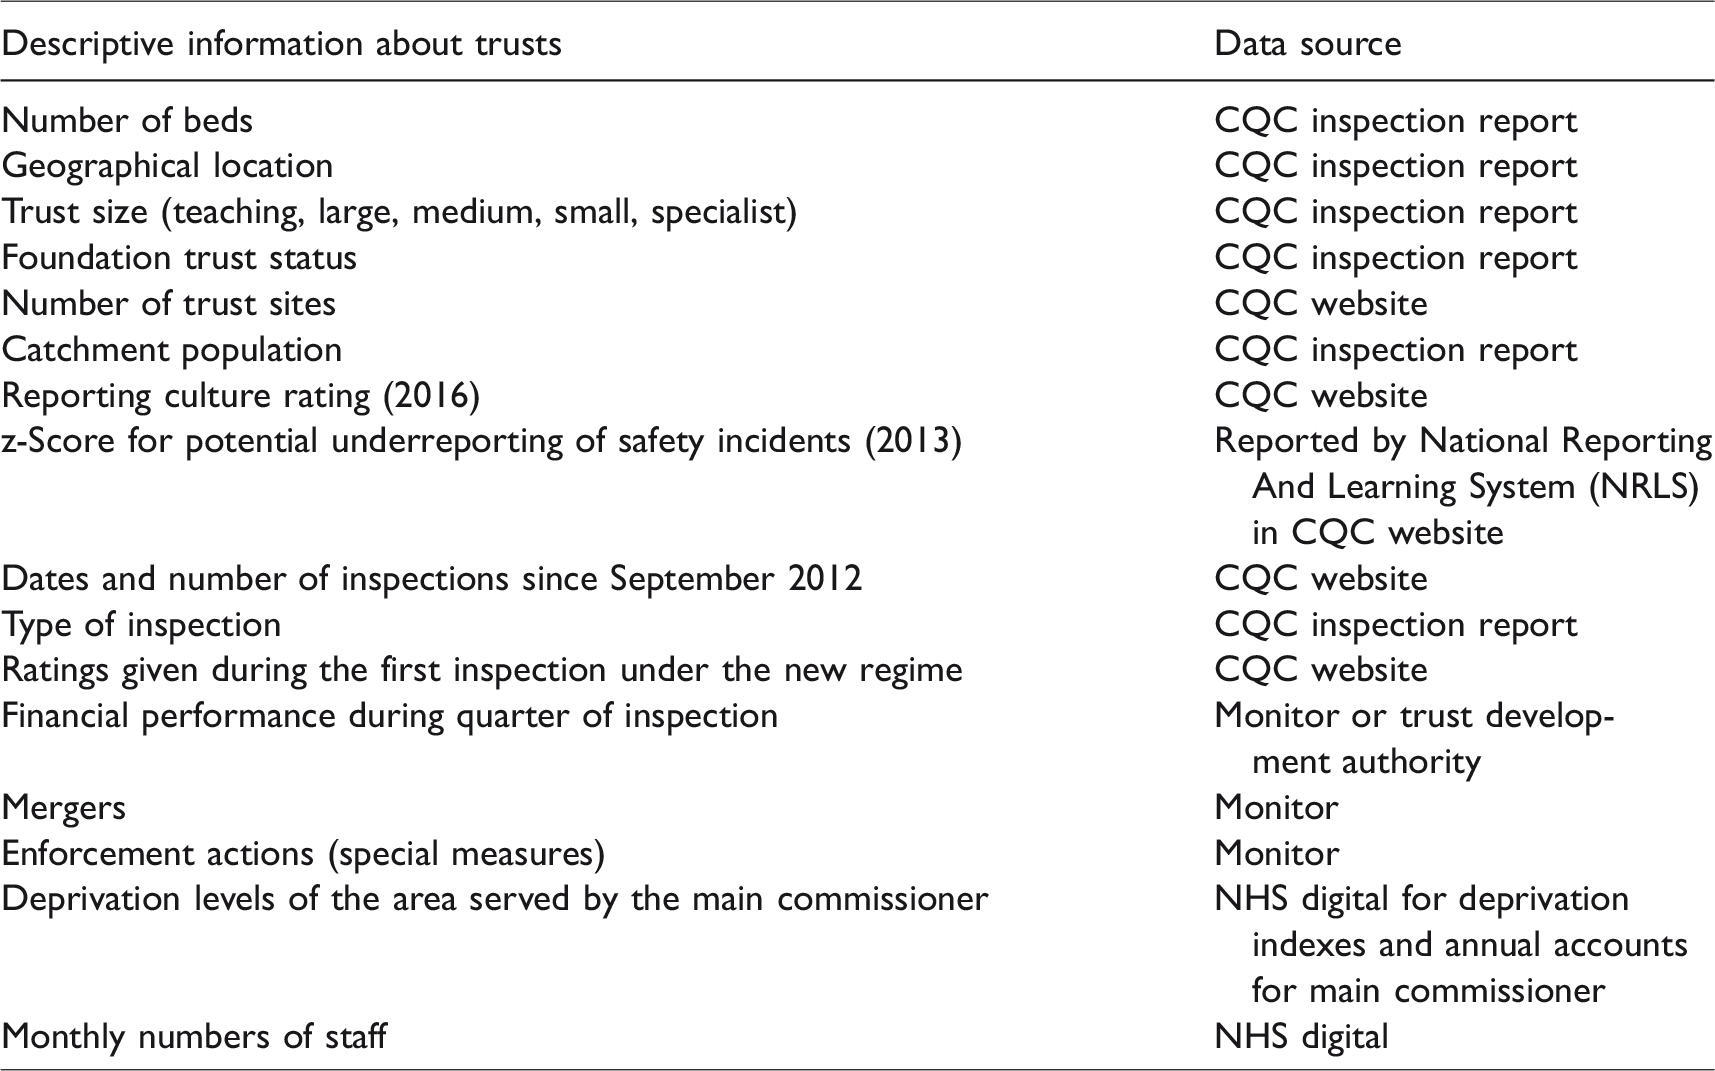
We included descriptive data for each acute NHS trust (see Table 1) to minimize confounding. Because of changes in the commissioning system, the period between October 2012 and April 2013 was introduced as a dummy variable. Confounding variables were included one by one in the adjusted model, and the most parsimonious model is reported based on the Lowest Bayesian Information Criterion.
Descriptive information used for each acute NHS trust and its sources.
To mitigate possible time-series error term correlation, we introduced autocorrelation structures from 1 to 12 and compared different models using a likelihood ratio test, reporting the most parsimonious model. A cosine function in the pressure ulcer model accounts for seasonal changes. 19 To test the robustness of findings, we estimated models for the whole sample and for a subsample matched on foundation trust status, reporting culture and special measures status (see Appendix 1, online only).
To assess the clinical/policy significance (as well as statistical significance), we used 95% confidence intervals for rate of change before and after announcements and inspections and change in levels the month after each interruption, with P-values <0.05 considered statistically significant. Analyses were performed in Stata SE/14.0 (StataCorp LP. 2015, College Station, Texas).
Results
Missing NHS ST data meant five trusts were excluded from the analysis. The 38 uninspected trusts had a median time to an inspection before or after the observation period of five (interquartile range 2–7) months. Trusts inspected under the new regime were less likely to be Foundation Trusts (53% vs. 71%, P = 0.02), more likely to be under special measures (28% vs. 1%, P < 0.001) and more likely to be rated as poor or with significant concerns about reporting culture (67% vs. 42%, P = 0.002) (Table 2). Figure 1 shows the distribution of inspections over the observation period. The mean rates of falls with harm and pressure ulcers in the observation period are shown in Figure 2.
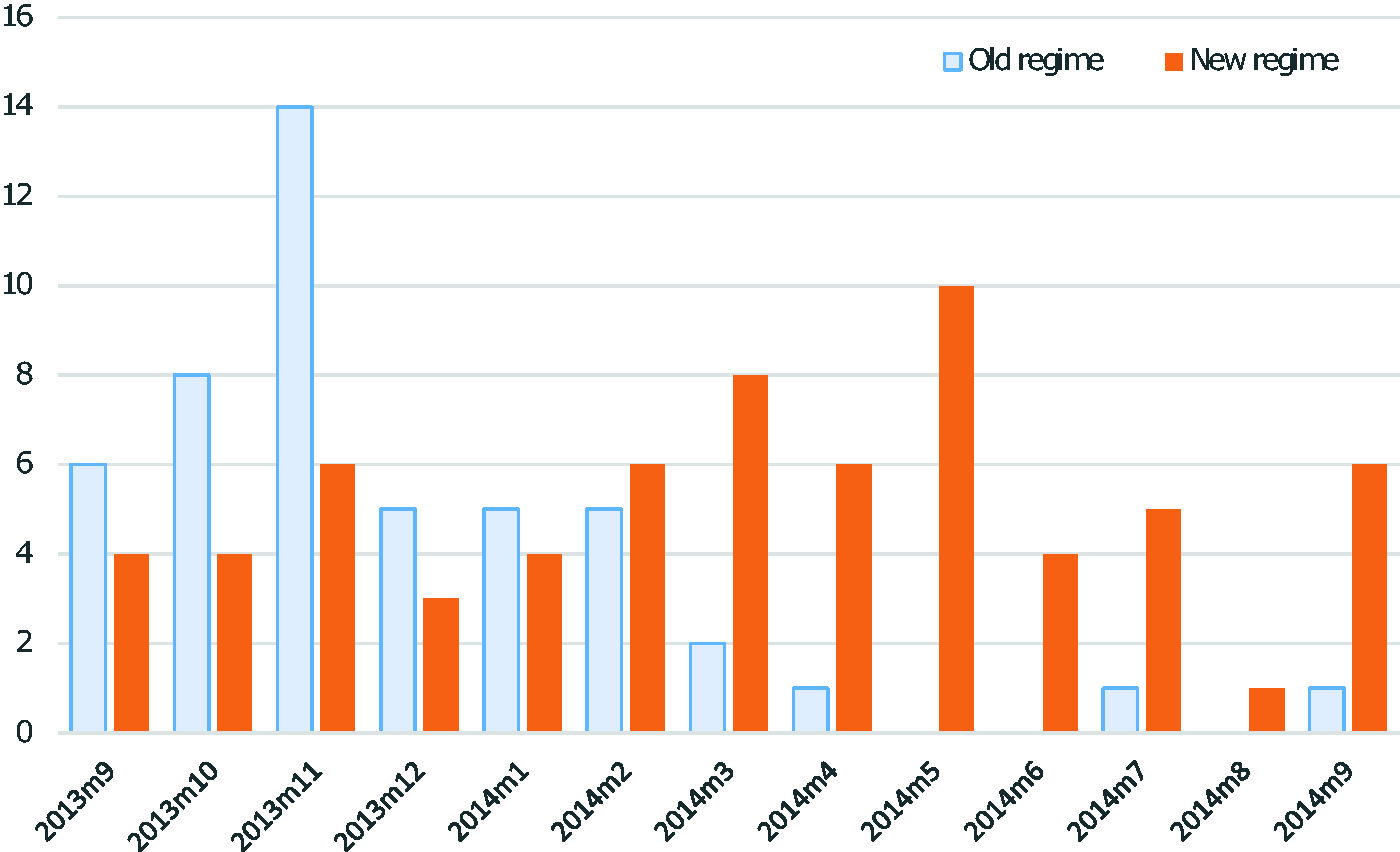
Frequency distribution of old and new CQC regime inspections.

Mean rates of falls with harm and pressure ulcers during the observation period.
Characteristics of acute NHS Trusts included in the comparison of old and new regime of CQC’s inspections.

*Values are mean ± SD, P50 (P25–P75) or n (%).
In the following section, figures show the trend for an average trust in each group for the three periods under study. Tables show the absolute values for the slopes and level changes observed. The model coefficients are reported in Appendix 2 (online only).
Pressure ulcers
The mean (95% CI) prevalence of pressure ulcers in April 2012 was 575 (470 to 679) for the historical inspection trusts, 590 (500 to 679) for the new inspection regimen trusts and 503 (407–600) for the uninspected group per 10,000 patients/month.
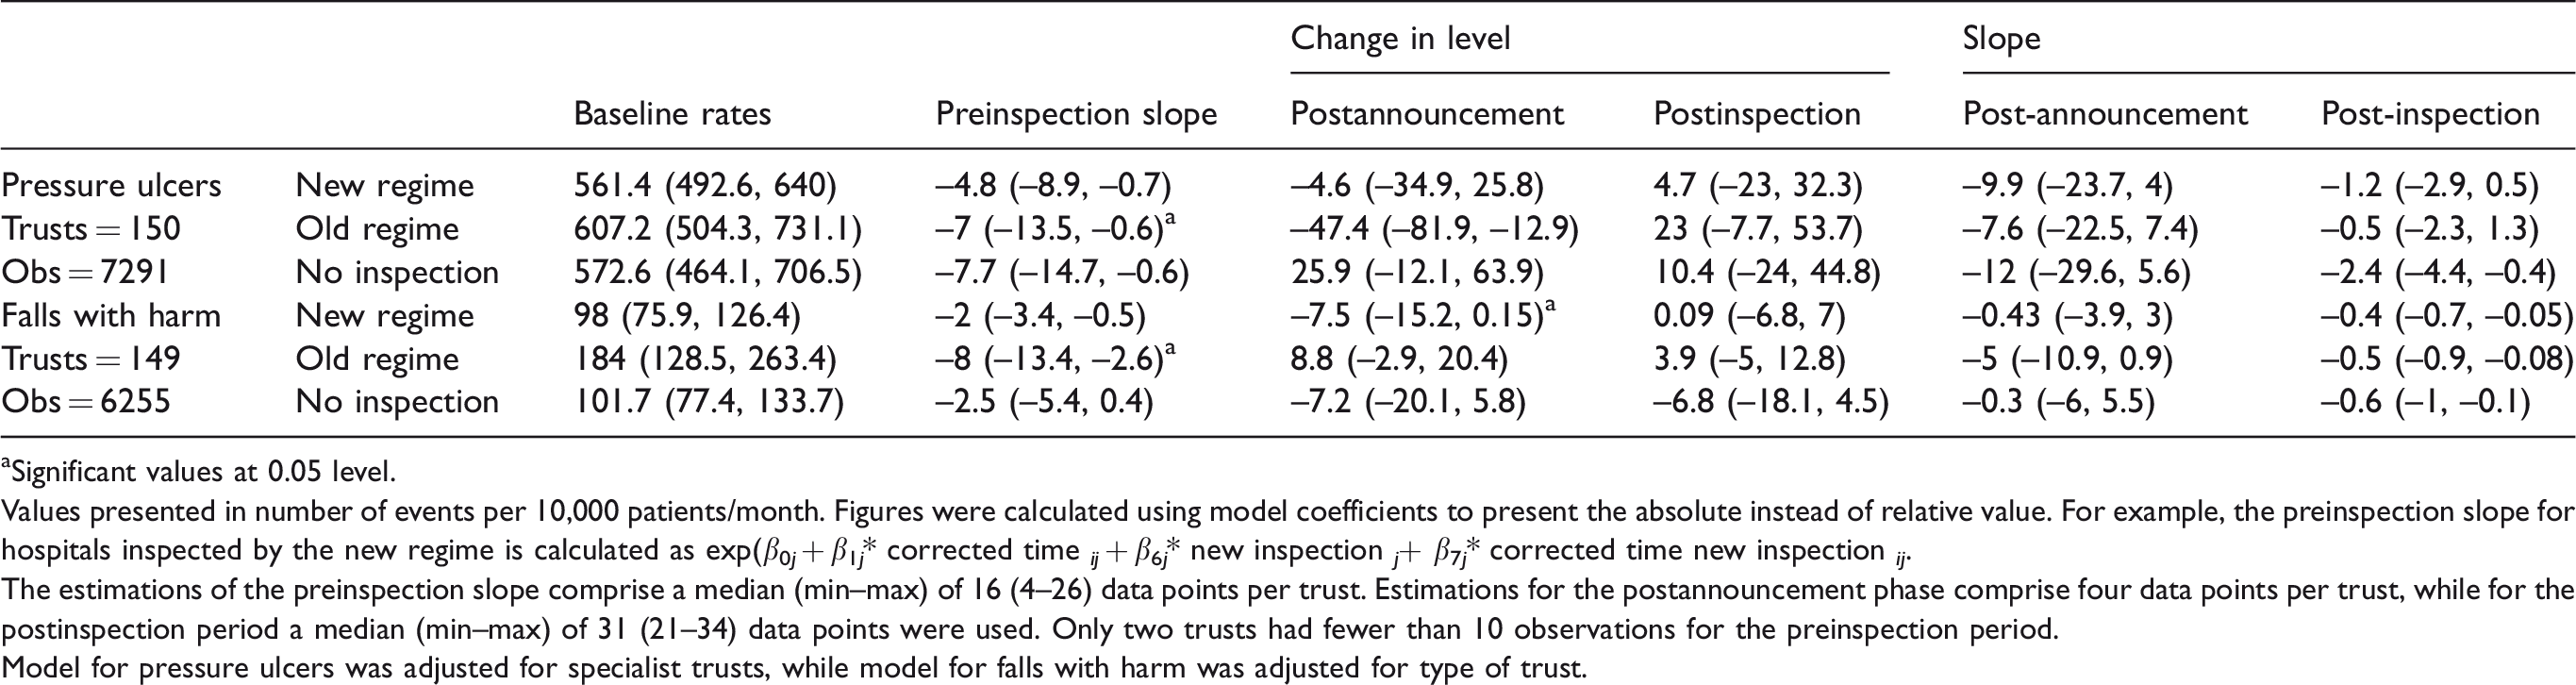
Rates of pressure ulcers were improving before CQC inspection in all three groups of trusts (Table 3, second column). Announcing the inspection had no immediate effect in the new regime group and significantly decreased rates in the historical regime group (–4.6 [–34.9 to 25.8] vs. –47.4 [–81.9 to –12.9] pressure ulcers per 10,000 patients/month; see Table 3, third column). The rate of improvement remained similar to the preinspection period (Table 3, fifth column). Postinspection, no effect was seen on the level or trend for any of the three groups (Figure 3). No significant changes were observed in the matched subsample (see Appendix 1, online only).

Predicted falls with harm.
Predicted changes in the slope and level of falls with harm and pressure ulcers before and after the announcement and inspection.
aSignificant values at 0.05 level.
Values presented in number of events per 10,000 patients/month. Figures were calculated using model coefficients to present the absolute instead of relative value. For example, the preinspection slope for hospitals inspected by the new regime is calculated as exp(β0 j + β1 j * corrected time ij + β6 j * new inspection j + β7 j * corrected time new inspection ij .
The estimations of the preinspection slope comprise a median (min–max) of 16 (4–26) data points per trust. Estimations for the postannouncement phase comprise four data points per trust, while for the postinspection period a median (min–max) of 31 (21–34) data points were used. Only two trusts had fewer than 10 observations for the preinspection period.
Model for pressure ulcers was adjusted for specialist trusts, while model for falls with harm was adjusted for type of trust.
Falls with harm
The mean (95% CI) prevalence of falls with harm in April 2012 was 90 (57 to 124) for the historical regime trusts, 108 (75–142) for new regime trusts and 90 (59–120) for uninspected trusts per 10,000 patients/month.
Rates of falls with harm were improving preinspection for all groups (Table 3, second column). Announcing the inspection was followed by nonsignificant changes in trend in all groups (Table 3, fifth column). The rate of falls with harm in new regime trusts was significantly lower than the one for the historically inspected trusts (–7.5 [–15.2–0.15] vs. 8.8 [–2.9–20.4] falls per 10,000 patients) postinspection announcement (Table 3, third column).
CQC inspections were associated with a slower improvement in rates of falls with harm in all groups (Figure 4 and Table 3, sixth column). No significant changes were observed in the matched subsample (see Appendix 1, online only).

Predicted pressure ulcers.
Discussion
CQC inspections were not associated with changes in the rates of two markers of quality: falls with harm and pressure ulcers. Any improvements made prior to the CQC inspection were diminished after inspection in an average trust. Historical and new regimes had similar effects, as did trusts not inspected at all.
Strengths and limitations
In the absence of a definitive trial, controlled interrupted times-series is a robust design to assess the impact of health policy. 20 Our analyses included most English acute trusts and a reliable time-series before and after inspections. Intervention points differed between trusts in our observation period (12 months), reducing confounding from historical events. The lack of effect in our matched – by potential confounders – group comparison increases confidence in our estimations.
As with all research, there are some limitations. First, statistical phenomena could explain adverse events trends. With high rates, any intervention might reduce them due to regression to the mean. Low rates may remain stable, as any possibility of improvement is reduced due to the floor effect. 21 Postinspection trend changes could be an artefact of the interruption point chosen. Since adverse events vary randomly, modelling could artificially change levels or trends.
The NHS ST has some strengths: it is publicly available, conducted monthly, nationally, uses consistent definitions and standards and facilitates real-time reporting and rapid trust responses. 17 However, it relies on self-reporting; consequently, variable data entry skills, flexible interpretations of operational definitions and variations in patient acuity within and between trusts can make it less reliable, and prone to ‘gaming’. 18 We are unaware of any published reliability assessment of the NHS ST, and so incorporating random variation into the estimation of effects was impossible.
Our choice to use NHS ST data for research purposes was pragmatic: hospitals themselves use this dataset to assess their safety levels and the effectiveness of safety interventions. CQC inspections and feedback are part of the approach trusts use to improve safety and quality. It follows, then, that trusts carrying out improvements will look for an impact on their NHS ST and adverse event rates.
Our statistical model estimates each hospital’s trajectory compared with the average performance of inspected trusts. Confidence intervals suggest variability within each group. Intrinsic features of NHS trusts may explain where inspections have an effect and where they do not. In 2013, trusts took over responsibility (from two NHS agencies) for the NHS ST. Individual trusts’ implementation of NHS ST may have differed in line with competing priorities and commitment to patient safety, diluting a national, coordinated effort and effects. Further subgroup and retrospective (qualitative) analysis of implementation could explore this possibility.
Events surrounding or during inspections may change the safety behaviour of NHS trusts and the outcomes seen. Examples of potential ‘external biases’ include: (i) NHS financial constraints that could have limited resources dedicated to patient safety; (ii) changes in clinical commissioning – whilst 17 (11%) of the trusts were inspected before clinical commissioning was fully implemented in 2013, this significant reform affected organizations for some time post implementation; and (iii) several high-profile quality improvement initiatives10,13 that happened alongside our time-series. Such external factors influence managerial and clinical priorities and behaviours and may contribute to our findings; however, any potential for bias was spread between all trusts.
Finally, the type of CQC inspection that trusts experienced was not random. 22 Trusts inspected by the new regime were more likely to be in special measures. Any trends in this group may be partially explained by regression to the mean for the regulatory intervention experienced.
Strengths and limitations in relation to other studies
Falls with harm and pressure ulcers are nursing-sensitive outcomes 15 influenced by the quantity and quality of nursing care. 23 The sensitivity of these indicators to CQC-style external inspections is equivocal. Implementing standard safety practices requested by accreditation agencies can be simultaneously associated with lower pressure ulcer rates 24 and an increase in level and trend of rate of falls after an accreditation visit. 25
Evidence regarding CQC and its predecessors is primarily qualitative.1,24 This is the first study quantitatively assessing the impact of CQC inspections of acute trusts. Walshe et al. 14 evaluated the CQC’s new inspection regime in its pilot phase, finding that whilst acute trusts saw inspection as a catalyst for resuming ‘on-hold’ improvement activities, inspections were time and resource-consuming.
Changes seen in adverse event levels postinspection announcement suggest that trusts may change their behaviour to respond to the demands of the regulator – an anticipatory effect. A recent study examining gaming effects surrounding external inspections of cleanliness in English hospitals supports this premise. 26
The CQC produces a detailed report about overall hospital performance after each inspection. For serious concerns about performance, an enforcement action is issued. However, when improvements are requested without enforcement, hospitals may be unclear regarding how best to proceed, timescales for implementation, their own accountability and standards expected. 14 Any potential CQC improvement influence can be diluted and delayed with unclear guidance.
CQC inspections allow trusts to validate and showcase their services’ quality. 27 CQC visits may confirm what providers already know of their deficiencies as well as outstanding areas of care. 14 , 27 NHS providers asked if the benefits of CQC inspections justified their costs gave mixed responses: 38% agreed and 38% disagreed. Many felt the ‘same benefits could be achieved through a more streamlined approach’. 27
Study implications
Although CQC inspections were not associated with changes on rates of two adverse events, this does not mean that CQC did not improve the overall care quality. The existence of the CQC and the possibility of being subject to a rigorous and detailed inspection at relatively short notice doubtless provide an incentive for maintaining hospital quality and thus managerial reputation.
Alternative explanations for the trend observed may include the diversion of clinical teams and managers away from clinical practice and towards implementation of improvements achievable in the time available (approximately 20 weeks). CQC requires detailed information in advance and holds focus groups with senior staff; all requiring trust administrative time.
A change in safety reporting behaviours may also offer some explanation. Sari et al. 28 suggest that approximately 56% of falls and 23% of pressure ulcers are reported to routine systems. The possibility exists, therefore, that increases in falls with harm and pressure ulcers observed post inspection reflect an increase in incident reporting instead of the number of events. If true, CQC inspections might be driving improvements in fundamental processes necessary for quality improvement that are not detected in a short time span.
Bevan and Fasolo 29 argue that various models of quality governance exist at various times. Whilst a combination of top–down hierarchical approaches, target setting and appeals to reputation were the most effective, reputation alone can still be a powerful lever. 29 Reputation-based governance works when performance information is ranked, transparent, understandable by the public and when performance is followed up. 29 Current CQC arrangements may encourage transient organizational change, but, arguably, lack the essential components for effective reputation-based governance. Reports are publicly available but not easily understandable, hospitals receive a rating but no ranking, and accessible tabular or graphical methods for comparing performance over time are hard to find.
Future research
Our results suggest that the expectation of future inspection(s) may influence acute trust behaviour, but has not led to positive lasting change. With the power to issue enforcement actions and monitor remotely, the CQC might consider reducing the burdensome (and resource-intensive) method of comprehensive inspections. The optimal ‘dose’ of inspection required for efficient scrutiny of trusts is unknown.
Bevan and Hood 8 suggest that informing institutions how and when their performance will be measured is an open invitation to game the monitoring system. 8 Adding randomness to oversight (and evaluating the effects) could increase certainty that observed improvement is real. Several attempts to improve external oversight of the NHS have been deployed historically: diverse types of rating systems, risk stratification methods and varied approaches to onsite visits. The sense of dissonance between oversight activities and ‘everyday work’ in trusts remains and with it a limited ability to influence improvement. 27
Oversight of quality and safety has been in place for nearly 20 years within the NHS. 30 Each regulator has been criticized and then replaced with ever more complex solutions promising to remedy the ills of previous structures and institutions. If increasing regulation has not delivered improvement, then it may be time to consider reducing the administrative burden of inspection and regulation and monitoring the costs and effects of doing so.
Future research should focus on the effect of external oversight on other outcomes of care, such as risk-adjusted mortality, waiting times and emergency readmissions, to increase certainty about the effects of these systems. The NHS needs evidence of the cost-effectiveness of CQC external oversight. Finally, exploring the relationship between the CQC rating systems and specific outcome measures may help establish the validity of the instruments used.
Supplemental Material
Supplemental material for The effect of external inspections on safety in acute hospitals in the National Health Service in England: A controlled interrupted time-series analysis
Supplemental Material for The effect of external inspections on safety in acute hospitals in the National Health Service in England: A controlled interrupted time-series analysis by Ana Castro-Avila, Karen Bloor and Carl Thompson in Journal of Health Services Research & Policy
Footnotes
Acknowledgements
The authors thank Tim Doran and Richard Cookson for their valuable insight during the execution of this research. Mona Kanaan, Simon Crouch and Catherine Hewitt provided statistical advice throughout the analysis phase. The views expressed are those of the authors and do not necessarily reflect those of the NHS, the NIHR, NETSCC or the Department of Health.
Declaration of conflicting interests
The author(s) declared the following potential conflicts of interest with respect to the research, authorship, and/or publication of this article: All authors have completed the ICMJE uniform disclosure form at  and declare: no support from any organization for the submitted work; no financial relationships with any organizations that might have an interest in the submitted work in the previous three years; Professor Thompson reports that from August 2013 to July 2016, he was a nonexecutive director of Leeds York Partnership Foundation Trust which was fully inspected twice by CQC during that time.
Funding
The author(s) disclosed receipt of the following financial support for the research, authorship, and/or publication of this article: This research received no specific grant from any funding agency in the public, commercial, or not-for-profit sectors. However, ACA is funded through a Becas Chile scholarship programme (CONICYT, Chile). CT and KB receive funding as part of the NIHR CLAHRC Yorkshire and Humber.
References
Supplementary Material
Please find the following supplemental material available below.
For Open Access articles published under a Creative Commons License, all supplemental material carries the same license as the article it is associated with.
For non-Open Access articles published, all supplemental material carries a non-exclusive license, and permission requests for re-use of supplemental material or any part of supplemental material shall be sent directly to the copyright owner as specified in the copyright notice associated with the article.
