
Abstract
Objective
To estimate changes in Boston Emergency Services Team (BEST) psychiatric emergency services (PES) encounter volume (total and by care team) and inpatient disposition during the first 8 months of the COVID-19 pandemic.
Methods
Data on 30,657 PES encounters was extracted from the four-county, BEST reporting system. The study period consisted of the first 34 weeks of 2019 and 2020. This period corresponded to the first five stages of Massachusetts’s COVID-19 public health restrictions: pre-lockdown, lockdown, Phase I, II and III reopenings. Descriptive and regression analyses were performed to estimate changes in encounter volume by care team and disposition.
Results
Compared to the same period in 2019, covariate-adjusted, weekly PES encounters decreased by 39% (β = −0.40, 95% Confidence Interval (CI) = [−0.51, −0.28], p < 0.00) during the lockdown. PES volume remained significantly lower during Phase I reopening compared to the previous year but returned to 2019 levels during Phase II. The covariate-adjusted proportion of weekly encounters that led to inpatient admission significantly increased by 16% (CI = [0.11, 0.21], p < 0.00) for mobile crisis teams (MCTs) and significantly declined by 13% (CI = [−0.19, −0.07], p < 0.00) for BEST-designated emergency departments during the lockdown period compared to the prior year.
Conclusions
The overall drop in PES utilization and the rise in inpatient admissions for MCT encounters suggests that during the early phases of the pandemic, patients delayed psychiatric care until they had a psychiatric crisis. Public health messaging about the lockdowns and absent equivalent messaging about the availability of telehealth services may have made patients more reluctant to seek psychiatric care.
Introduction
A month after the Commonwealth of Massachusetts’s first reported case of the novel coronavirus (COVID-19), the governor declared a state of emergency (10 March 2020) to combat the pandemic. 1 This state of emergency was quickly followed with public safety orders including limiting the size of gatherings, closing schools, restaurants, and non-essential businesses, and a stay-at-home advisory (a lockdown beginning 23 March 2020). Massachusetts loosened public health restrictions in late May 2020 and preceded to move through phased ‘reopening’ throughout the summer of 2020.
During spring and summer 2020, US COVID-19 restrictions occurred in parallel with the European response, although European mitigation efforts were typically more severe. Most European states and the US underwent a lockdown period in March and April 2020. The number of US and European patients seeking non-pandemic–related emergency treatment during the early pandemic lockdown periods significantly declined.2–6 US and European hospitals conducted significantly fewer psychiatric consultations in the emergency department (ED) and saw fewer patients with psychiatric disorders in the months of March, April and May 2020.2,3,5–17 Some studies reported rising European psychiatric ED volumes towards the end of lockdown periods, but visit rates remained lower than pre-pandemic volumes.16,17
As COVID-19 cases declined in May 2020, non-essential businesses began to reopen. One US study found ED visits for psychiatric conditions rose in late April 2020 and reached pre-lockdown levels by the end of June 2020. 3 Another found that psychiatric emergency services (PES) volumes remained below pre-pandemic volumes through August, leaving the effect of reopenings on PES volume unclear. 18 One Massachusetts study found evidence suggesting non-PES mental health utilization rose during the pandemic lockdown period and began to return to pre-pandemic levels shortly after reopening. 19
Some European studies found a significantly higher percentage of PES patients were admitted to hospitals during lockdown, whereas other studies found no significant differences in rates of hospital admission in 2020 compared to 2019.2,6,9–11,16 Studies of European PES encounters during COVID-19 found a trend towards a greater proportion of visits for suicidal behavior and psychotic disorders, and a decrease in the proportion of visits for mood disorders and anxiety disorders.13,15–17,20
There has been speculation that precautions taken to combat COVID-19, such as social distancing, weaken typical social support systems and increase loneliness. This, in turn, may increase the risk of anxious and depressive symptoms. 21 One study found increased rates of suicidal ideation at the height of the Spring 2020 lockdown. 20 A small study found significant increases in outpatient care for anxiety disorders and bipolar/schizophrenic disorders during the lockdown phase in Massachusetts. 19 Fear of contracting COVID-19 may have been a barrier to accessing both emergency and non-emergency care. These factors increase the importance of tracking PES visits to determine how the pandemic and related stressors affected visit volume and acuity.
While many patients access PES through EDs, many cities have begun using mobile crisis teams (MCTs) to respond to psychiatric emergencies in the community. 22 MCTs have been shown to have lower rates of hospitalization and, as a community-based program, can reach more diverse populations.23,24 Despite there being MCTs in over 17 states in the US, there are currently no studies detailing the relationship between COVID-19 and MCT volume. 25
This retrospective cross-sectional study characterized how the COVID-19 lockdown and reopening of Massachusetts were associated with the encounter volume and acuity of PES provided by the Boston Emergency Services Team (BEST). We examined differences in utilization outcomes for two distinct types of PES: teams dedicated to ED and community-based MCTs. To the best of our knowledge, this study is the first to compare EDs and MCTs during the COVID-19 pandemic.
Methods
Study site
Every region in Massachusetts is served by one designated emergency services provider. The BEST, a multi-channel PES program operated by Boston Medical Center, is the designated PES program in metropolitan Boston and Fall River. BEST ED teams provide emergency psychiatric evaluation and management at three designated EDs. In addition, BEST has three MCTs that perform evaluations and interventions in a wide array of community settings (including three designated BEST urgent care centers (UCC), homes, schools, shelters, non-designated ED, and other health care settings). BEST services can be accessed through multiple pathways. A patient may walk into a designated ED or UCC. Any member of the community may contact the call center to ask for MCT evaluation, including patients, friends or family members of patients, health care providers, police, school staff, shelter staff, non-designated EDs and employers. The call center will dispatch an MCT or arrange transportation to a UCC whenever safe or will access emergency services to transport a patient to a designated ED when needed. MCT teams staff the UCC and respond to calls from the community.
BEST is designed and structured to meet the needs of patients who are publicly insured or uninsured; however, BEST serves all youth regardless of insurance status and provides services for commercially insured adults in certain circumstances (when facilities contract for BEST services regardless of insurance status or when emergency care is required before insurance status can be established). In 2020, about 6% of the commonwealth was uninsured, and 40% were publicly insured, whereas BEST patients were overwhelmingly either publicly insured (85%) or uninsured (12%). 26 While the population of Massachusetts was approximately 78% non-Latino White, 6% non-Latino Black and 8% Latino, the population served by BEST is approximately 41% non-Latino White, 27% non-Latino Black, 25% Latino and 7% another race/ethnicity. 26 As well, almost one-fifth of BEST patients were homeless.
BEST maintained in-person services – including walk-in urgent care center access, ED services and home visits – across all sites throughout the lockdown and phased reopening. Staff conducted COVID-19 screening surveys and arranged for evaluation; no patients were turned away. Starting on the second day of lockdown (11 March 2020), the MCTs also offered telehealth for clients in the community who were in quarantine for COVID-19 or who had active COVID-19 symptoms. Clients who declined an in-person evaluation due to fear of COVID-19 exposure could also opt for a telemedicine encounter. Patients were seen in the urgent care centers and EDs using the PPE protocols for each individual site. Of note, non-BEST services in the community (e.g. outpatient providers, partial hospital programs and in-home therapists) moved to telemedicine during the initial lockdown phase and slowly reopened as the public health restrictions eased. At the time of this writing, most non-BEST community behavioral health services are a hybrid of virtual and in-person delivery.
Data sources
We extracted aggregate weekly reports of PES encounters from the BEST electronic health record system. We analyzed 34 weeks of data from 2020 (January 1–August 31) and compared it to the corresponding 34 weeks of data from 2019 (January 1–August 31). We excluded encounters that were for scheduled urgent medication management services or were part of a jail diversion program. Our final sample, 30,657 total encounters, was 98.9% of all BEST encounters during the study period. We drew on other two other data sources for covariates. Given the positive relationship between ambient temperature and emergency psychiatric visits we controlled for weekly temperature using data from the National Oceanographic and Atmospheric Agency. 27 We extracted weekly, county level data on COVID-19 cases in the four counties served by BEST (Suffolk, Middlesex, Norfolk and Bristol) from the New York Times COVID-19 database. 28 All study procedures were approved by the Boston University Medical Campus and BMC Institutional Review Board.
Variables
Care team
Weekly visit counts were categorized by which PES team (ED or MCT) performed the encounter. Care Team was included to evaluate differences between the teams in the context of COVID public safety measures.
Disposition
To assess for changes in the acuity of psychiatric presentations, weekly visit counts were also categorized by discharge to: (1) locked inpatient units, (2) outpatient care (outpatient appointments, partial hospital program, intensive outpatient treatments, and natural supports) or (3) unlocked units with 24-h supervision and treatment (e.g. community crisis stabilization units or acute substance use disorder treatment programs).
COVID-19 phases
To evaluate volume and acuity in the context of different levels of public health response to COVID-19, we organized weekly visit counts into five distinct phases corresponding to Massachusetts’s COVID-19 closures and subsequent phased reopening: (1) Pre-lockdown – January 1 to March 9, (2) COVID-19 lockdown – March 10 to May 17, (3) Phase I reopening – May 18 to June 21 (outdoor recreation, high priority preventative services and some personal service businesses reopened), (4) Phase II reopening – June 22 to July 12 (retail businesses and restaurants reopened at limited capacity) and (5) Phase III reopening – July 13 to August 31 (museums, gyms, and casinos reopened). 29
Temperature and Seasonality
Independent of the pandemic, seasonality and weather are known to affect emergency service use.30–32 Boston and Fall River weekly average temperatures were used to control for changes in temperature. The week of service (1–34) was used to control for seasonality. We defined a week as belonging to the month it started in. All regression models included these two covariates.
Analysis
All analyses were performed in Excel and Stata 14.2. Weekly patterns in encounter volume and disposition acuity were examined first with a series of graphs. Each graph compared new weekly COVID-19 cases in the BEST catchment area and PES volume changes.
Regression analysis was used to estimate the association between COVID-19 volume and BEST volumes overall. To account for pre-pandemic visit trends, we performed statistical and regression analyses comparing week-on-week encounter volumes and admission testing comparing before the pandemic to the pandemic period. Using t-testing, we examined volumes and changes in volume for all BEST encounters; volumes and changes in volumes stratified by type of care team (MCT and ED). To estimate the percentage changes in outcomes, we ran log-linear, fixed effects regressions separately for each pandemic phase.
Results
Patient volume, by care team and disposition.
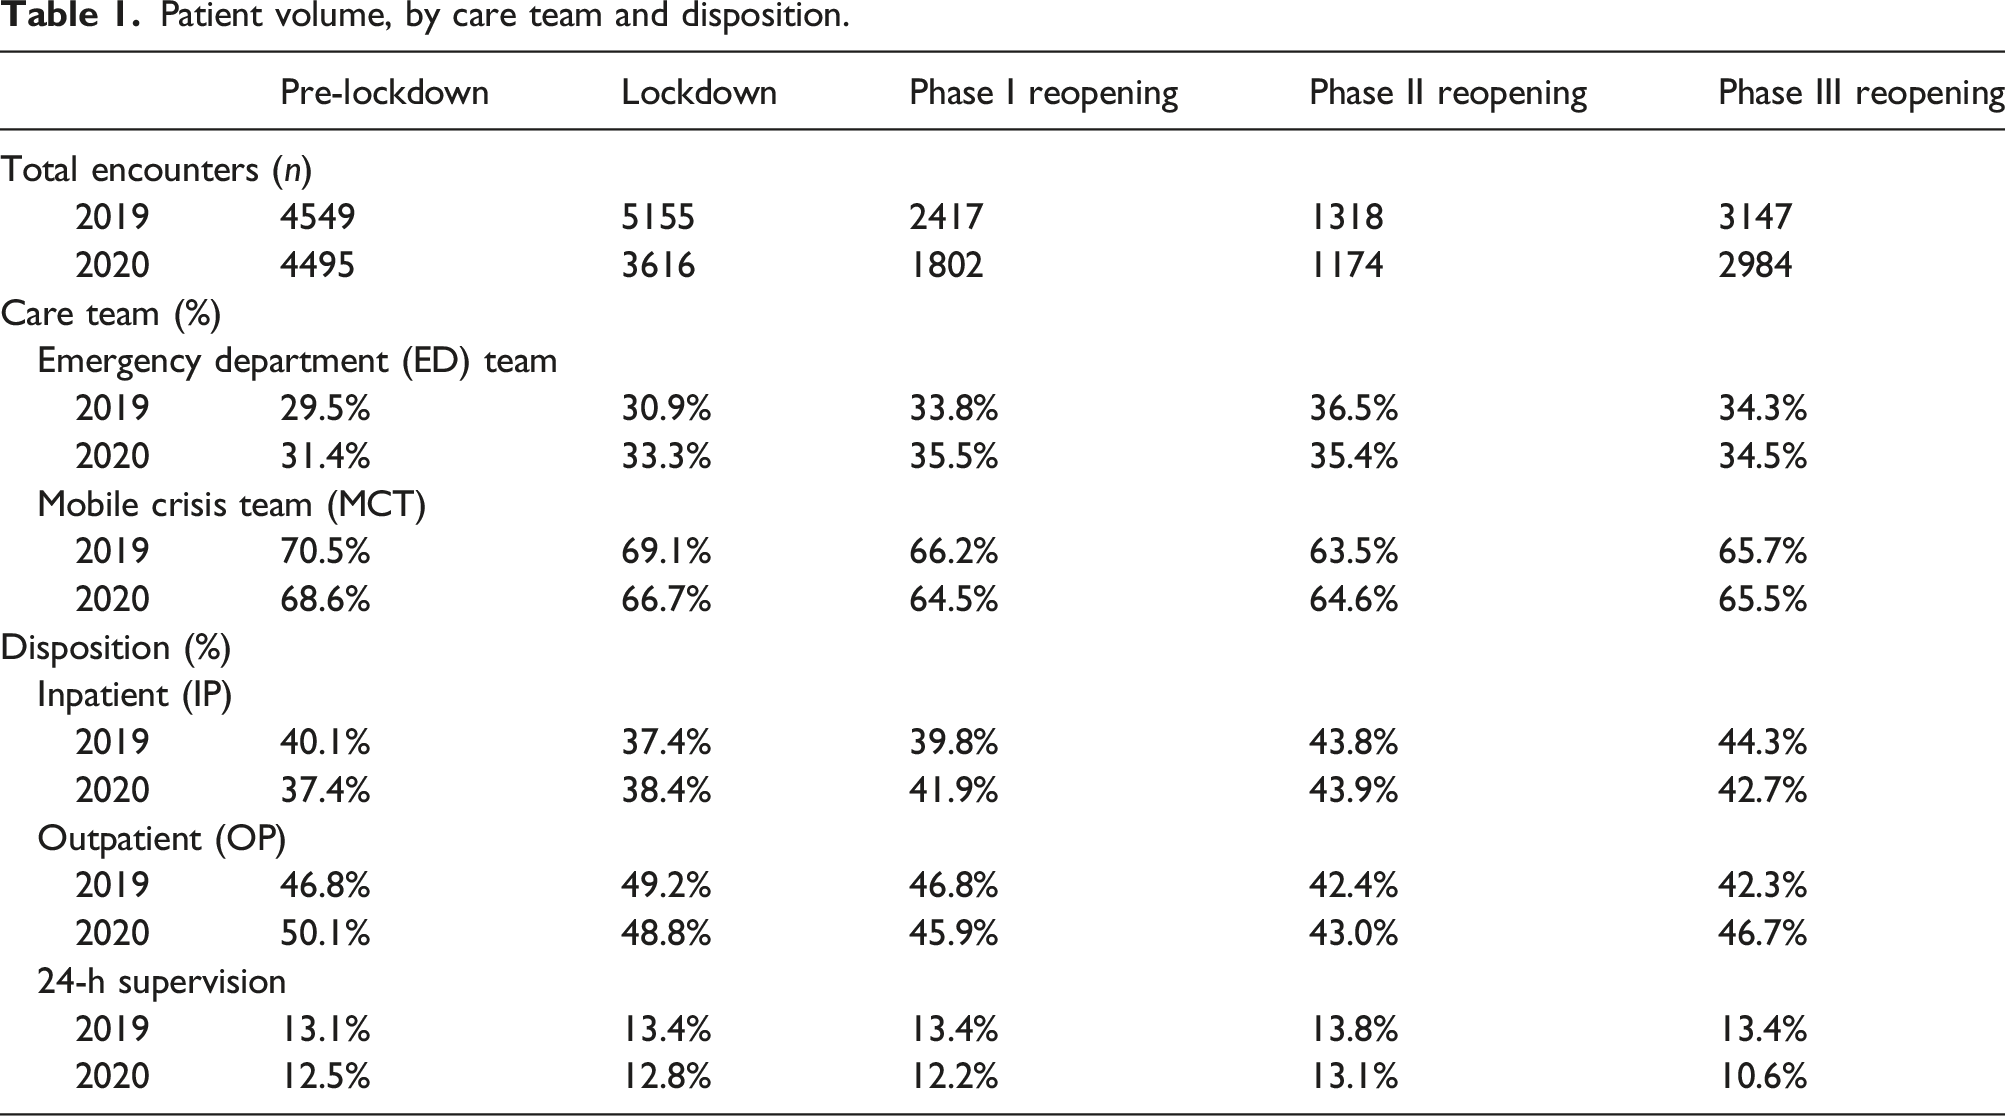
Figure 1 shows the visits graphically, with the five time periods (‘phases’) each shaded differently, starting with white. Weekly volume in 2019 and 2020 was comparable during the first 10 weeks of each year (Figure 1(a)). The greatest difference in volume between 2019 and 2020 occurred in during lockdown, when there were 242 fewer encounters in 2020 than in the corresponding week of 2019. Even as new COVID-19 cases decreased during lockdown, PES volume remained lower than in 2019. During the first reopening phase, 2020 weekly volume gradually approached that of 2019, and reached parity with 2019 volume by the start of Phase III. Weekly volume for EDs and MCTs both showed similar trends, as shown in Figures 1(b) and (c). A 1000-case increase in COVID-19 cases within a week in the Boston area was associated with a 0.8% reduction in weekly BEST encounters overall, and a 1% decrease in weekly BEST ED care team encounters. Weekly encounter volume with COVID-19 case counts.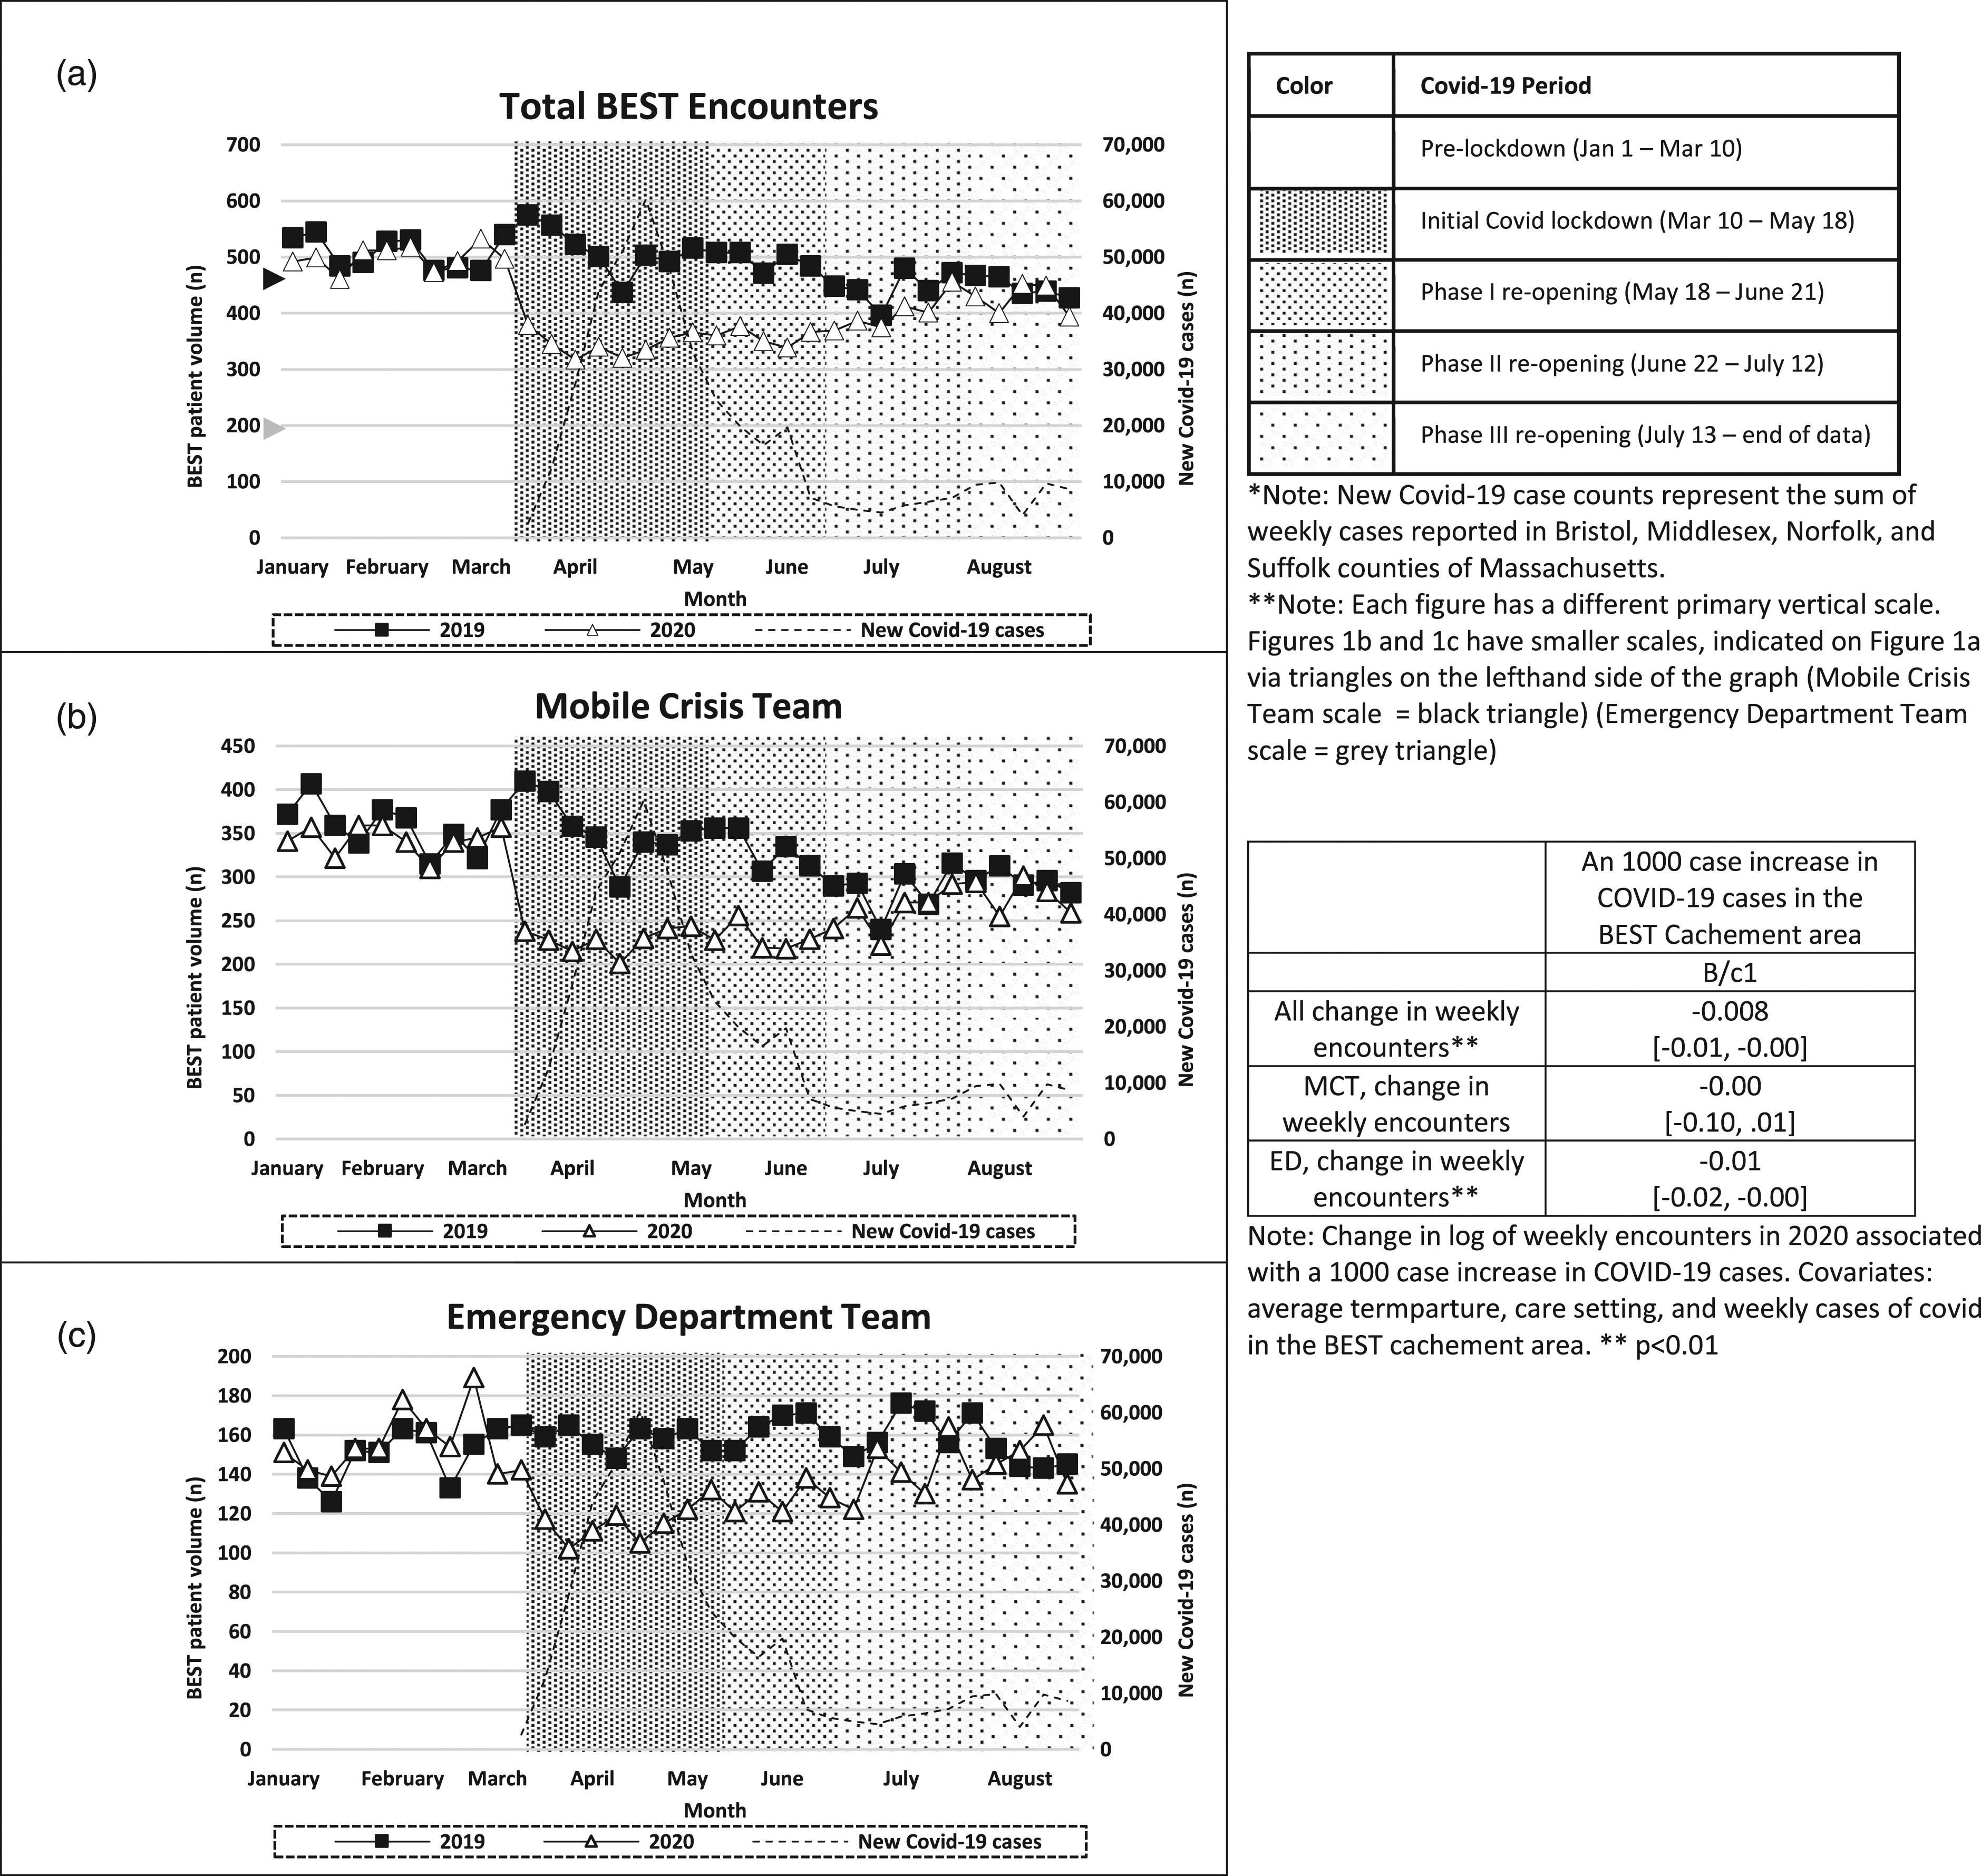
Table 1 shows 2019 and 2020 encounter rates broken down by care team and disposition for each phase in the pandemic timeline. Encounter volumes in each phase were lower in 2020 than in 2019. In all phases and in both years, more than 63% of encounters were performed by the MCT. ED teams accounted for the less than 37% of encounters in any phase. A disposition of inpatient admission suggests that an encounter was of high acuity. During the 2020 lockdown, Phase 1 reopening and Phase II reopening, the share of encounters that resulted in inpatient disposition were slightly higher in 2020 than in 2019.
Mean numbers of weekly encounters and percentages of encounters that resulted in inpatient disposition (IP).
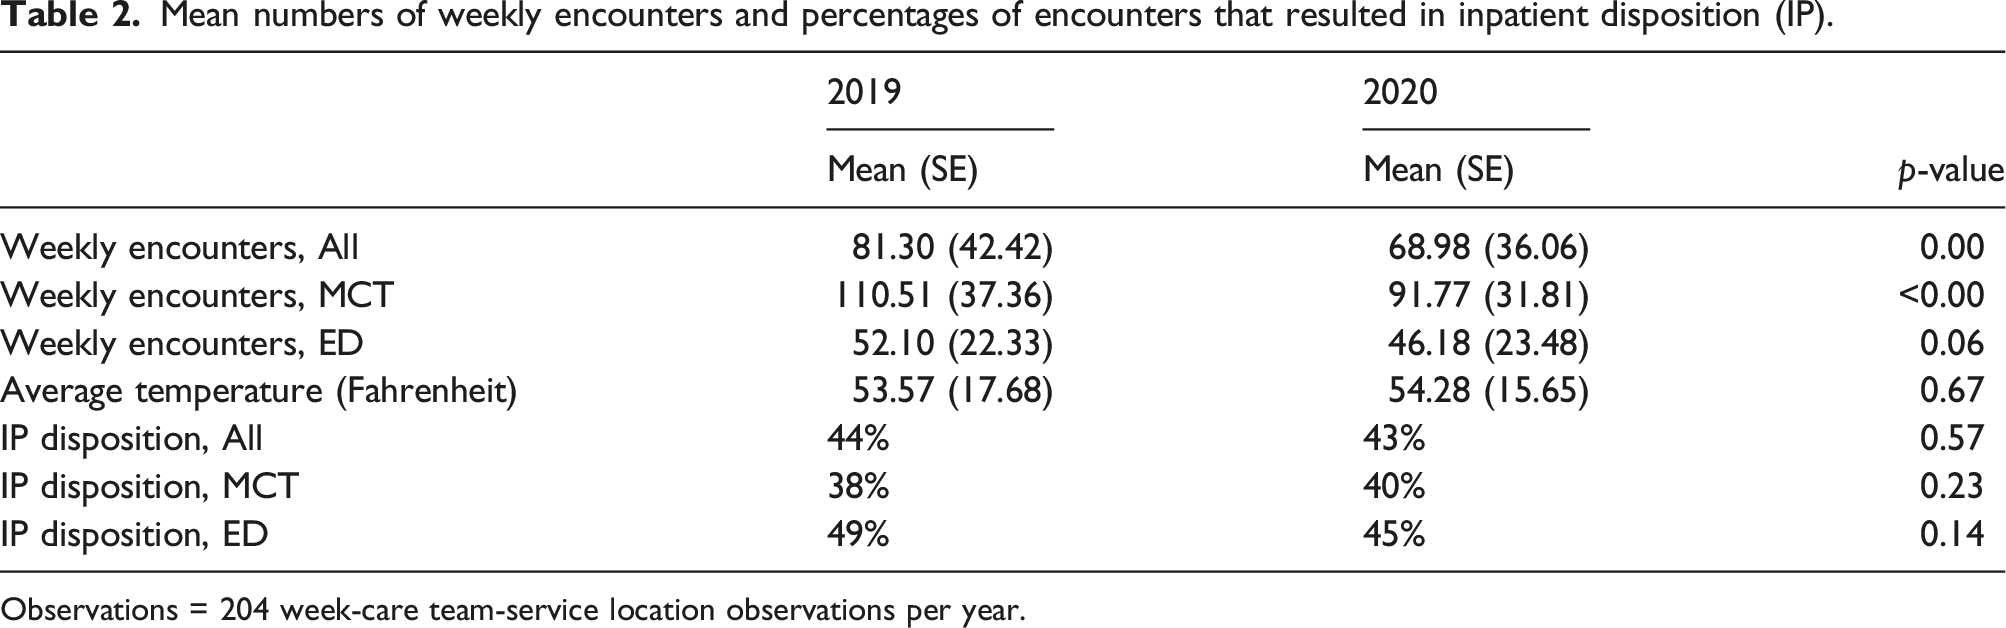
Observations = 204 week-care team-service location observations per year.
Regression analysis – change in encounters between 2019 and 2020.
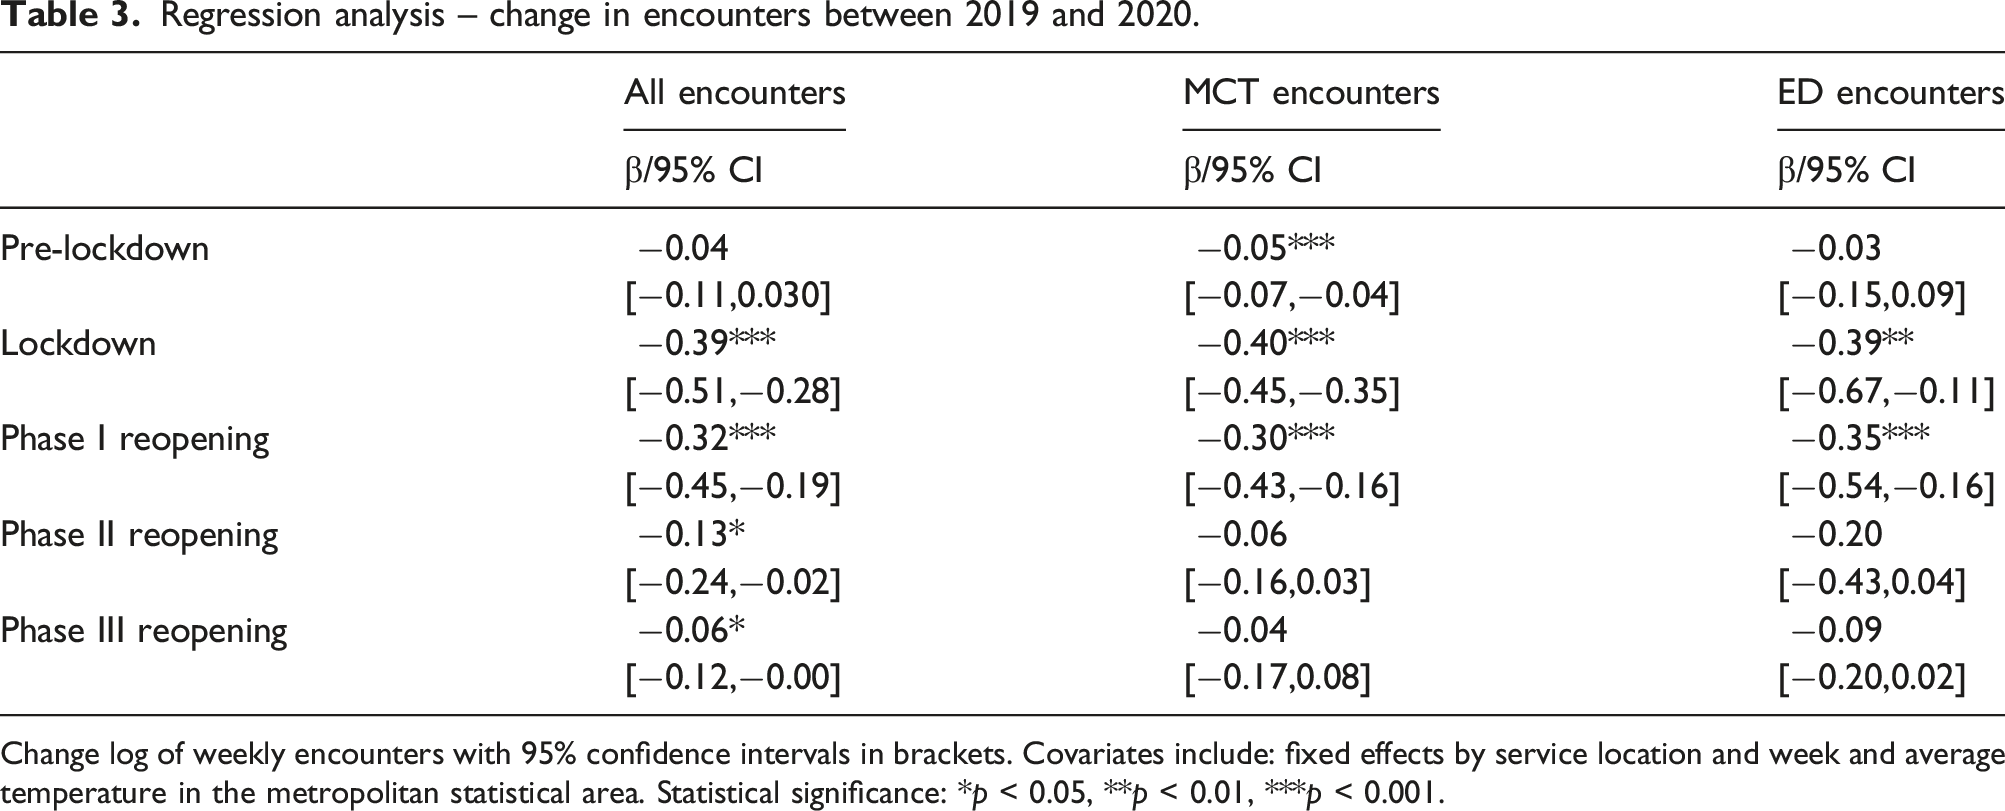
Change log of weekly encounters with 95% confidence intervals in brackets. Covariates include: fixed effects by service location and week and average temperature in the metropolitan statistical area. Statistical significance: *p < 0.05, **p < 0.01, ***p < 0.001.
Regression analysis – Change in inpatient disposition.
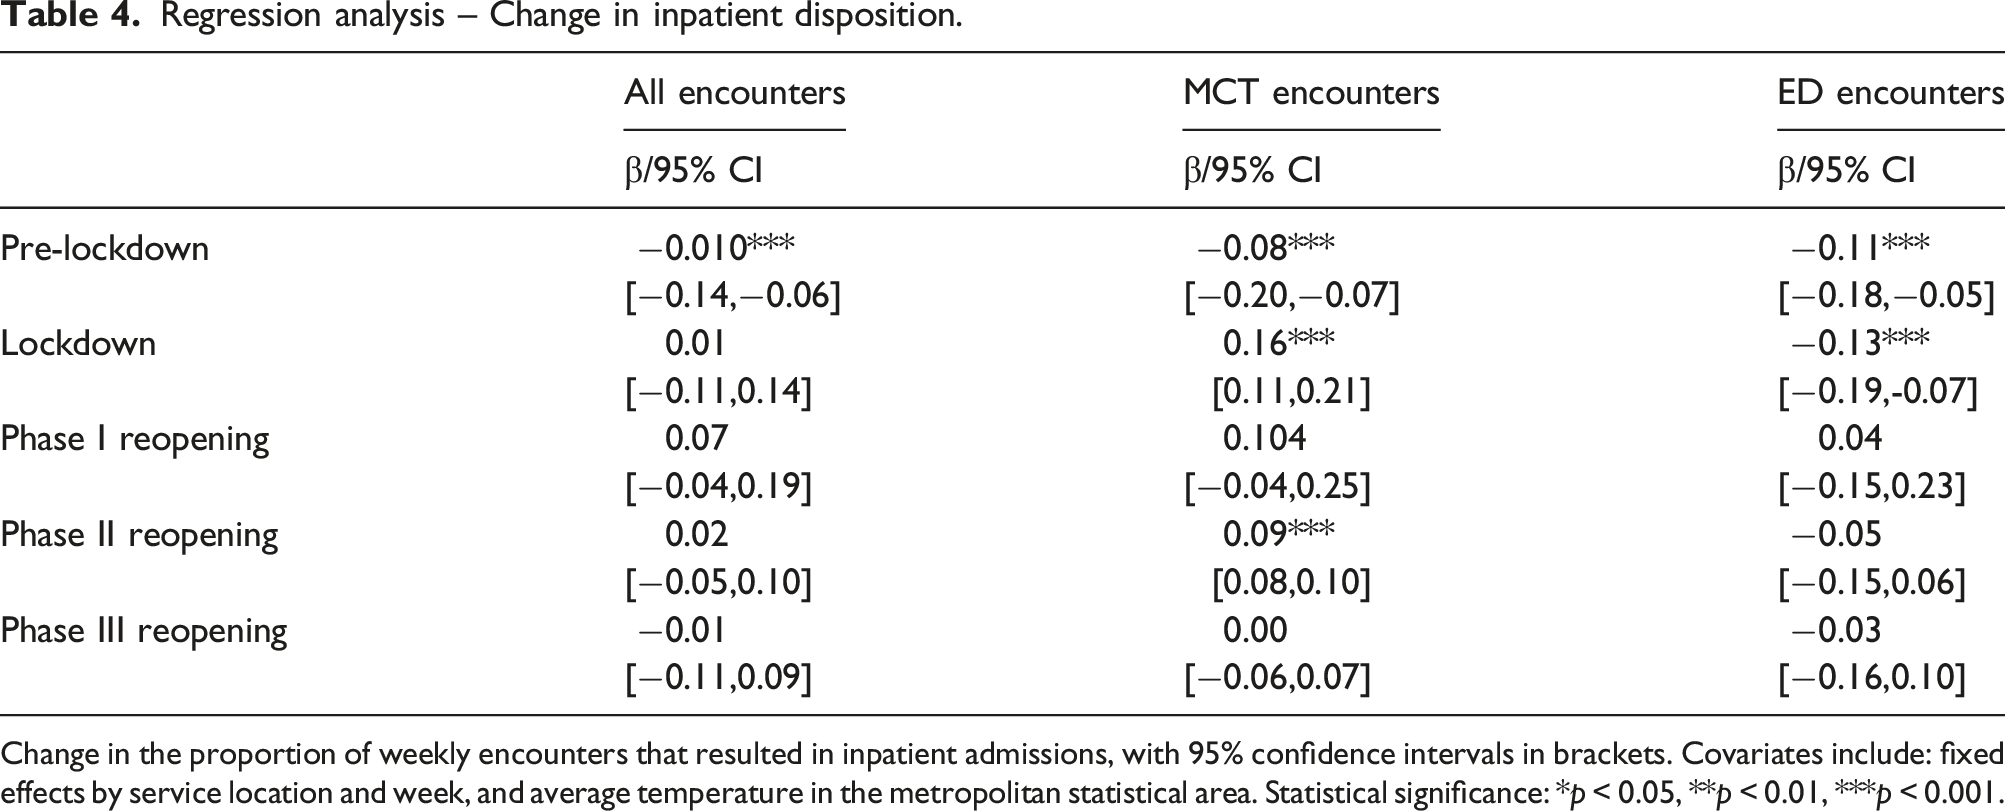
Change in the proportion of weekly encounters that resulted in inpatient admissions, with 95% confidence intervals in brackets. Covariates include: fixed effects by service location and week, and average temperature in the metropolitan statistical area. Statistical significance: *p < 0.05, **p < 0.01, ***p < 0.001.
Discussion
To the best of our knowledge, this is the first paper to describe trends in US PES volume and acuity across different care settings during the COVID-19 pandemic’s first 6 months, in a predominantly publicly insured and uninsured population. The initial lockdown and first reopening phases were associated with significantly lower rates of encounters than the prior year. PES volume increased through Phase I and returned to 2019 levels in Phase II. The proportion of encounters that led to inpatient psychiatric admission significantly increased for MCT in the lockdown phase and Phase II and declined for EDs in lockdown.
The mission of PES is to supply timely, high quality, specialized psychiatric care to patients who would otherwise be seen by general practitioners in emergency room settings. The public health response to COVID-19 temporarily disrupted these efforts. As occurred in Europe, the initial lockdown phases of the COVID-19 pandemic significantly decreased use of PES.
Typically, emergency services become the source of care when other services are unavailable. This is not what happened in Massachusetts during March through July. During the lockdown and phased reopening, patients had no access, limited access or remote-only access to outpatient psychiatrists, therapists, day programs, partial hospital programs, support groups, drop-in centers, community centers, libraries and retail businesses. They did not, however, have an equivalent increase in use of PES. Domestic and international studies of local psychiatric care during COVID-19 may need to estimate pandemic-related shortages in service availability. Such information may be invaluable to future efforts to continue psychiatric care during a local health shock.
The increase in inpatient admissions following an MCT encounter suggests that patients treated by MCTs may have had higher acuity during the pandemic than the year prior. Another explanation is the introduction of telehealth. Prior to the COVID-19 pandemic, BEST PES services were provided in person when a patient or patient advocate reached out. The BEST MCTs introduced telehealth visit at the beginning of the lockdown as a safer option for accessing care. Telemedicine has been used previously for non-routine care, with the provider reaching out to the patient with instructions on how to access care. In contrast, emergency telemedicine services require the patient or patient advocate to reach out to the provider for those services. The decrease in overall MCT admissions suggests that many potential patients or referral sources (such as schools and families) may not have been aware that emergency telehealth was available. The increase in inpatient admissions during the early pandemic could reflect greater underlying need or, alternatively, telehealth evaluations may have made assessment of acuity more difficult and MCTs could have erred towards safety.
One universal concern in health care systems during the pandemic was that patients would delay care until it was an emergency. Increased acuity in psychiatric visits reported nationally would suggest this fear was well founded. 19 In Massachusetts, this concern was confirmed by the drop in total volume during the lockdown and increased rate of inpatient admissions for urgent care centers during the lockdown. Patients with serious mental illness are at higher risk of adverse social determinants of health and faced higher rates of unemployment, housing insecurity and food insecurity during the pandemic. 33 Emergency services often act as the last safety net for patients – providing safe shelter, food, and 24-h medical care. The adverse effects on social determinants of health for patients with serious mental illness would predict an increase in PES volume if patient access to care was not hindered by pandemic-related factors. The drop in PES utilization during the pandemic is of concern because it may also reflect a worsening deficiency in meeting basic needs.
Limitations
This study has three main limitations. First, it only examined one PES program that serves primarily publicly insured or uninsured individuals. These findings therefore may not generalize to other programs and location. Given that patients of color, a population heavily represented in BEST, have been disproportionately affected by the pandemic, it may be particularly important to understand how the pandemic changed health care utilization by this population.34,35 At the time of this analysis, patient-level diagnostic and demographic information about this population during the pandemic was unavailable, precluding person-level trend analysis.
Second, in response to public health messaging about lockdown, patients may have been afraid to leave the house or shelter for fear of exposure to COVID-19. It is difficult to measure this factor because it is difficult to gauge how lockdown restrictions were advertised and enforced. To address this limitation, we did assess how increases in new COVID-19 cases were associated with the weekly rate of BEST encounters (Figure 1), as a proxy for the relative burden of COVID-19 at any given time.
Third, there is no weekly data available on how the COVID-19 pandemic affected availability of inpatient and 24-h beds, and different outpatient levels of care. As such, this study could not consider those issues.
Conclusions
This study raises a series of questions about the reaction of PES systems to disasters such as the COVID-19 pandemic. The disproportionate effect of the pandemic on the health of communities of color makes investigation of trends, diagnoses, and emergency psychiatry evaluations by racial/ethnic group vital to understanding the resilience of PES. The development of telemedical services created a series of unexpected innovations in care, namely, a PES structure for handling telemedicine patients throughout the BEST system and new forms of billing by insurance to support telemedicine. Local health care organizations remain committed to reducing ED boarding. However, increases in inpatient admissions from BEST and COVID-19 restrictions on inpatient units may have affected ED boarding times for patients, leading to lower quality of care and a hidden burden on ED personnel. To address such questions, quantitative analysis of PES data and qualitative studies involving policy makers, patients and front-line providers are needed.
An intervention that could be supported by this study is better messaging to the community about the availability of telehealth for emergency evaluations. To address the concern that many patients may have had limited access to telehealth for both routine and emergency care, health care systems and municipalities should explore options for public access to phones or computers that can be sanitized and used with appropriate privacy.
Footnotes
Declaration of conflicting interests
The author(s) declared no potential conflicts of interest with respect to the research, authorship, and/or publication of this article.
Funding
The author(s) received no financial support for the research, authorship, and/or publication of this article.
Ethics approval
The Authors declare that all the research meets the ethical guidelines.