
Abstract
Drawing on the literature on visitor satisfaction, return likelihood, and customer segmentation, this study applies a Chi-square Automatic Identification Detector segmentation technique to segment European visitors on their likelihood to revisit selected Mediterranean sun-and-sand destinations. The Chi-square Automatic Identification Detector procedure distinguishes five segments in terms of return likelihood, with different levels of satisfaction according to the respondents’ repeat visit status, occupation, and country of residence. The findings are further discussed in the framework of the literature on return likelihood. Marketing implications and suggestions for Mediterranean sun-and-sand destination managers are also presented.
Keywords
Introduction
The Mediterranean region has emerged in the last decade as the world’s leading tourist destination, building on a unique combination of resources where land and sea environments meet—sun, water, beaches, scenic views, a rich biological diversity, seafood, and good transportation infrastructure (Erbina et al., 2010). Such resources have enabled Mediterranean destinations to offer various hospitality and tourism services, and a growing number of international vacationers (particularly Europeans) visit these destinations. Recent figures from the World Travel Organization indicate that 84% of tourists who visit the Mediterranean region—defined as the geographical area comprising 22 countries that share the common characteristic of bordering the Mediterranean sea, including European (e.g. Spain, Italy, France, Bulgaria, Croatia, Greece), North African (e.g. Morocco, Tunisia), and Middle Eastern countries (e.g. Egypt, Turkey)—come from northern and western Europe (UNWTO, 2008). Germany provides the largest number of visitors to the region, followed by the United Kingdom and France (European Commission, 2010).
Such Mediterranean destinations are currently characterized by high numbers of repeat visitors (Butler, 1980; Oppermann, 1998, 1999), suggesting that tourists return to the destination as a result of their satisfaction with their previous travel experience. Thus, a thorough understanding of the repeat visitation phenomenon in Mediterranean destinations is needed to help destination managers make better informed marketing decisions. Furthermore, since the majority of visitors to the region come from three main countries, an in-depth understanding of these market segments and the profile and characteristics of travelers from each segment is warranted.
This study applies a Chi-square Automatic Identification Detector (CHAID) segmentation technique to identify and profile particular customer segment groups of travelers to major Mediterranean sun-and-sand destinations based on their likelihood to return. In the majority of existing studies, intentions to perform a behavior have been used to predict actual revisit behaviors as directed by the theory of reasoned action (TRA) and the theory of planned behavior (TPB) (see Ajzen, 1991). These viewpoints explain behavioral intentions representing motivational components of a specific behavior, subsequently denoting the degree of conscious effort that a person will exert in order to perform that behavior (see Ajzen, 1991; Ajzen and Fishbein 1980). In other words, intention to perform a behavior is the proximal cause of such behavior (Shim et al., 2001). Additionally, some empirical studies have examined the relationship between behavioral intention and actual behavior (Quelette and Wood, 1998). Using meta-analytic techniques, Sheppard et al. (1988) reported a mean correlation of 0.53 between intention and behavior. Van Den Putte (1991) conducted a more extensive meta-analysis, resulting in a mean correlation of 0.62. Both the results indicate that behavior can be reasonably predicted from intention. Thus, it is generally agreed that understanding tourist behavioral intention is critical in predicting future behavior, and as such in this study, the intention to return of European travelers is used as a proxy of their actual behavior in the future. In particular, using the CHAID technique allows for the organization of cases according to a specified relationship to values of a dependent variable—whether the individual will return or not—so that the data will be organized into groups, based on a priori defined predictors with differing propensities to return.
This study aims to achieve two main objectives. First, it will identify segments of visitors more likely to revisit the Mediterranean in the future based on visitor demographics, trip characteristics, and country of origin (namely, Germans, French, and British). This will provide further understanding of the return behaviors of these three groups and should be of relevance to marketers and managers of Mediterranean sun-and-sand destinations, particularly given that these three countries represent the majority of the region’s market share. Second, this study will determine whether significant differences exist across the derived segments in terms of their satisfaction with their stay. This could explain whether repeat visitors return because they were satisfied with their previous visit (suggesting that basic components of a sun-and-sand product (the climate, beaches, accommodation, and setting) still play a key role in tourist satisfaction) or due to indifference and routine (i.e. a feeling of inertia). These results will further contribute to the general debate about whether a positive relationship between satisfaction and return intention can be deemed a reliable determinant of return behavior (Baker and Crompton, 2000; Kozak, 2001; Petrick et al., 2001; Yoon and Uysal, 2005; Yuksel, 2001).
Literature review
Satisfaction and repeat visitation
In both marketing and tourism literatures, repeat purchase and repeat visitation are often touted as desirable as they lead to reduced marketing costs (e.g. Haywood, 1989; Rosenberg and Czepiel, 1983). In addition, the link between repeat purchase and brand loyalty can reduce price sensitivity among customers and can be a way of guaranteeing a product’s continued quality (e.g. Keane, 1997; Reicheld and Sasse, 1990; Shapiro, 1983). From a destination perspective, repeat visitation indicates travelers’ satisfaction with the destination. Satisfied visitors are also more likely to spread positive word-of-mouth, which is one of the most sought information sources (Oppermann, 1999).
Previous studies have explored the relationships between satisfaction levels and intentions to revisit the destination. Although Oppermann (2000) states that studies on tourist satisfaction and destination loyalty have not been thoroughly investigated, in many studies, however, satisfaction is distinguished as an antecedent of revisits (Jang and Feng, 2007; Kozak, 2001); in particular, Chi and Qu (2008: 624) claim that “customer satisfaction has always been considered an essential business goal because it was assumed that satisfied customer would buy more.” In the specific case of a destination, satisfied customers would return to that destination. Moreover, in previous destination research (e.g. Oliver, 1997; Yoon and Uysal, 2005), tourist satisfaction has been measured through different means based on the expectation/disconfirmation paradigm (Oliver, 1980), equity theory (Oliver and Swan, 1989), norm models (LaTour and Peat, 1979), and perceived overall performance (Tse and Wilton, 1988).
According to the expectation/disconfirmation paradigm, consumers develop expectations about a product before purchase and compare actual performance to those expectations after purchase. If the actual performance is better than the expectation, positive disconfirmation (i.e. satisfaction) results; if the actual performance is worse than the expectation, negative disconfirmation (i.e. dissatisfaction) results. In the equity model developed by Oliver and Swan (1989), satisfaction occurs when customers receive more value than the value of what they actually spent in terms of price, time, and effort. Meanwhile, the norm theory by LaTour and Peat (1979) uses some form of “comparison standard,” through which consumers compare a product they have purchased with other products. For example, tourists can compare their current travel destinations with other destinations they have visited in the past. Finally, in the perceived performance model by Tse and Wilton (1988), consumer satisfaction is a function only of actual performance and is unrelated to consumer expectations. In other words, the model considers actual performance and initial expectations independently rather than comparing performance with experience. As such, this model is effective when tourists do not know what they want to enjoy and experience and do not have any knowledge about their destination circumstances, and only their actual experiences are evaluated to assess overall tourist satisfaction.
Nevertheless, although measuring tourist satisfaction is not simple, and the results vary across the different studies as just mentioned, several studies have established a positive relationship between tourists’ satisfaction and their intention to return (Assaker et al., 2011; Baker and Crompton, 2000; Bigné et al., 2005; Jang and Feng, 2007; Kozak, 2001; Petrick et al., 2001; Yoon and Uysal, 2005). In particular, Alegre and Cladera (2006), using a logit model, found that repeat visitors are more likely to return to the Balearic Island when previous visits were combined with a high level of satisfaction (interaction effect), thereby highlighting the need for destination managers to offer high-quality services to keep visitors returning. A more recent study by Alegre and Garau (2011) identified three types of factors that might impact the likelihood of visitors’ return to sun-and-sand destinations. These include (a) basic factors (those that prevent tourists from feeling dissatisfied), (b) performance factors (those that increase tourists satisfaction levels if fulfilled but reduce them if not), and (c) excitement factors (those that increase tourists’ satisfaction levels if fulfilled but do not cause satisfaction if they are not).
Research suggests, however, that satisfaction with a destination is not the sole reason why tourists revisit a destination. Other factors may influence their revisit, including (a) travelers’ feelings of inertia or indifference (i.e. tourists choose a destination simply based on routine; Odin et al., 2001; Woodside and MacDonald, 1994), (b) visitors’ attitudes toward risk aversion (i.e. the risk of a bad holiday can be avoided by choosing a familiar location; Mitchell and Greatorex, 1993), (c) a utilitarian attitude based on the criteria of cost (travelers keep returning because they want to avoid substitution costs associated with their switching behavior and searching for new destinations; Baker and Crompton, 2000; Bigné et al., 2009; Petrick, 2004), and (d) a compensatory attitude in which tourists revisit the same destination to satisfy the travel motivations that led them to visit in the first place (Alegre and Cladera, 2006; Jones et al., 2002).
This article proposes a set of segmentation predictor variables that are used to segment European travelers according to their likelihood to return to sun-and-sand destinations (namely, travel characteristics, demographics, and nationality/country of origin). This provides further insights into the profile and characteristics of the type(s) of visitors that such destinations may wish to attract (due to the benefits associated with these segments) and further verifying whether the return behavior of these different segments is driven by their positive experience (e.g. satisfaction) or by other causes (e.g. inertia/indifference, risk aversion, or utilitarian attitude), where perceived performance is used in this study as an appropriate approach to measure consumer satisfaction as well as positive experience due to the simplicity and advantages associated with this method, in which, as mentioned earlier, respondents need not have any previous knowledge about their destination circumstances, as this study considers both those who have visited previously and those who have not (Hursley and Estelami, 1998). Kozak and Rimmington (2000) cite various empirical and conceptual articles in which overall performance is utilized to reach customer satisfaction in the tourism industry. Therefore, this article will measure satisfaction through a single question on overall satisfaction based on the actual experience.
Studies on the relationship between traveler’s satisfaction and revisit intentions/future behaviors have achieved mixed results (see Castro et al., 2007; Mittal and Kamakura, 2001). Satisfaction itself is not a sole predictor of return intentions, and the personal characteristics of the tourist can have a moderating effect (see Decrop and Snelders, 2005; Yuksel and Yuksel, 2002). This article proposes a set of predictor variables that are used to segment European travelers according to their likelihood to return to sun-and-sand destinations.
Segmentation in travel research
Segmentation is based on the idea of dividing the market into groups, or segments, of people with similar purchasing behaviors. Indeed, travelers are not homogeneous in their preferences, wants, or needs (Levin and Zahavi, 2001). The concept of segmentation has been used to solve marketing problems as well as to address diverse managerial issues (Fredline and Faulkner, 2000). Walters (1997) stated that the heterogeneity of international markets necessitates tools that can assist marketers in identifying underlying patterns of similarity, which can provide a platform for global integration at the strategic and operational levels. In addition, market segmentation applications have had a long history in tourism research, where various segmentation techniques and methods have been introduced and tested in the tourism literature (Mazanec, 1994).
Because people have individualized needs, tastes, and attitudes as well as different life stages and lifestyles, no single variable can be used to segment travel markets (Andereck and Caldwell, 1994). Dimanche and Havitz (1994) argue that employing multiple variables helps pinpoint the best segmentation bases and yields greater explanatory power. In particular, travel and tourism marketers and researchers have widely used the general categories of geographic, demographic, or sociocultural factors as primary segmentation bases (Sung et al., 2001). The study of inbound international tourism expenditures in Canada by Hsieh et al. (1997) found that some trip-related characteristics (e.g. length of stay and size of the travel party) provided a new dimension to expenditure patterns associated with travelers’ behaviors. Sung et al. (2001) argued that the inclusion of trip-related characteristics (e.g. number of visits, trip duration, trip distance, travel party, purpose of trip, travel mode, expenditures, length of stay) can lead to comprehensive and meaningful results in understanding travelers’ behaviors.
In addition to demographic and trip characteristics variables, international tourism market segmentation studies have included one more crucial variable—country of origin or residence—in delineating travelers’ characteristics and behaviors (Hsu and Kang, 2007). For example, Oppermann (1995) reported significant differences between Australian and New Zealand travelers with regard to travel purpose and travel itinerary. Hsu and Kang (2003) explored perceptual and behavioral differences between Asian and Western family independent travelers (FITs) with perceptions of service quality, satisfaction, and intentions to revisit. Compared to Asian FITs, Western travelers were more likely to evaluate service quality favorably. Kim and Jogaratnam (2003) investigated travel activity preferences among Asian and domestic college students in the United States and found significant differences in terms of gender, age, source of income, length of stay, marital status, and travel group size. Yoo et al. (2004) in their study of Mainland Chinese and American visitors to Hong Kong found that culture and physical distances explained variations in trip characteristics.
Studies focusing on differences among European travelers are limited. Kozak (2002) found motivational differences between German and British tourists visiting Mallorca and Turkey in the summer of 1998. Similarly, Ramkissoon and Nunkoo (2008) found discrepancies in external information search behaviors among tourists from France, the United Kingdom, Germany, Italy, and Switzerland. Thus, individual/trip characteristics and country of origin are important bases for market segmentation (Walters, 1997). As a result, gender, age, occupation, travel party, previous visits, and nationality will be used in this study.
CHAID analysis
CHAID segmentation technique constitutes an a priori analysis technique (i.e. a criterion-based method or a predictive procedure; Chen, 2003a) that offers the unique advantage of splitting the data obtained in relation to predefined variables into subsets, where the subsets best describe the relationship between those predefined variables and the response variable or variable of interest (Kass, 1980; Koskela, 1999). Chen (2003b) argues that in comparison with noncriterion methods where interrelationships between a set of variables are used to group respondents into mutually exclusive segments where all variables are interdependent (i.e. dependent and independent variables are not distinguished (Wedel and Kamakura, 2000)), criterion-based techniques possess three unique advantages.
First, criterion-based or a priori methods (of which CHAID is the most prominent technique) are based on a set of variables that could significantly discriminate among segments. In contrast, in a noncriterion method, it is impossible to know whether all variables could significantly differentiate among the segments before their formation. Since the noncriterion-based approach uses a set of variables that may not be the significant descriptors explaining the segments, the resultant ones may not constitute an optimal homogeneity defined by the classifiers (Wedel and Kamakura, 2000). Often, to cross-validate these variables and determine whether they are capable of significantly describing the segments, a post hoc test using discriminate analysis is conducted.
Second, criterion-based techniques are able to determine which segment has a stronger relationship with the criterion of interest. Marketers may make use of this benefit to effectively develop their target market. For instance, when “intent to buy” or “intent to revisit” is introduced as a dependent variable (criterion), researchers could find out which underlying segment has the highest likelihood of buying.
Third, criterion-based techniques can accurately classify new cases (observations) into the resultant segments. In other words, they could assist marketing managers to envisage the segment membership when new cases are evaluated. Due to the shortcomings of noncriterion algorithms, past research findings based on noncriterion techniques supply little benefit to practitioners and marketing managers (Kotler, 1988). Criterion-based methods, however, are capable of generating specific segments reflecting the similarity of response to a set of descriptors (such as destination preferences) with respect to the criterion (for instance, willingness to revisit) chosen by researchers. Furthermore, the predictive methods explicitly screen out the relevant predictors (independent variables) that distinguish the segments of interest, so as to amplify the homogeneity of the partitioned sample groups that could be interpreted as exclusive segments in marketing practices.
As compared to other available criterion-based techniques (i.e. Quest and Classification and Regression Trees (CRTs)), the CHAID analysis offers a more comprehensive method as it is used when splits of more than two ways are desired (Huba, 2003). Moreover, the CHAID method is advised when attempting to detect patterns in large data sets that are composed of different levels of measurement. The CHAID method can handle independent and dependent variables at all levels of measurement. In other words, if a data set was composed of independent variables that were nominal, categorical, interval, and ratio, the CHAID decision tree analysis can include all of the variables in the analysis (Huba, 2003). These advantages of the CHAID analysis are appropriate in the specific case of our analysis.
According to Kass (1980), the CHAID analysis technique constitutes an a priori analysis technique (i.e. a criterion-based method or a predictive procedure; Chen, 2003a) aimed at developing predictive models, screening out extraneous predictor variables, and gathering an easy-to-read dendrogram that identifies mutually exclusive segments of a population with similar characteristics. During the development of the dendrogram, the researcher establishes a dependent or criterion variable significant for the issue under research. The most significant predictor or independent variables (i.e. those whose measurement categories support their best possible segmentation of the whole sample) are gradually traced using ordinary chi-square analysis. Eventually, a stepwise split approach to the dependent variable leads to the emergence of different segments with cases or subgroups of cases for the analysis (Magidson, 1994). In this case, the CHAID technique enables the researcher to trace discrete groups of respondents included in the total sample of the research. The split procedure ends at the node determined by the researcher according to the chi-square statistics with corresponding pairwise p values, which represent the probability of the observed relationship between independent and dependent variables occurring if the two variables are independent. If the resulting p value for the split is less than or equal to a level of significance (i.e. 0.01), the chi-square value is deemed large enough to accept the resulting split; thus, the process stops (Haughton and Oulabi, 1997).
Hsu and Kang (2007) argue that CHAID analysis remains underutilized in tourism studies, and researchers should consider applying CHAID to clearly identify market segments based on an a priori set of predictor variables. Chen (2003a) segmented college students’ spring break vacation decision making in terms of their loyalty behavior using a CHAID technique. He identified four segments based on destination characteristics: adventuresome, nice climate, different, and fascinating (the former two were termed actionable segments of interest, while the latter two were nonactionable). Subsequent comparisons between these two segments were based on a series of supplementary analyses, including chi-square, logit analysis, and analysis of variance (ANOVA). The findings concluded that CHAID is a useful tool to identify unique customer segment groups in travel and tourism research.
Chen (2003b) also employed a CHAID analysis to identify actionable segments based on one’s likelihood of making positive recommendations about a destination, profiling each segment using demographic and trip characteristics. Destination satisfaction, pricing, and prompt assistance were identified as three critical factors influencing respondents’ destination recommendation to others.
Hsu and Kang (2007) segmented inbound travelers to Hong Kong using a CHAID technique. They used seven predictors to derive market segments based on their likelihood of revisiting Hong Kong. The CHAID analysis successfully produced six segments based on respondents’ travel purpose, age, income, and repeat visit status. Each segment was then described according to trip characteristics and posttrip perceptions.
Vassiliadis (2008) used the CHAID procedure to segment English and German tourists to Greece in terms of their likelihood of return as well as recommendation to others. By using supply characteristics of the Greece tourist destination as predictor variables, they identified differences in return likelihood among the two nationality groups. The results help tourism managers to apprehend the characteristics of the destination products in terms of what factors are important for each group of visitors in deciding to return to the visited destinations. Mok and Iverson (2000) and Diaz-Perez et al. (2005) used CHAID to segment tourists to Guam and the Canary Islands, respectively, in terms of their travel expenditures. Both studies distinguished light and heavy users/spenders based on travelers’ demographic and socioeconomic characteristics.
CHAID segmentation techniques have also been successfully implemented in areas other than marketing. Byrd and Gustke (2007) examined 56 “tourism impact” statements derived from social representation theory, finding that the local population could be best segmented into 13 mutually exclusive clusters with different reactions toward support for tourism development in two eastern North Carolina counties. Byrd and Gustke (2011) used a CHAID analysis to profile stakeholders based on their participation in tourism and political activities in a community. The results indicated that numerous variables influence stakeholders’ participation in tourism and political activities including the respondents’ role in tourism (governmental official, resident, business owner, visitor), respondents’ perception of impacts, length of residency, general demographics (age and gender), and their level of participation in recreational activities (bird watching, hiking, fishing, and attending festivals).
Methodology
Research design and data collection
Relevant data for this research were derived from a questionnaire developed from a previous research on European travelers. The questionnaire was administered online by the Netetudes Market Research Group in February 2009 to French, English, and German travelers aged 18 years and older. Survey participants were randomly chosen from panels of respondents representing each country’s aggregate demographics. Although some have criticized the collection of data in origin countries, in the case of return intention, such a method presents some advantages. In addition to convenience, collecting data in origin countries allows us to achieve a high response rate and a large sample size, which is needed to successfully implement segmentation techniques within the data set (Huba, 2003).
Previous segmentation studies related to tourism have used a similar data collection approach (in origin destinations; e.g. Assaker et al., 2011; Chen, 2003a). The choice of travelers’ nationalities is supported by the fact that among all European travelers, French, English, and German individuals tend to travel the most outside their countries; thus, they represent information-rich cases, deliberating the most information from the limited number of cases sampled. A screening question at the start of the questionnaire ensured that only those respondents who had flown at least 2 h to visit a Mediterranean sun-and-sand destination within 7 months prior to the survey were included. Thus, this filter question aims to reduce bias related to extreme travel behaviors (caused by respondents visiting domestic destinations close to home; i.e. less than 2 h by car or other means of transportation, planes excluded), which might confuse the current analysis. Moreover, given the survey time frame (i.e. the month of February), 7 months represented the ideal time to visit that type of destination (i.e. dating back to July); thus, this timing was designed to help improve response rates.
In total, 1268 questionnaires were delivered to generate a final sample of 945 usable surveys (315 from each nationality), resulting in a response rate of 75%. The number of responses used for this study is similar to previous CHAID segmentation studies related to tourism (Chen, 2003a, 2003b; Hsu and Kang, 2007; Vassiliadis, 2008) in which the sample size considered for these studies ranged from 695 to 1981 based on the different data collection methods considered in these studies (collection on site (Chen, 2003a) or at origin (Hsu and Kang, 2007)).
The number of responses is also enough to accommodate the effect of the independent variables (six independent variables in this case, as discussed in the following) in explaining the dependent variable (return intention) in the specific case of this study. The constraint on the size is further explained in the “Data analysis” section. In addition to country of residence, the study collected various traveler information, including gender, age, occupation, and trip characteristics such as travel party and repeat visit status (i.e. first time vs. repeat). Satisfaction was operationalized using a single variable: “How would you describe your overall satisfaction with your stay in that destination?” on a scale of 1−7 (1 = very unsatisfactory, 7 = very satisfactory). The decision to use a single-item measure of satisfaction is consistent with previous studies (see Anderson, 1994; Bigné et al., 2005; Bolton and Lemon, 1999; Fornell et al., 1996; Tse and Wilton, 1988). Likelihood to return was also measured using a single question: “How likely are you to return to that destination?” using the same 1−7 scale. Similarly, a single-item rating scale for return likelihood is commonly used (see Alegre and Cladera, 2006; Castro et al., 2007; Hsu and Kang, 2007).
Prior to being administered, the questionnaire items were revised based on feedback from a pilot sample of 30 postgraduate students studying at a major European business school. This step helped refine the content of the questionnaire items for clarity, reliability, and consistency in the context of the initial research to which the questionnaire was aimed. A few changes were made to the wording of the sentences of the final survey.
Data analysis
To derive market segments based on the predictor(s) that had the highest effect on respondents’ likelihood of return, we used the CHAID procedure based on the Classification Tree in SPSS 17.0 to analyze the data. The dependent variable, return likelihood, was recorded into two categories (category 1 = not likely to return and category 2 = likely to return). Respondents who indicated 6 (likely) or 7 (very likely) on the return likelihood scale in the questionnaire were classified as “likely to return,” while those who indicated 1–5 were coded as “less likely to return.” A similar procedure was used by Hsu and Kang (2007) who recoded likelihood of return to Hong Kong. Using the “likely to return” category as the target category for this analysis allowed for a gains-related table and other outputs to be produced.
Van Middelkoop et al. (2003) recommended that a CHAID-based algorithm requires a substantive data set with approximately 150–200 observations per predictor variable. This recommendation was followed to determine the number of predictors entered into the analysis program. With 945 cases in the data set, a maximum of six independent variables (948 observations ÷ 6 variables = 157.5 cases) could be accommodated. Therefore, the six most commonly used traveler segmentation variables (country of residence, travel party, repeat visit status, gender, and occupation as monotonic variables and age as a scale variable) were selected as predictors. The significance level for combining predictor categories and the alpha significance level for predictor eligibility for splitting nodes was set at 5% (Magidson, 1994). The Bonferroni correction procedure was further applied in the calculation of previous significance values for the merging and splitting criteria. This allows for the adjustment of the number of categories and chance capitalization (in further splitting the data; Quinlan, 1987).
The stopping criteria were determined at a minimum size of 200 observations for parent nodes (before the division of the (sub)sample) and 100 for child nodes (after division of the (sub)sample; SPSS, 2008). Moreover, the maximum tree depth (i.e. the number of allowed cuts) was set to three levels beneath the root node (the default level proposed by SPSS). Thus, the default level for the stopping criteria and tree depth was used for two reasons: (a) to keep the tree simple, so that interpretable results can emerge and (2) to ensure sustainability of the segments—namely, to derive segments where the size of each segment is large enough to be of use (Kotler et al., 2003). Table 1 summarizes the variables used for the CHAID analysis with category codes and their descriptions. The analysis proceeded with a series of chi-square analyses employed to derive the final segments in terms of the predictor variables. In addition, the ANOVA was accompanied by Games–Howell post hoc tests to further explore the differences among derived segments in terms of satisfaction with their stay at the destination.
Variables used in CHAID analysis
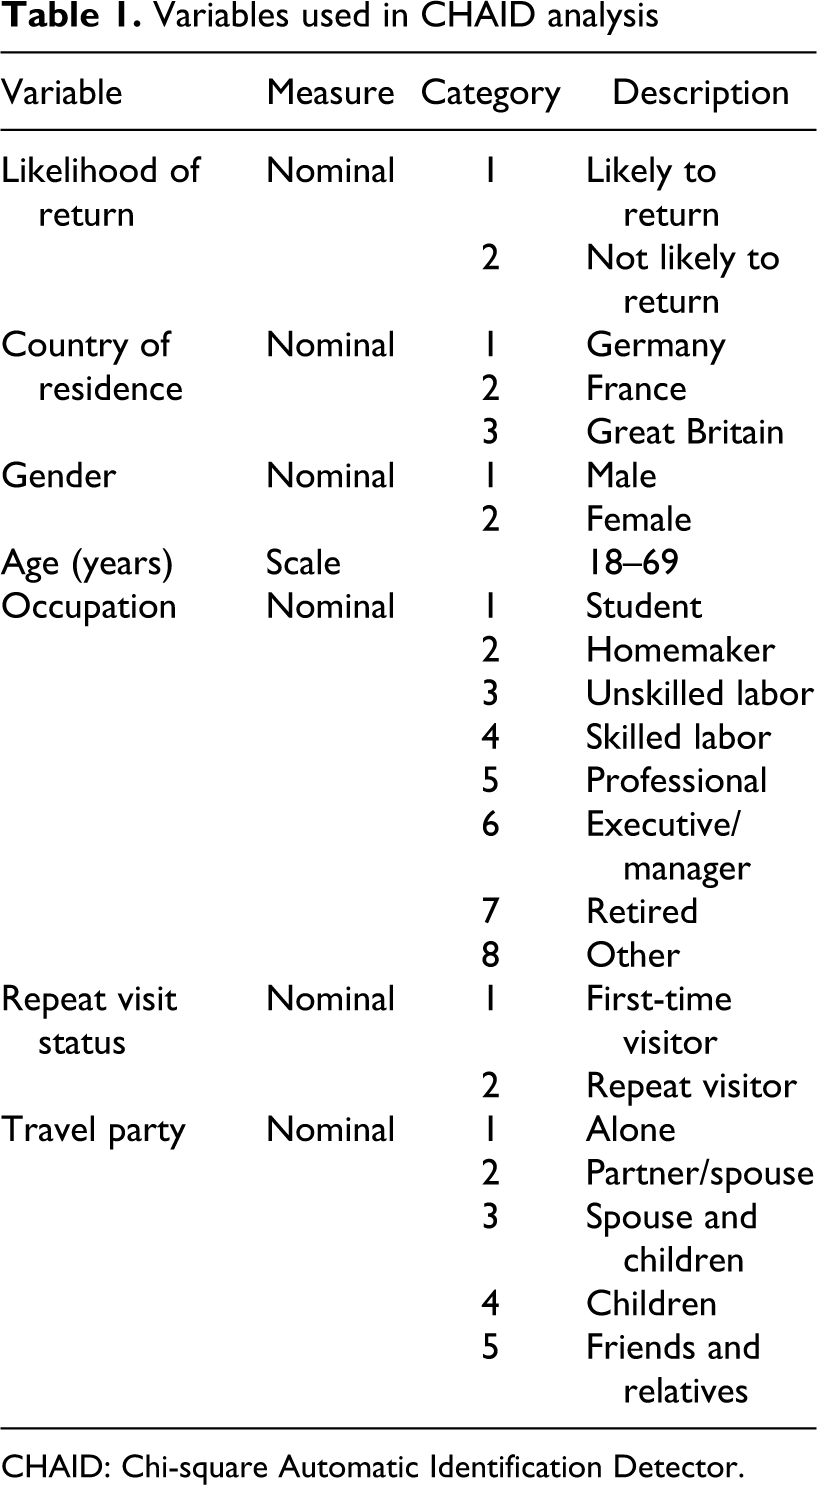
CHAID: Chi-square Automatic Identification Detector.
Results
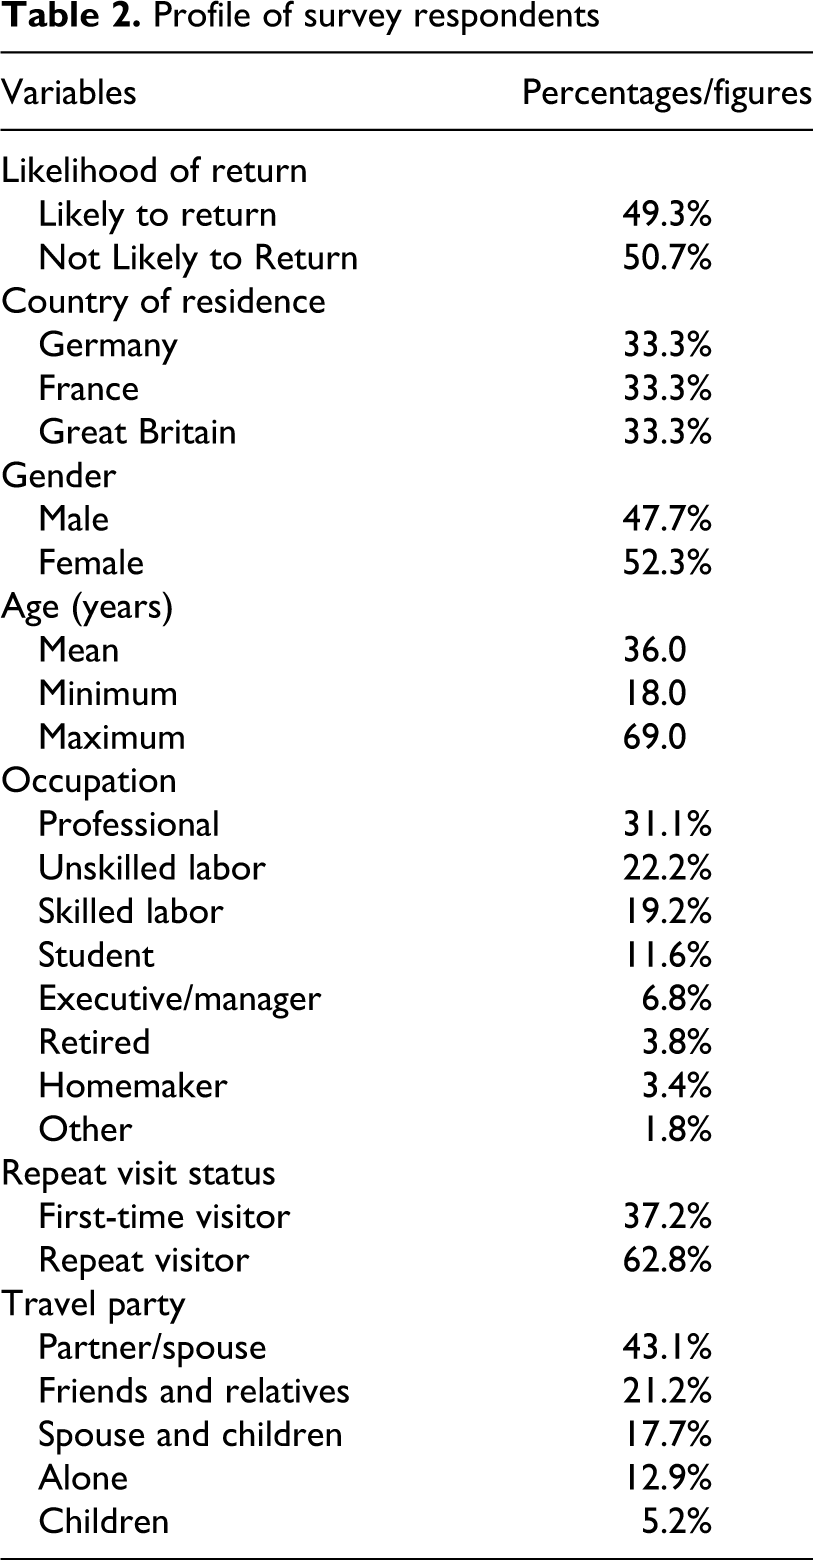
Table 2 presents the descriptive summary of respondents. The mean age of respondents was 36, and there was an equal representation of males (47.7%) and females (52.3%). Nearly two-thirds (66%) of respondents traveled with a partner/spouse or children or with spouse and children; this is typical for this type of destination (LaMondia et al., 2010). Over 21% respondents traveled with friends or relatives and only 12.9% traveled alone. Professionals were the largest group in the sample (31.1%) followed by skilled workers (22.2%), unskilled workers (19.2%), and students (16%). These results are similar to those from previous studies on travelers (see Bigné et al., 2005; Vassiliadis, 2008). Almost 63% of respondents were repeat visitors; this is common for this type of destination (Alegre and Cladera, 2006; Alegre and Garau, 2011). Finally, almost half of the respondents were categorized as the “likely to return” group.
Profile of survey respondents
CHAID segments
The results of the CHAID analysis revealed that respondents could be divided into five subgroups (see Figure 1 and Table 3). Three variables—previous visits, occupation, and country of residence—emerged as the descriptors splitting the nodes. The first split was based on the variable of previous visits (χ2 = 111.838, df = 1, p = 0.000), resulting in nodes 1 and 2, representing respondents who have not visited the destination on previous occasions and those who have, respectively. Furthermore, 27% of those who have not previously visited the destination (node 1) are likely to return, whereas those who have previously visited the destination (node 2; 62.6%) are likely to return. In addition, within node 1 (those who had not previously visited the destination), the second split (corresponding to nodes 3 and 4) is attributed to the variable “country of origin” (χ2 = 5.762, df = 1, p = 0.049), where 20% of German respondents (node 3) are likely to return to the destination selected, while 31.6% of French and British respondents (node 4) are likely to return. On the other hand, under node 2 (those who had previously visited the destination), the variable of occupation triggered the second split leading to nodes 5 and 6 (χ2 = 18.470, df = 1, p = 0.002).

Distinguishable segments based on likelihood of return by CHAID.
Node 5, comprising executives/managers, professionals, homemakers, and others, was further diverged into two smaller nodes (nodes 7 and 8) according to the country of origin (χ2 = 11.045, df = 1, p = 0.003). Node 7 comprised German travelers, who indicated a 60% likelihood to return, while node 8 comprised French and British respondents, who indicated a 77.7% likelihood to return. Finally, skilled workers, unskilled workers, and students (node 6) reported a 53.7% likelihood to return to the selected destination.
The CHAID analysis identified five distinguishable segments. Segment 1 (corresponding to node 3) was characterized as German travelers who visited the destination for the first time. Respondents in segment 2 (corresponding to node 4) were French and British travelers who visited the destination for the first time. Segment 3 (node 7) comprised German executives/managers, professionals, homemakers, and others who had visited the destination on a previous occasion(s). Those in segment 4 (node 8) were French and British executives/managers, professionals, homemakers, and others who had visited the destination on previous occasions. Finally, segment 5 (node 6) consisted of skilled workers, unskilled workers, and students who had previously visited the selected destination. The resulting five segments were subsequently ranked according to their index scores, referencing the likely-to-return rate of each segment in relation to the overall likely-to-return rate (49.3%). In other words, the higher the index score, the more likely that respondents in the segment would return to the selected destination (see Table 3). Consequently, segments 4, 3, and 5 (corresponding to nodes 8, 7, and 6, respectively) had the highest likelihood of returning among the pool of respondents, with index scores of 157.5%, 121.7%, and 108.9%, respectively.
Gain results and index score from the CHAID procedure
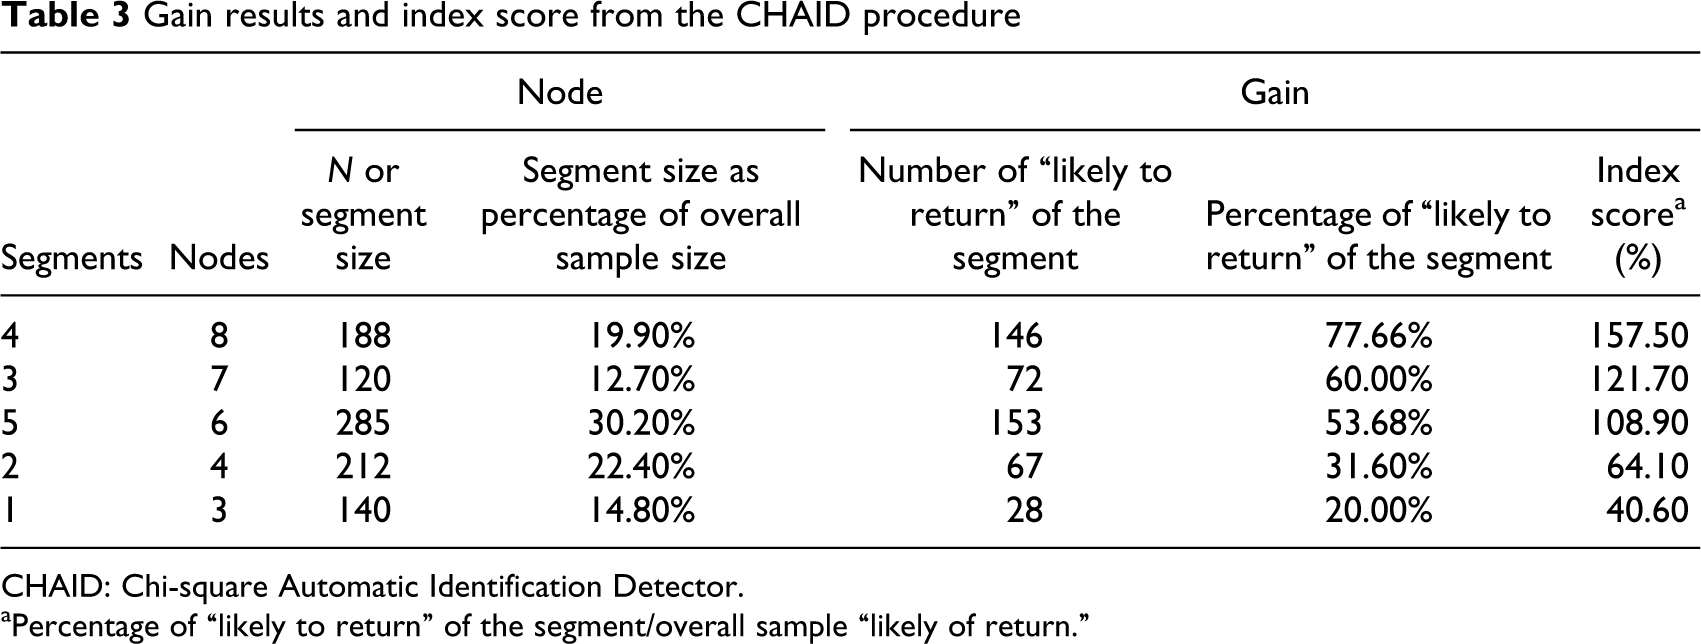
CHAID: Chi-square Automatic Identification Detector.
aPercentage of “likely to return” of the segment/overall sample “likely of return.”
The misclassification rate of the present CHAID procedure is 33.5% (Table 4); thus, the model correctly classifies approximately 66.5% of the respondents. Examining the classification table results in detail reveals that the model correctly predicts 80% of those who actually return, which is consistent with the risk estimation for this kind of analysis (Bozdogan, 2004).
The misclassification table results from the CHAID procedure
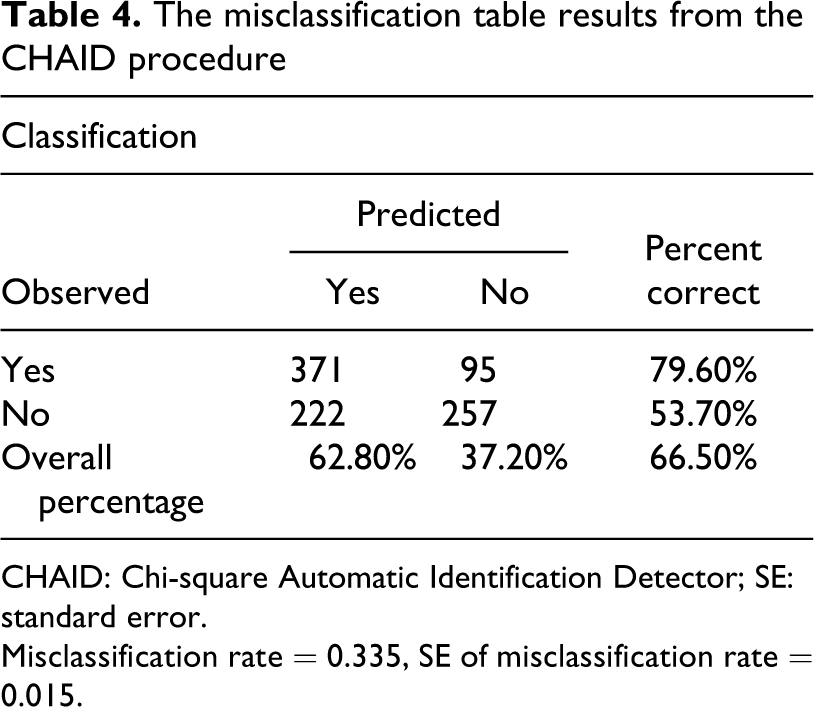
CHAID: Chi-square Automatic Identification Detector; SE: standard error.
Misclassification rate = 0.335, SE of misclassification rate = 0.015.
ANOVA results
An ANOVA analysis was conducted to examine the level of satisfaction with the destination selected across the five previously derived segments. The results of the Levene’s test demonstrated that equality of variance could not be assumed (F = 6.091, df = 4, p = 0.000). The Games–Howell post hoc test for unequal variances was subsequently used to compare differences in satisfaction levels across the five groups. The Games–Howell test is recommended when variances are unequal across groups; it also takes into account unequal group sizes (Ananda and Weerahandi, 1997). The results of the Games–Howell ANOVA test indicated that the five segments differed significantly on their satisfaction level (see Table 5). In particular, segments 1 (first time, German) and 3 (returning, German executives, professionals, homemakers, and others) rated their experience as the least satisfactory based on the aggregate means by segment (see Table 5). These segments were closely followed by segment 5 (returning, skilled workers, unskilled workers, and students). Meanwhile, respondents in segment 2 (first time, French and British) and segment 4 (returning, French and British executives, professionals, homemakers, and students) showed the highest satisfaction with the visited destination.
Differences in satisfaction level among the five derived segments
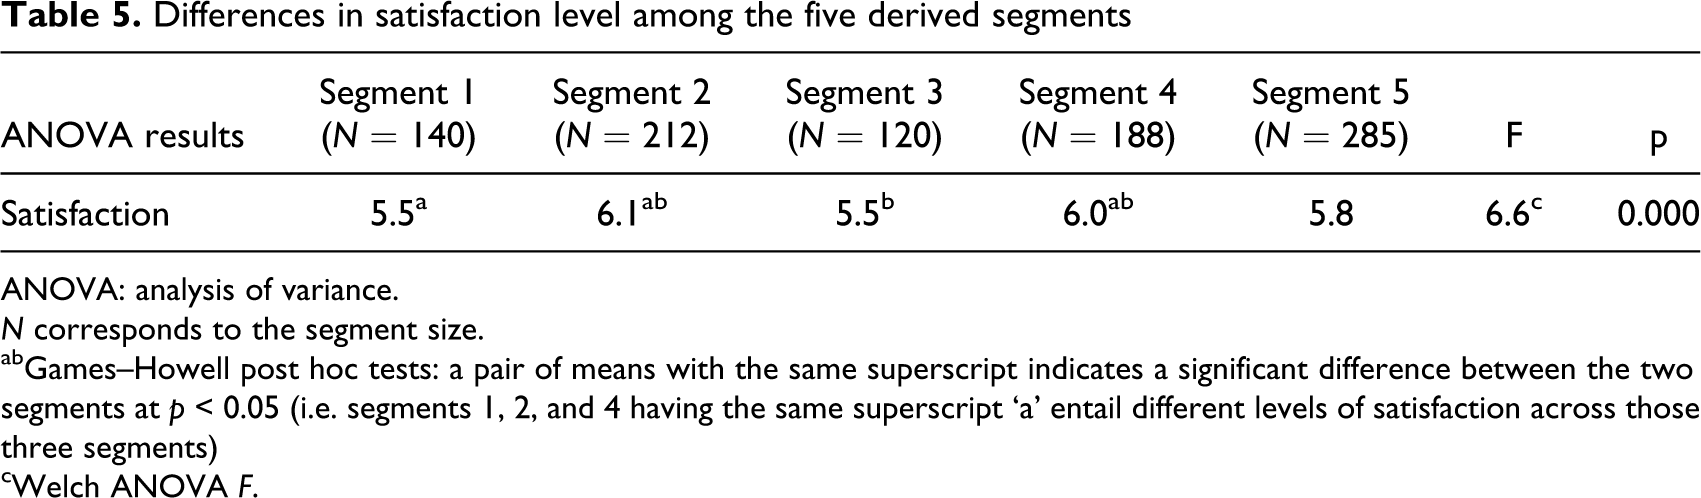
ANOVA: analysis of variance.
N corresponds to the segment size.
abGames–Howell post hoc tests: a pair of means with the same superscript indicates a significant difference between the two segments at p < 0.05 (i.e. segments 1, 2, and 4 having the same superscript ‘a’ entail different levels of satisfaction across those three segments)
cWelch ANOVA F.
Interestingly, the present results demonstrate that—even when satisfied with the destination (segment 2)—some visitors may not return to that same destination. On the other hand, even when not really satisfied (segment 3), some visitors might return. These results suggest that satisfaction with the destination may not be used in the absolute as a surrogate assessment of the likelihood to return, although a positive relationship between satisfaction and return intention has been repeatedly reported in the tourism literature (Baker and Crompton, 2000; Kozak, 2001; Petrick et al., 2001; Yoon and Uysal, 2005; Yuksel, 2001).
Discussion, conclusion and implications
This study applied a CHAID segmentation technique to identify and profile particular customer segment groups of travelers to major Mediterranean sun-and-sand destinations based on their likelihood to return. By combining three types of variables—demographics, travel characteristics, and country of origin—as an a priori segmentation base, this study generated distinguishable market segments among European travelers with a distinctive level of satisfaction. Five segments emerged from the analysis based on whether respondents had previously visited the selected destination as well as their occupation and country of residence. In particular, repeat visitors were more likely to return to the destination than first timers were. However, this probability also depends on respondents’ occupation, especially returners (professionals, executives, homemakers, and others showed a higher likelihood of return), as well as country of residence, with French and British tourists showing a higher likelihood of return as both repeat and first-time visitors.
Although segmentation research has proliferated in the marketing field, developing effective segmentation strategies (in terms of product design, service delivery, and promotional campaign planning (e.g. Jang et al., 2004; Kim and Jogaratnam, 2003; Suh and Gartner, 2004)), and the use of criterion-based segmentation (CHAID in particular) remains limited in tourism research. Given the advantages associated with CHAID (such as generating specific segments reflecting similarity of response to a set of descriptors and detecting patterns in large data sets that are composed of different levels of measurement, such as nominal, categorical, interval, and ratio), CHAID segmentation provides tourism managers with vital information with regard to channeling valuable resources toward consumers most likely to purchase, while avoiding expenditures on those unlikely to visit and/or have already decided to visit.
These results highlight important findings. First, they discriminate among European travelers in terms of their likelihood to return, suggesting that French and British tourists are less likely to be novelty seekers than Germans. This could also reflect an attitude of risk aversion on behalf of French and British travelers, in which—given the typical uncertainty that the consumption of services involved—the risk of a bad holiday can be avoided by choosing a familiar location (Mitchell and Greatorex, 1993).
Second, these results highlight the importance of European travelers’ financial considerations when they decide to travel away from home. Respondents with low-paying jobs and students indicated a lesser likelihood to return, concurring with existing tourism literature (Lam and Hsu, 2004, 2006) that travelers’ behavioral intentions do not always lead to actual behavior due to their financial constraints. Such circumstantial limitations are called behavioral control beliefs (Ajzen, 1985).
Third, this study’s findings confirm the feelings of “inertia” among European travelers, where the choice of a travel destination is based on routine (Odin et al., 2001; Woodside and MacDonald, 1994). Indeed, previous research has revealed that repeat customers are more likely to repurchase a product or service in the future (Sonmez and Graefe, 1998) and the more behaviorally loyal current visitors are, the more likely they will revisit a destination due to indifference and routine (Oppermann, 1998, 1999; Petrick et al., 2001).
These results further demonstrate significant differences among derived segments in terms of their satisfaction with the visited destination. In particular, German travelers indicated the lowest level of satisfaction, while French and British showed the highest level, suggesting cross-cultural differences among European travelers and different levels of expectations. This is consistent with previous studies that have found differences among European travelers in terms of expectations of destination offerings (see Kozak, 2002).
Although previous studies have identified a positive relationship between satisfaction and return intentions (Baker and Crompton, 2000; Kozak, 2001; Petrick et al., 2001; Yoon and Uysal, 2005; Yuksel, 2001), this research found that, even when a tourist is satisfied with a destination, he or she will not necessarily visit the same destination again. Therefore, satisfaction alone may not be enough to predict repurchase intentions (Oliver, 1999). Moreover, some visitors who reported low levels of satisfaction may still return for various reasons including (a) switching barriers (additional costs incurred that make it difficult for the customer/traveler to switch to another supplier/destination; Bigné et al., 2009; Fornell, 1992); (b) discrepancies in cultural characteristics of travelers, with travelers whose main preferences included novelty or change not being interested in revisiting (Alegre and Juaneda, 2006; Castro et al., 2007); and (c) lack of substitutes, where dissatisfied travelers may continue with the same provider if they expect nothing better from competitors (whereas satisfied customers may wish to change providers in search of a more satisfactory experience; Bigné et al., 2000).
Many hospitality and tourism services have followed up with their customers by solely evaluating postvisit (consumption) satisfaction to gauge whether they will generate future patronage. As such, the results from this study demonstrate that conclusions based on satisfaction may provide misleading information on target markets’ behavioral intentions. This may lead to developing inaccurate forecasts of future demand (Hsu and Kang, 2003). Destination managers should interpret visitors’ satisfaction levels cautiously. They should also seek to understand additional criteria (e.g. cultural characteristics, competition) by which the tourists decide to return to a destination.
Several managerial implications can also be derived from this study. The main focus of Mediterranean sun-and-sand destination marketers should be on repeat travelers who might be bound by some financial constraints (segment 5), who indicated a good level of satisfaction and acceptable likelihood of return (53.75%), yet some price sensitivity. Marketers could further enhance visits from this segment by offering low-priced packages for these travelers. This also requires communicating with these travelers about the various services available in acceptable price ranges, thereby eroding the financial barriers preventing these travelers from returning more often. Mediterranean sun-and-sand marketers can also do a better job of understanding travelers’ motivations, preferences, and expectations, particularly for German travelers. Further research on these travelers could be helpful in developing new activities and products to render the destination more appealing for this category of visitors in order to boost their likelihood of revisiting.
Finally, although French and British travelers show the highest level of satisfaction (among executives, professionals, homemakers, and others) and the highest likelihood of return, destination marketers must focus on guaranteeing a consistent quality of essential aspects of their holiday setting (scenery, beaches, accommodation, transportation, etc.). Given that a tourism destination is an amalgam of factors/actors blending together to form the tourist “experience,” destination managers need to cooperate and coordinate such factors/actors to produce a consistent tourism experience that results in steady overall visitor satisfaction levels.
Limitations and further research
Due to sample size restraints, the segments emerging from the CHAID procedure could not be cross-validated. In addition, this study used only selected demographic and travel characteristics (as data came from a previously administered questionnaire). Future research could incorporate variables excluded in this study to generate a more comprehensive understanding of the topic as well as validate and compare these findings.
Moreover, the dependent variable (likelihood to return) used in the CHAID model refers to a specific type of destination (i.e. Mediterranean sun and sand). Future studies should consider European travelers’ likelihood to return to other types of destinations (e.g. urban, winter, cultural) to generate a more comprehensive understanding of their behaviors and compare these results. Future studies should use longitudinal data to further confirm the present findings and determine whether the characteristics and behaviors of European travelers are maintained over time.
Finally, as mentioned at the beginning of this article, this study uses a cross-sectional data set in which intention to revisit is used as a proxy for the actual return behavior. In future studies, a longitudinal collection of data can be used by following up on surveyed respondents/travelers over time to check whether there are major discrepancies between the categories of those who claim they are likely to return and the categories of those who will return. Doing so could provide a significant benefit to the findings of this article.
Footnotes
This research received no specific grant from any funding agency in the public, commercial, or not-for-profit sectors.