
Abstract
Destinations often seek to attract big sporting events with the assumption these event participants will engage in additional tourism opportunities. Potential destination attributes were explored with endurance athletes—specifically runners, triathletes, and cyclists—to determine how their interests and intent to travel to destination races are piqued. Seven elements were examined using conjoint analysis: trip price, nightlife, typical group tours, unguided tours, destination location, shopping, and entertainment. Cluster analysis identified three segments: partiers, explores, and escapists. All groups were found to be highly price sensitive; however, differences between the groups were present.
Keywords
Introduction
The growth of the sport tourism industry over the past few decades is well documented (Hinch and Higham, 2011; Hritz and Ross, 2010), and in order to be competitive in a growing marketplace, destinations should assess and manage their attractiveness (Mikulić et al., 2016). Some suggest that sport may contribute to the construction of a country’s brand and provide the host community with a unique advantage (e.g. Xing and Chalip, 2006; Zhang and Zhao, 2009). In turn, the enhanced destination brand may increase the level of international tourism, business, and investments to the host country (Horne and Manzenreiter, 2006; White and Absher, 2013). However, to capitalize on this growth and enhance the potential benefits, there is a need to develop a better understanding of why individuals select various sport events and destinations (Hemmatinezhad et al., 2010; Kaplanidou and Gibson, 2010; Kim and Chalip, 2010). Furthermore, this should stem from a methodology in which we address the issues of how the destination can leverage sport tourism to generate a positive impact on the host community (Chalip and Costa, 2005).
Green (2001) outlined how the marketing strategies and tactics for sport events should align with the consumers’ (e.g. spectators, participants and tourists) values, beliefs, and preferences that identify subcultures within the sport enthusiasts. And once the subcultures are identified, sport event and destination marketers should work in accord to provide sport consumers with a more desirable destination choice by leveraging event and destination attributes together (Harrison-Hill and Chalip, 2006). For instance, evidence from the running (Chalip and McGuirty, 2004), scuba diving (Asafu-Adjaye and Tapsuwan, 2007), mountain climbing (Stevens, 2005), and rock climbing (Attarian, 2002; Mittelstaedt, 1997) communities supports the influential role the destination may have on consumers’ selection preferences. Additionally, Buning and Gibson (2016) found that whom the athlete travels with could impact how the sport tourist interacts with the destination. However, beyond the destination’s quality sporting experience, scant research is available evaluating how both the destination attributes, like entertainment and accommodation, and the event attributes, such as history, longevity, and course challenge, impact active sport tourism intentions.
Segmentation is one strategy that may be effective for sport event and destination marketing organizations to improve leveraging strategies. A sound segmentation strategy allows for product development and marketing strategies to be better aligned with the consumers’ demands (Smith, 1956). Research in marketing and sport alike have identified common segmentation themes: packaging and programming (Choi and Tsang, 2008; Kim and Chalip, 2010), positioning (Kotler and Keller, 2012; Moutinho, 2000) and targeting (Kotler and Keller, 2012; Uzama, 2012). Focusing on sport tourism, Kim and Chalip (2010) identified segments within participants and spectators of a Tae Kwon Do event. They found differences in purchasing behavior, as well as selection preferences among a number of subculture characters (e.g. age, skill and level of involvement). The following will explore the literature and the aims of the current study.
Literature review
Active sport event participation
The current study explores the destination choices of runners, cyclists and triathletes. Runners are defined as athletes who participate in varied-length foot races, including the 5km, 10km, half-marathon, and marathon distances. Cyclists are defined as athletes who participate in varied-length events on a bicycle, which may include criteriums (or crits, several laps on a closed circuit), endurance rides (single-day event with multiple distance options) or stages (distances vary over multiple days). The triathlete is defined as an athlete who participates in varied-length events that include swim, bike, and run. Triathlon has numerous length options including mini sprint, sprint, Olympic, half-Ironman, and Ironman distances.
Market segmentation
Market segmentation is a valuable tool for developing both marketing and managerial strategies for sport and tourism organizations. Segmentation provides managers and marketers alike with a strategy to meet the demands of the consumers through purposeful designed events, marketing materials, and ancillary items, which may attract different consumers to the destination (Middleton et al., 2009). Furthermore, several researchers have suggested that a competitive advantage is engendered through proper market segmentation (Cha et al., 1995; Kastenholz et al., 1999).
Tkaczynski et al.’s (2009) review of the tourism literature found a large focus on geographic, demographic, psychographic, and behavioral segmentations and how these areas drive demand for various tourism products. Examining motivations is also a common method used in the literature to segment tourists (e.g. Baloglu and Uysal, 1996; Kim and Lee, 2002; Ritchie et al., 2010; Tkaczynski et al., 2010). While there is no single model for the application of demographics, the literature supports its usefulness in predicting tourism behavior (Hennessey et al., 2008; Kim and Chalip, 2010; Tkaczynski et al., 2009). The following will be a review of the psychographic (i.e. pull factors associated with the event and destinations), demographics (i.e. age, gender, ethnicity, and social class), and behavioral dimensions (i.e. athlete type and ability).
Psychographics
Event elements
Aicher and Brenner (2015) argued that organizational elements associated with an event might engender a form of controlled (i.e. extrinsic or pull) motivation for participants when selecting an event. Pull factors drive tourists to choose destinations based on the attractiveness of the location, physical landscapes, challenge of the event, and the event image (Crompton, 1979; Dann, 1981; Kaplanidou, 2010). The event’s image and reputation is potentially stronger, and of more interest to the athlete, than the reputation of the destination (Hallmann and Breuer, 2010; Kaplanidou and Vogt, 2007), and provides a strong pull factor for the choice of the destination. In terms of the organizational elements, these may include the services provided by the organization, such as logistics, security, huge event, baggage pickup, expo, timing, and sponsorship (Hallmann et al., 2010), amenities and services provided to sport tourists (Kurtzman and Zauhar, 2005), a well-organized and challenging course, as well as accessible information about the event (Getz and McConnell, 2011). Ryan and Lockyer (2002) established that the organizational aspects of an event (i.e. signage, competent officiating, punctuality in event start time, and efficiency of the event) were the most important selection or pull factors among Master’s Games participants, as well as treating competitors as serious athletes (Trauer et al., 2003).
Destination elements
Kaplanidou and Vogt (2007) defined destination image as the scenery, new places, experiencing new culture, the best location in the area, and other pull factors directly related to the host destination, including entertainment. These elements may enhance individuals’ motivations to select a destination (Aicher and Brenner, 2015; Yoon and Uysal, 2005) and are comprised of several important factors. For instance, the accessibility of the destination (Bourdeau et al., 2002; Getz, 1997; Teigland, 1999), transportation to a destination (Hinch and Higham, 2011), the quality of the accommodations (Hallman et al., 2010; Shonk and Chelladurai, 2008), and entertainment options (Shonk and Chelladurai, 2008) were all found to be important factors that individuals evaluate when selecting their sporting destinations. Novelty of the destination also plays an important role in selection (Bello and Etzel, 1985; Kaplanidou and Gibson, 2010; Lee and Crompton, 1992; Wahlers and Etzel, 1985), which strengthens the need for sport event and destination marketing organizations to work together to properly leverage the event and destination elements. In doing so, they may increase repeat visitation among participants (Kaplanidou and Gibson, 2010), as well as enhance the reputation of the event (Kaplanidou, 2010) and/or destination (Taks et al., 2009) to attract new participants.
Demographics
For most studies exploring demographic characteristics, it is common to include age, gender, ethnicity, and a proxy for social class: income and education. Each of these variables is briefly discussed below.
Age
Behavioral sciences have established that age influences wants and needs throughout the lifespan (Levinson, 1986; Levinson and Crumpler, 1996; Sigelman and Rider, 2009). There is a great deal of work that explores how sport participation changes across the lifespan as well (Dionigi, 2005, 2006; Gibson and Chang, 2012; Hirvensalo and Lintunen, 2011; Iso-Ahola et al., 1994; Kim and Chalip, 2010), but much of it focuses on leisure participation trends and does not discuss marketing implications. For the purpose of this study, age is used as means to explore how wants and needs evolve through the individual’s lifespan.
Gender
Sport and tourism research has established that socialization into sport has impacted the participation levels of males and females (Messner, 2007; Pritchard et al., 2007) and established that sport tourists, specifically, are most likely male (Gibson, 1998). This is further supported in the sports under investigation. For example, in running, women participate more than men overall; however, men are more likely to participate in longer distance events compared to women in running (Running USA, 2015); while high levels of participation (more than 25 rides in 1 year) are equal among the percentage of men and women (Breakaway, 2015). Since 2000, the percentage of females participating in triathlons has increased to 37% with no differences were reported based on distance of the event (USA Triathlon, 2014). These statistics and previous research indicate that differences may exist between genders.
Ethnicity
Similar to gender, a plethora of research evaluating the different consumption levels of sport and tourism has occurred. Philipp (1999) and others (Floyd and Shinew, 1999; Phillipp and Brezina, 2003; Shinew et al., 2004) argued that discrimination, socialization, and history impact consumption of different sports. While not available in participation reports, the disparity of consumption based on race received some attention in the literature. For example, Running USA (2015) reported 88.1% of runners were Caucasian, while participation rates among the different ethnicities are more balanced in cycling (Breakaway, 2015).
Social class
Kim and Chalip (2010) suggested that the two most commonly used proxies for social class in terms of segmentation are education and income. Research established that income impacts sport participation, and in particular, among sport tourists (Kim et al., 2007). Running USA (2015) reported that runners are very well educated (73% earned at least a Bachelor’s degree) with a large percentage of a single income over US$75,000. Alternatively, Breakaway (2015) did not indicate the differences in the percentage of participants based on income or education in the cycling community. Evaluating triathletes, Tkaczynski et al. (2010) found that wealthier participants sought event destinations based on the ability rest and relax or the weather, while lower income participants preferred novelty and recommendations from their peers. In the latter case, these data did not discriminate between those who commute and those who participate in sport. Furthermore, given the cost to participate in cycling and triathlon events because of the equipment needed to participate, it is likely these sports may see greater disparity among social classes. Therefore, differences are expected to occur among income and education levels.
Behaviors
The sport type, skill level, hours trained, and race length are key behavioral variables used to further understand and differentiate participants’ consumer behaviors. Each athlete type (i.e. runner, cyclist, and triathlete) has experienced considerable growth over the last decade (Running USA, 2015; USA Cycling, 2014; USA Triathlon, 2015). This has led researchers to explore various consumer behaviors associated with their participation such as motivation (e.g. Aicher et al., 2015), constraints (e.g. Hambrick et al., 2013), involvement (e.g. Ridinger et al., 2012), and commitment (Funk et al., 2011). While the different athlete types may share similar characteristics both within their sport and compared to the different sports, researchers largely agree in the heterogeneous nature of sport tourists (Park and Yoon, 2009; Tkaczynski et al., 2009). Additionally, researchers evaluating tourism motivations have established that the motivations for travel is a multidimensional construct as athletes select their destination for a variety of reasons (Dolnicar, 2008; Fodness, 1994; Kim et al., 2003). Researchers have controlled for hours trained, skill level (Newland et al., 2012; Ridinger et al., 2011) and race length (Aicher et al., 2015; Newland and Aicher, 2017) to determine their consumer behaviors. However, these variables have not been tested independently.
Research questions
Building on this line of research, the current investigation centers on the exploration of how destination and event elements influence destination choices among endurance sport athletes in the sports of triathlon, running, and cycling. The following research questions drive this investigation: (a) How do endurance athletes segment based on interest in sport tourism products? (b) What describes those segments—that is, What is the relationship between segments and demographic and behavioral measures? and (c) To what extent do demographics influence intent to travel to a destination? These questions will provide sport event and destination marketing organizations a stronger method of designing sporting opportunities and tourist destinations, as well as augment the strategies they employ to market the events and destinations. The results of this study, then, will add to the current literature and understanding of how different sport tourists segment and how the different segments make travel decisions.
Method
Procedure
Over 5000 emails were sent to endurance athletes in the United States competing in running, cycling, and triathlon events. The research solicitation email was sent to athletes using the sport performance-tracking website, Training Peaks, from which a total of 732 usable electronic surveys were returned (response rate = 14.6%). Training Peaks is an online sport analytics tool that provides tailored training programs and performance tracking to endurance athletes. The criteria for participation depended on intention to travel to an endurance event. In order to be included in the study, participants either traveled within the last months or planned to travel in the next eight months (by the end of the calendar year). Those who answered ‘yes’ to these criteria were advanced to the survey.
The majority of segmentation research has utilized a sampling method to include individuals who have not yet planned to travel (Kim and Chalip, 2010), who have planned to travel to a destination, or who have previously visited a destination (Kaplanidou and Gibson, 2010; Kaplanidou and Vogt, 2010; Tkaczynski et al., 2009, 2010) or alternatively used secondary data (e.g. Kim and Lee, 2002; Chang, 2006; Shin, 2007). The sampling strategy utilized in the current investigation may allow for a broader understanding of how the destination segments are affected by sport type over a specific sport event.
Participants
Approximately 45.9% (n = 336) of the respondents were female, between the ages of 35 and 49 (42.2%, n = 309), overwhelmingly White (90.7%, n = 664), highly educated (85.7% >bachelor degree, n = 627) with high household incomes (50% >US$100,000, n = 366). The sample was made up of 42.9% (n = 314) triathletes, 20.1% (n = 147) cyclists, and 37% (n = 271) runners, of which 55.9% (n = 409) typically raced long distances (half- or full marathon and Ironman, or >65 miles stage), 70.5% (n = 516) considered their level to be intermediate, and 51.5% (n = 377) and 49.9% trained more than 10 h/week. Table 1 provides more details about the sample.
Participant background and athlete demographics.
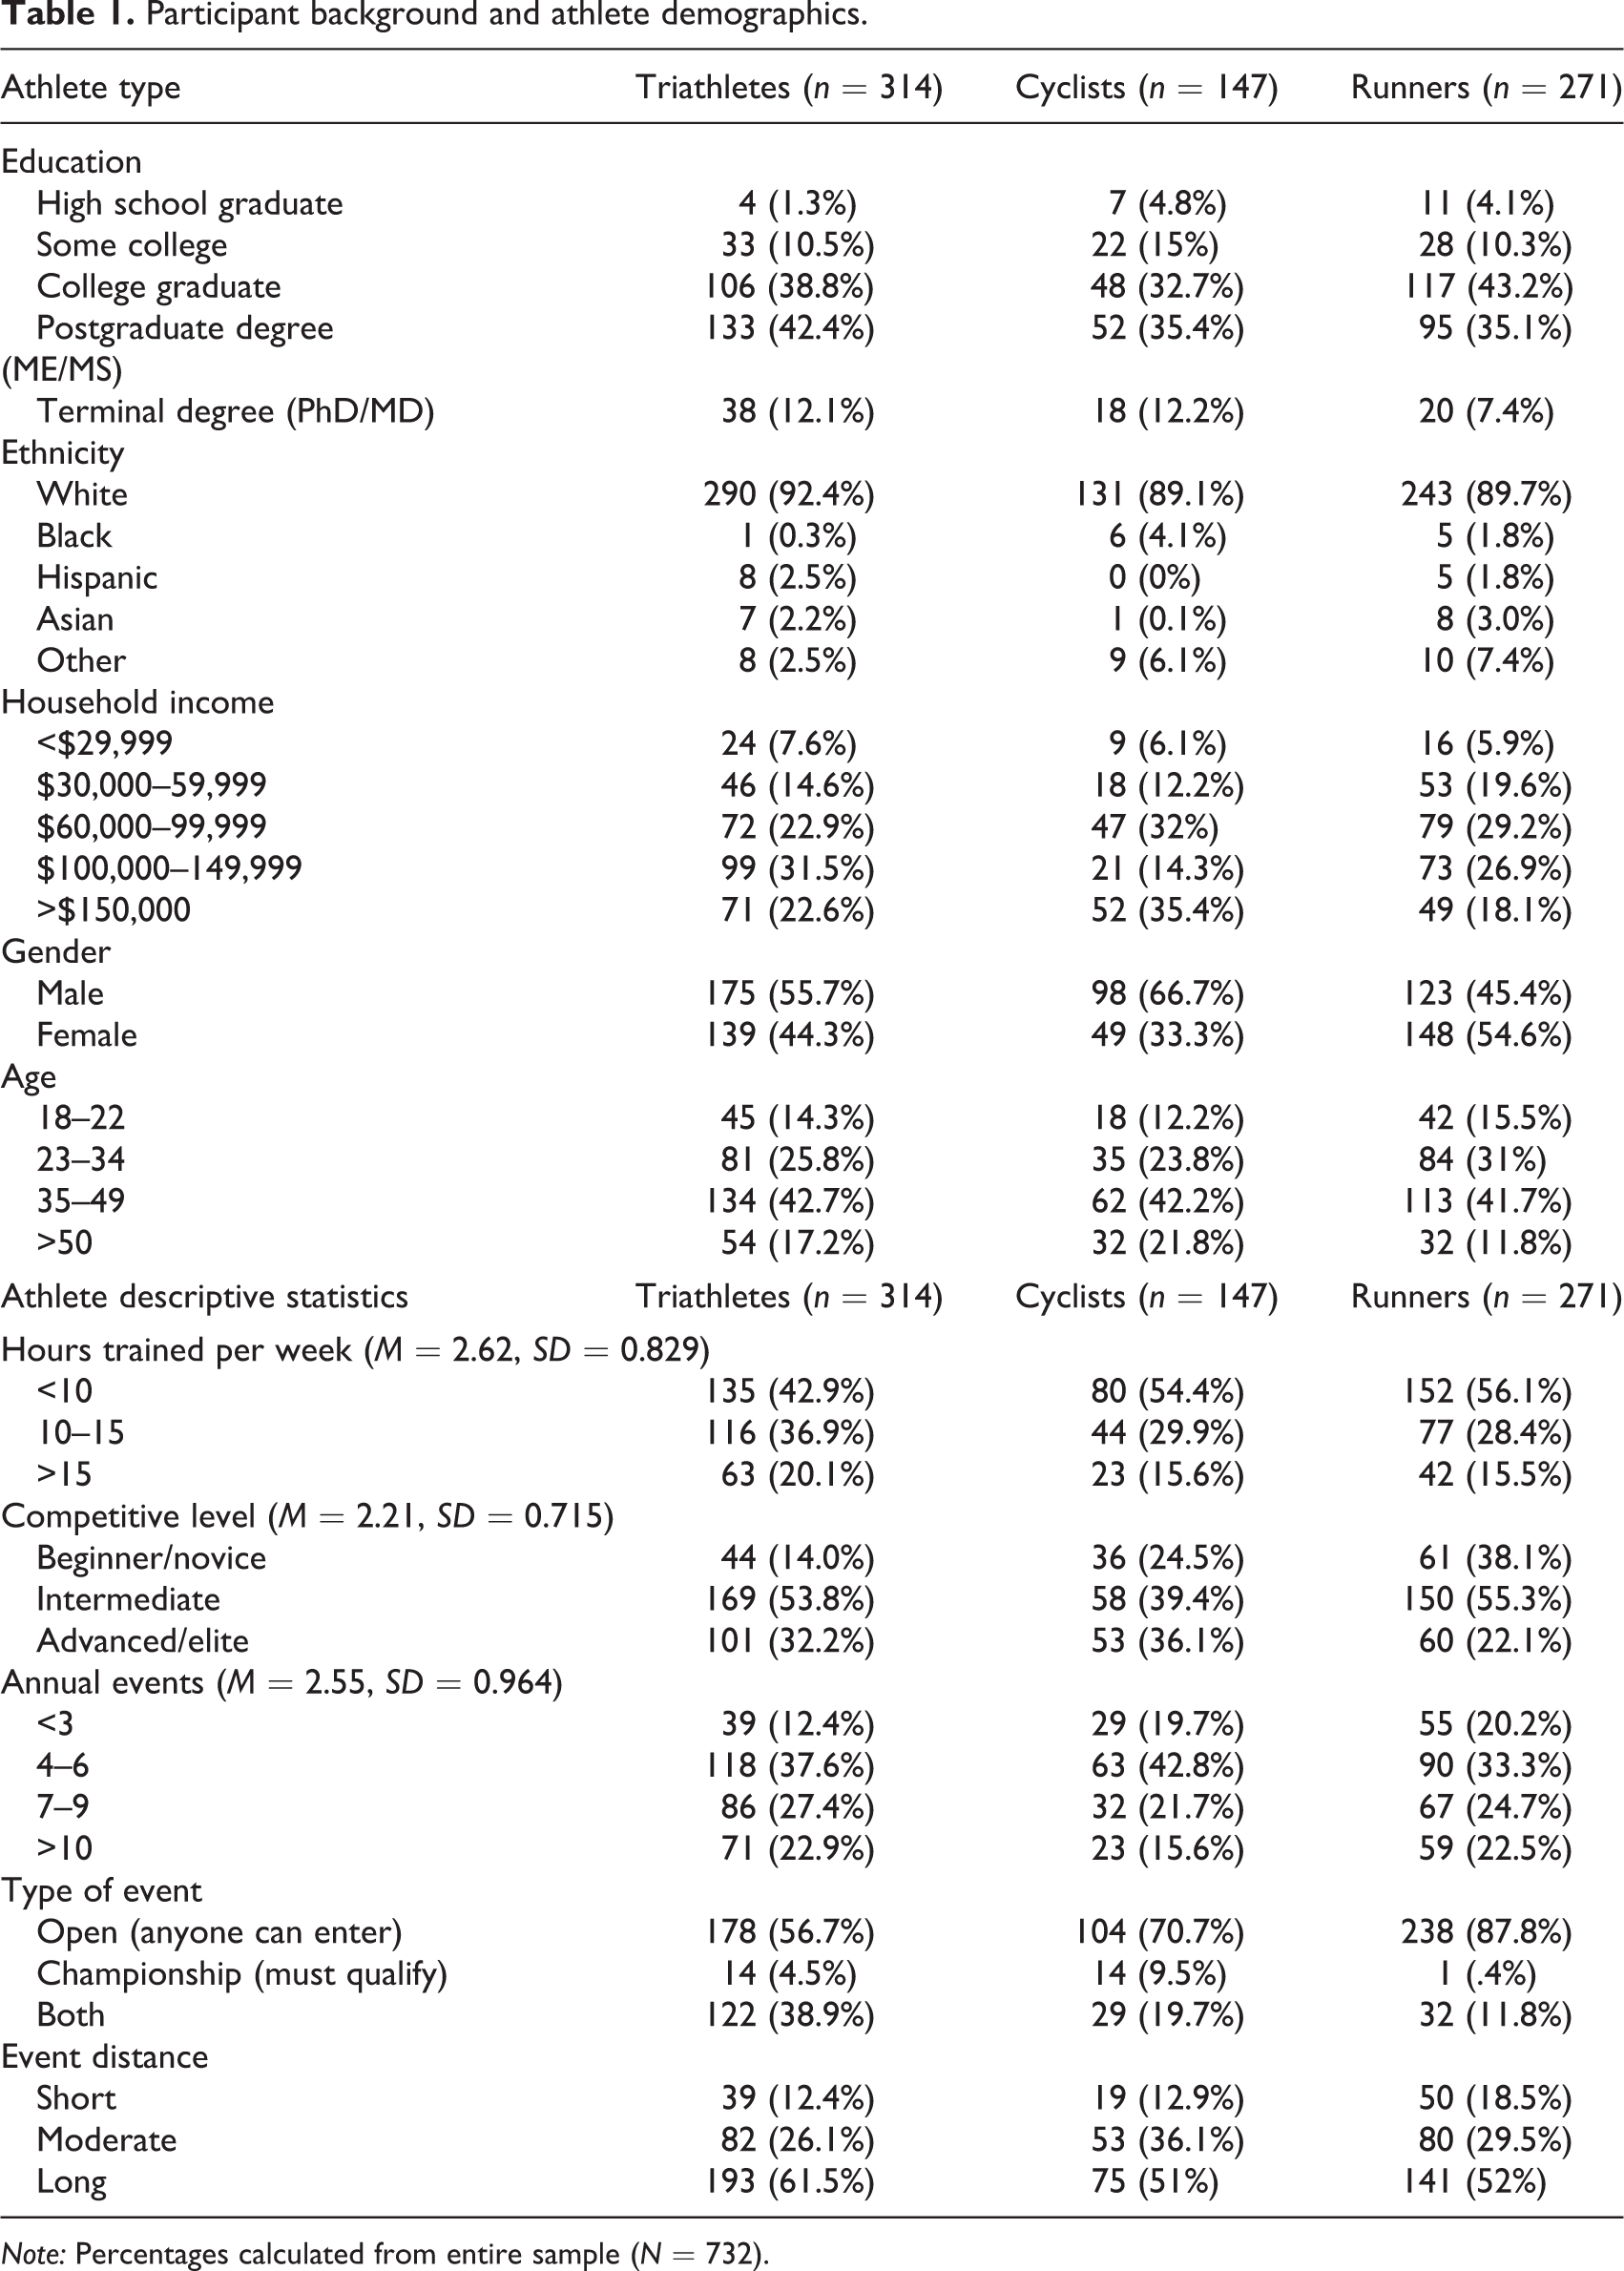
Note: Percentages calculated from entire sample (N = 732).
Instrumentation
The questionnaire contained three parts. First, participants chose which sport they identified with the most (running, triathlon and cycling), the length they typically raced when traveling to an event destination (short: <10km, sprint distance triathlon, or <30-mile circuit or criterium; moderate: half-marathon, Olympic triathlon, 35–60 circuit/criterium; or long: marathon, half- or full Ironman, >65 circuit/criterium/stage), how far the event destination was from home (regional—within 100 miles of home, national—required interstate travel, and international—left home country), and what type of event they typically traveled for (open—no qualification to participate, championship—qualification required to participate or both).
Next, the participants were asked to complete the ranked the eight generic race destination products in terms of the importance these factors had on their decision to travel (1 = completely unimportant to 7 = very important) for the conjoint analysis. These factors included cost, tours, unguided tours, destination, sightseeing, shopping, nightlife, and entertainment. Finally, the participants completed the training and demographic questions. Training information included the number of hours trained per week, level of competitor (novice/beginner, intermediate, advanced, elite), and number of event completed in a racing year (<3, 4–6, 7–9, >10). Demographic information included age, sex, ethnicity, education, and annual household income.
Data analysis
Conjoint model design and procedure
A total of 10 tourism or chamber of commerce websites for key destinations—where influential endurance events were located across a variety of international locations (e.g. North America, Oceana, and Europe)—were explored. Seven destination attributes were identified as focal, and each was assigned a level for use in this study (Raghavarao, 2010). The tourism websites were reviewed for specific destination assets that would serve as key ‘pull’ attributes for those choosing a destination to race (Crompton, 1979). Table 2 illustrates the key destination attributes, which are comparable to those identified in the research literature (see Chalip and McGuirty, 2004).
Event attributes and attribute levels.

To explore how endurance athletes segment based on tourism preferences (RQ1), eight orthogonal combinations of attributes were created in order to assess the part-worths (i.e. consumer utility for a product) for each attribute using conjoint analysis (Raghavarao, 2010). The eight combinations were then generated as item cards, each of which described an event destination characterized by one of the seven combinations of attributes. Conjoint analysis presents the generic tourism products in random order on ‘item cards’ in order to determine how the participants value different attributes that make up the tourism products offered by the destination. Participants then ranked the eight event destination products listed on the ‘item cards’. The attribute levels were selected to be representative of common variations of destination elements present among destination events.
The part-worths from the conjoint analysis were calculated for the seven destination product attributes (Raghavarao, 2010) and then cluster analyzed using two-step cluster method with Schwarz’s Bayesian criterion to identify the market segments (Schwarz, 1978). To examine what describes the segments (RQ2), multinomial logistic regression was used to examine if there were any demographic or behavioral variables that predicted segments. Cell means (for interval variables) and observed versus expected frequencies (for nominal variables) were then inspected to confirm the direction of effects for predictors found to be significant in the multinomial logistic regression (Kim and Chalip, 2010). Lastly, regression analysis tested the effects of demographic variables on the likelihood that participants would travel internationally as an event destination (RQ3).
Results
Conjoint analysis and segmentation
The part-worths from the conjoint analysis were extracted. The part-worth for trip price is an estimate of the linear effect (from less to more); the remaining part-worths are estimates of discrete effects. Part-worths for the entire sample are displayed in Table 3, which shows that trip price is the single greatest contributor to overall utility, with lower trip prices preferred. The destination location, entertainment availability (casinos, movie theaters, theme parks, etc.), and fun nightlife (great restaurants, bars, clubs, etc.) are also highly valued, as they provide the next highest contributions to overall utility. Athletes did not prefer opportunities to shop as indicated by the lowest utility. Guided tours and unguided sightseeing were moderately important.
Aggregate event destination utilities.

Cluster analysis of the part-worths was conducted to determine whether the respondents could be segmented as a function of their utilities for event destination attributes. In the first analysis with all seven destination attributes, trip price served as a swamping variable, which means that a majority of the respondents were focused on cost to the exclusion of all other destination attributes (Ward, 2000). As Table 3 illustrates above, this sample of athletes were found to be highly price sensitive. It was determined that since all groups were price sensitive, the trip price attribute was dropped from the cluster analysis (Ward, 2000) and the resulting three segments were subsequently identified as partiers, escapists, and explorers. These segments are illustrated in Table 4. The trip price sensitivity of all groups will be discussed in more detail in the Results section.
Conjoint results for tourist segments.

Note: Numbers in parentheses are percentages of total part-worths for each segment.
Relationship of segments to demographic measures
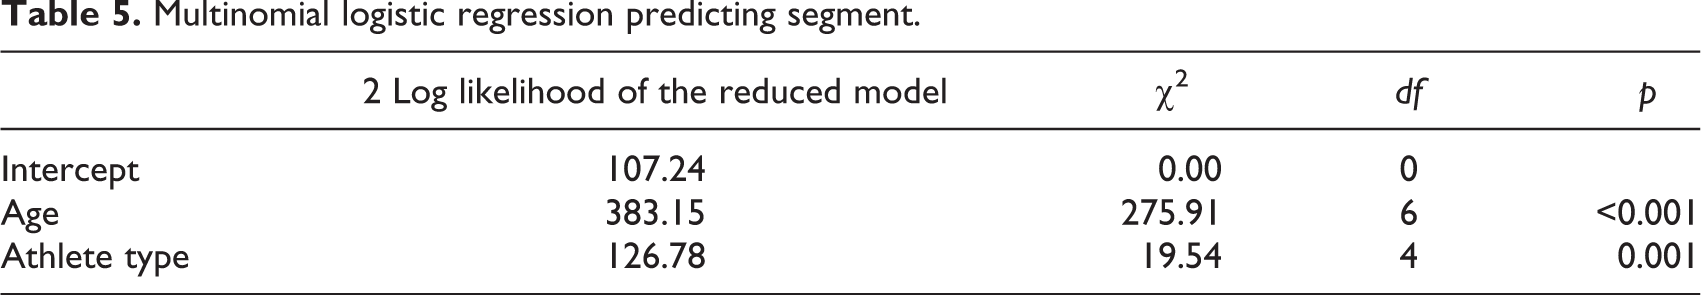
Multinomial regression was conducted with segment as the dependent variable and all demographic/sport variables (age, gender, ethnicity education, income, athlete type, event length, hours trained, and distance traveled to next event) served as independent variables. The overall model was statistically significant (χ2 (50) = 314.704, p < 0.001), but many individual predictors were not statistically significant. These predictors were eliminated sequentially until only significant predictors remained. The final model was also statistically significant (χ2 (10) = 291.15, p < 0.001) with two variables remaining: age and athlete type (Table 5) providing adequate prediction (Nagelkerke pseudo R2 = 0.38).
Multinomial logistic regression predicting segment.
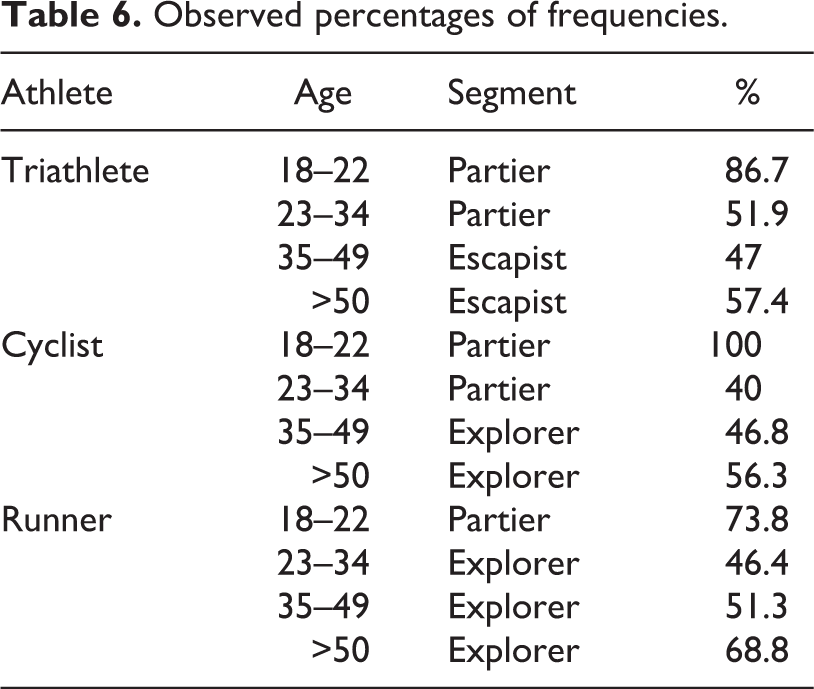
In order to determine the direction of effects, the parameter estimates and cell means/frequencies were reviewed. The results indicate that athletes aged 18–22 are more likely to be partiers and enjoy the nightlife and restaurant scene of a destination. As the athletes age into the 23–34 years age group, many still categorize as partiers (43%), but several in this age group are also beginning to move into the explorer category (33.5%). For the 35- to 49-year-old athletes, many categorize as explorers (44.7%) and escapists (40.5%). Finally, those older than 50 years also tend to classify explorers (53.3%) and escapists (44.9%). Triathletes are more likely to be escapists (38.2%) and explorers (32.4%), whereas runners (47.2%) and cyclists (41.5%) are more likely to be explorers. Table 6 illustrates the percentages based on the total observed frequencies in each subpopulation.
Observed percentages of frequencies.
Probability of destination choice
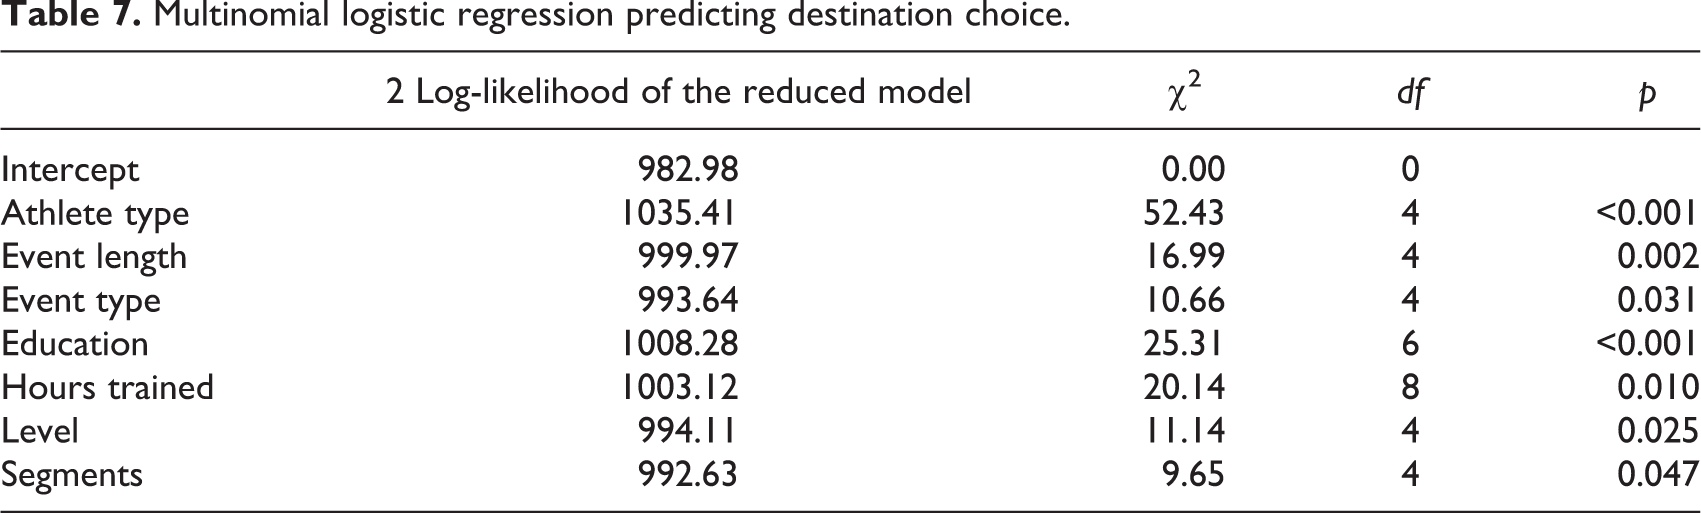
Multinomial logistic regression was conducted with destination choice (regional, national, and international) as the dependent variable, and all demographic variables (age, gender, ethnicity education, income, athlete type, racer type, hours trained, and segments) served as independent variables. The overall model was statistically significant (χ2 (68) = 179.406, p < 0.001), but many individual predictors were not statistically significant. These predictors were eliminated sequentially until only significant predictors remained. The final model was also statistically significant (χ2 (34) = 143.908, p < 0.001) with seven variables remaining, such as athlete type, event length, racer type (level/length combined), education, hours trained, and segments (Table 7), providing moderate prediction (Nagelkerke pseudo R2 = 0.21).
Multinomial logistic regression predicting destination choice.
To determine the direction of effects, the parameter estimates and cell means/frequencies were reviewed. Many runners (61.6%) and triathletes (54.8%) were more likely to travel regionally, while cyclists (56.5%) were more likely to travel nationally for their destination events. Of all athlete types, triathletes (17.2%) were most likely to travel internationally to race. When considering the length of the event alone (without ability level included), athletes chose regional (68.5%) events for short courses, regional (50.7%) and national (38.1%) events for moderate distance races, and national (33.7%) and international (17.1%) for long-course events. The results indicated that athletes who consider their ability level to be advanced or elite racing moderate to long courses are more likely to travel nationally and internationally (54.1%), while those who consider themselves to be beginner/intermediate and race short to moderate distances are likely to travel regionally (56.5%). Those with higher education are more likely to travel nationally (55.8%) and internationally (25.5%). Athletes who trained more than 12 h a week were more likely to travel nationally (35.9%) and internationally (19%) to race. Finally, while the majority in all segments planned to travel regionally, 34% of explorers and 31.1% of escapists planned national travel, while 11.3% of explorers and 14.5% of escapists planned international travel.
Discussion
The focus of this study was to explore how endurance athletes segment in relation to their destination choices (e.g. location, attractions, and entertainment) and how do these factors influence the intention to travel. Following conjoint analysis to answer the first research question (How do endurance athletes segment?), the sample was found to have three types of sport tourist segments: partiers, explorers and escapists. The findings indicated clear differences between segments related to age and athlete type (i.e. cyclist, runner, and triathlete), and no differences were present in the other demographic or behavioral variables, answering the second research question (What describes those segments?). Finally, the results indicated that athlete type, racer type, education, event length, hours trained, and segments provided moderate prediction of the destination choice (RQ3). The following will be a discussion of how the results add to the current literature on sport tourist’s selection and how practitioners may use this information.
Segmentation
The current investigation fills a gap in the current literature on active sport tourism by identifying how endurance athletes segment, how that segmentation influences destination choices, and the effect of demographic variables on destination interests. First, the conjoint analysis revealed three clear categories of endurance sport tourists: explorers, escapists, and partiers. Escapists were not interested in any of the destination attributes—guided tours, entertainment, shopping or a vibrant nightlife. Rather, escapists preferred unguided sightseeing to any other option and showed interest in both domestic and international destinations for endurance sport events. Explorers were very interested in the guided tours, entertainment, and the nightlife and were interested in international travel to sport events over domestic. The partiers were highly interested in the vibrant nightlife of the domestic destination and had a moderate interest in other entertainment options offered by the destination.
All active sport tourists in the sample were influenced heavily by the price of travel, which could be considered a constraint to participation (Godbey et al., 2010). The sensitivity to trip price is not surprising given the expenses associated with each sport and have previously been found among both triathletes (Hambrick et al., 2013; Kennelly et al., 2013) and marathon runners (Ridinger et al., 2012). In addition to the cost of regular travel (e.g. airfare, hotel, and car hire) associated with sport tourism, athletes also incur hefty event registration fees and they have to pay to transport the equipment (i.e. cyclists and triathletes) necessary to participate (e.g. bicycle, wetsuit, and equipment). Strategic partnerships between event and destination marketing organizations may alleviate the challenges that high cost of travel creates (Tkaczynski et al., 2009) to potentially increase sport tourism from a much larger audience (Blain, et al., 2005; Sheehan et al., 2007). For example, event managers could partner with third-party organizations that offer equipment transport. As part of the study, athletes were asked if they would be interested in a third party providing equipment transport and 26.5% noted that they would likely use it and 16% were undecided. Perhaps by providing deep discounts as part of registration, athletes would consider using such a service to ease travel to/from the destination.
Demographic and behavioral differences
In terms of demographic segmentation, both age and athlete type influenced the active sport tourist. The younger athletes in the sample were drawn to the vibrant nightlife and entertainment options of the destination, whereas the older athletes were more likely to travel for escapism and exploration. Closer inspection of athlete type and segment revealed that running and cycling tourists are more likely to travel to explore the destination, whereas triathletes tend to want to escape as part of their active sport tourism. While not directly tied to age, Ritchie et al. (2010) found that cycling tourists were motivated and involved differently in sport tourism. In their sample, younger cyclists were not as likely to travel as the older segments; however, like the current investigation, they valued the adventure elements and social aspects the event and destination experience may provide.
Destination choice
A unique contribution of this study was evaluating the behaviors of the three different groups based on the length and competitiveness of the event. The length typically raced and the level of competitiveness also influenced the race event type the athlete sought when traveling for sport, similar to the results of Aicher et al. (2015) and Newland and Aicher (2017). Triathletes tended to be advanced and/or professional traveling for long-course distances (i.e. half- and full Ironman distance). Of all the athletes, triathletes were more likely to travel internationally. Given the Ironman, the leading event for long-distance triathlon, now has more than 282 events worldwide (‘Races’, 2017), it is critical to understand how these athletes travel.
Cyclists were more likely to be advanced or professional, traveled more for moderate length events (i.e. 35- to 60-mile criterium or tour), and were more likely to travel nationally (interstate) for events. This finding is likely due to the growth and popularity of the sport across the United States. While there has been growth in cycling, the sport lags triathlon and running in regard to availability of events. For example, a search of USA Cycling event website for sanctioned events in 2016 showed 200 road events. Of those events, 63.5% were camps, rides, and tours, which are not competitive events (USA Cycling, 2017). Whereas USA Triathlon sanctions more than 4300 competitive events per year (USA Triathlon, 2017), and running events are even more ubiquitous with over 48,000 races in 2016 (Running in the USA, 2017).
Finally, runners were more likely to be beginners and/or intermediate traveling for short-course events (i.e. 10km or less) more regionally. Given the highly saturated running event market (Running USA, 2016), runners can find numerous challenging, fun, exciting, and/or entertaining events closer to home, so the need to travel may not be driving these athletes with so many events available. Another reason for travel closer to home might be the skill level, as the runners in this sample were not as likely as triathletes and cyclists to perceive themselves to be advanced or professional. Athletes not as skilled in the sport may not feel it necessary to travel to far distances to compete.
Practical implications
Knowing how athletes segment by athlete type and age is valuable to event managers as they consider the marketing strategy. For instance, the clusters in Ritchie et al.’s (2010) investigation of cyclists found that those who clustered with higher skill levels were more willing to travel. The knowledge of course length, athlete type, and distance willing to travel for an event may assist event managers with identifying the appropriate outlets to market their events, as well as the messaging they should utilize. The distance the athlete prefers to travel is also important. For example, the findings indicated that cyclists prefer national (i.e. interstate) travel. Those hosting cycling events would be well served to identify national (i.e. interstate) areas to which individuals travel to participate in their events and increase their marketing efforts in those areas. In contrast, large-scale running events should focus on their marketing attention regionally rather than nationwide or internationally, given that runners were more likely to prefer regional events. Event managers may also consider leveraging transportation and accommodation packages targeted to larger metropolitan cities in their region to increase participation from those locations.
The findings are also critical for destinations as they consider attracting specific events or bidding on events to increase tourism. Destination marketers using sport to enhance tourism can be more strategic when selecting active sport events. If the destination is interested in attracting tourists who will interact with the nightlife and restaurants, then events that tend to be of interest to athletes younger than 35 years are key. Further, given runners in this age group are the most likely to engage with the nightlife then a shorter running event (under 10km) could be a strong choice; however, marketing efforts would need to focus on regional travelers. Contrarily, if the destination wants to utilize destinations meant for escape and relaxation, then a triathlon would align better with these destination attributes. However, if the destination has several tourist attractions or famous sites, a running or cycling event might be better suited to the location as these athletes are more likely to get out and explore.
All athletes are interested in regional (interstate) events. Given the cost to participate, regional travel appears plausible for athletes in all three sports. However, to best capitalize on regional travel, destinations should consider running events (short to moderate length), as these athletes are keener to travel closer to home. For destinations interested in attracting international tourist, then longer, more challenging events (in all three sports) would be an important focus. However, how the destination is then promoted to these specific sports would differ with a focus on exploration for runners and cyclists and escape for triathletes.
Limitations and future research
As with any research study, this study is not without limitations. First, many of the athletes planned to travel regionally. To better understand destination racing, a future study should measure athletes who plan to travel further from home—national or international locations. While all athletes in this study had planned to stay overnight, it is difficult for the researchers in this study to label a regional event as a ‘destination event’. Second, athletes’ self-report data should be treated with caution. For example, athletes self-reported ability level, which could easily be biased based on athlete perception. Finding ways to standardize these variables could help eliminate the bias of skill perception. Finally, the conjoint cards only provided destination options and did not include any event elements. Past research has indicated that athletes are more interested in event options than destination (see Kaplanidou, 2010; Newland and Aicher, 2017), so it is important to better understand how the destination and event elements interact when athletes consider destination choices.
Conclusion
To date, research has largely focused on motivation (e.g. Aicher et al., 2015; Getz and McConnell, 2011; Lamont and Kennelly, 2012) or psychological involvement associated with participation (e.g. Funk et al., 2011; Ridinger et al., 2012; Ritchie et al., 2010) rather than segmenting active sport tourists to better understand destination choices. These are significant gaps in the literature, which this current study sought to fill. The results of this study suggest that sport event and tourism leaders must have a better understanding of how and why athletes choose certain destination events, as well as outline various bundling strategies they may engage in to increase the number of sport tourists, extend their stay at the destination, and increase the overall spending (Ritchie et al., 2010; Tkaczynski et al., 2009, 2010).
The current investigation adds to the literature on segmentation in three areas. First, athletes are segmented based on destination attributes and are influenced by athlete type and age. Next, we found that segmentation strategy including demographic, attitudinal (destination elements), and behavioral (travel choices) could be useful to both event managers determining how to best bundle destination attributes as well as destinations seeking to attract active sport events to the area. Finally, the sampling method included individuals who participate in three sport activities (running, cycling, and triathlon) and evaluates their destination preferences before they selected or had just selected a destination.
Based on this study, destination elements create segments of athletes that event and destination marketing organizations may utilize to strengthen the events appeal to sport tourists. The price sensitivity of the sample indicated the importance of developing strategic partnerships to create packages to reduce costs, while the differences between the other categories assist with design and marketing elements they could use to attract sport tourists. Therefore, as sport events and government tourist agencies seek to attract more athletes, it is important to understand that the type of athlete, the length of the course, the type of tourist, and the age of the athlete all matter when determining what event and destination to travel to for the next active sport event.
Footnotes
Declaration of conflicting interests
The author(s) declared no potential conflict of interest with respect to the research, authorship, and/or publication of this article.
Funding
The author(s) received no financial support for the research, authorship, and/or publication of this article.