
Abstract
We examined the telephone response rates in a 2-year study of patients with COPD to identify factors associated with non-response. A total of 381 patients received monthly telephone calls to assess symptoms and treatment in 2007 and 2008. A total of 9019 calls were made over 24 months, of which 73% were answered. The highest response rate was obtained in February 2007 (81 %), and the lowest in July 2008 (48%). The monthly response rate was lower in the second year of follow up. There were 39 patients (10%) who were less frequent responders, with 10 or fewer responses. Less frequent responders were more likely to be current smokers and have hypoxaemia. The median number of answered calls was 18 (interquartile range 16–20). In bivariate models the median number of responses was significantly lower in subjects with chronic cough. In multivariate models neither demographic nor disease characteristics were significantly associated with non-response. We found less frequent responders to monthly telephone calls to be similar in characteristics to frequent responders. This suggests that non-response does not necessarily introduce bias in telephone surveys of patients with COPD.
Introduction
Telephone surveys have been used in chronic obstructive pulmonary disease (COPD) research to assess the frequency of exacerbation, the quality of health care, the burden of disease and the cost of health care.1–7 Response rates in telephone surveys vary greatly.1,5,6 If non-response is associated with demographic characteristics or clinical features that also are associated with the study outcomes, then subsequent analyses will be biased. Potential bias due to non-response in postal surveys has been described earlier8–11, but to our knowledge, no study has assessed how non-response to telephone calls in studies of COPD patients might influence the inferences drawn from such data. To evaluate both the internal and external validity of a telephone survey, it is crucial to know whether the frequent responders to telephone calls have the same characteristics as non-frequent responders.
Based on previous studies of non-responders in respiratory epidemiological studies8,9,12, we hypothesised that men, current smokers and less well-educated people would be less inclined to respond to regular telephone calls regarding exacerbation in COPD. We have examined the demographic and disease characteristics associated with non-frequent response in a study of 381 COPD patients from Western Norway receiving monthly telephone calls for 2 years. The research questions were: (1) does the response rate to monthly telephone calls change over two years? (2) are there any demographic details associated with response to monthly telephone calls in COPD?
Methods
During 2006 patients were recruited through outpatient clinics from several hospitals in Western Norway, and from three private specialist practices in Bergen. All patients had a smoking history of more than 10 pack-years, a post-bronchodilator FEV1/FVC ratio < 0.7, and an FEV1 of < 80% predicted. 13 Patients with known cancer the last five years, or inflammatory disorders like rheumatoid arthritis, systemic lupus erythematosus or inflammatory bowel disease were not included. Baseline characteristics such as smoking habits, information on symptoms and prior acute exacerbations of COPD, and measurements of lung function and arterial blood gas were obtained at the first visit to the study centre. Details of the study sampling and inclusion criteria may be found elsewhere. 14 Written information was provided and written consent was obtained from each participant prior to inclusion. The study was approved by the appropriate ethics committee. Before the telephone survey started in 2007, 6 patients died, 16 were excluded or withdrew. Also, the last 22 patients that were recruited were not included in the telephone survey.
The telephone survey was conducted in 2007 and 2008. Patients were called once a month by trained staff (medical students). If there was no answer, or the patient did not have the time to be interviewed, he or she received a second call within a week. Interviews followed standardized forms, addressed symptoms and changes in treatment, and lasted approximately 2–3 min. Dyspnoea was assessed by the Medical Research Council breathlessness scale, which defines dyspnoea grade 2 as breathlessness when hurrying on the level or walking up a slight hill, grade 3 as walking slower than most people on the level or stopping after 15 min when walking at own pace. Patients who died, were excluded or did not want to participate in interviews any more during follow up, were not called. These values were recorded as missing in the data analyses.
Analyses were performed using a standard package (Stata, StataCorp, College Station, TX, USA). Logistic regression using Generalized Estimating Equations (GEE) was used to investigate the factors associated with repeated response to calls. Patients who dropped out were included in the analyses until date of death or exclusion. Two models were fitted: one including only demographic variables and the other using disease characteristics in addition to demographic factors as explanatory variables. In both models the dependent variable was repeated telephone calls.
Results
Of the 390 subjects included in the telephone survey, 9 patients left the study (8 died, 1 excluded) during the first months of 2007, leaving 381 subjects. The response rate for each month is shown in Figure 1. The total number of calls during the 24 month study period was 9019, of which 73% were answered. The highest response rate was obtained in February 2007 (81%), and the lowest in July 2008 (48%). There was a slight decrease in monthly response during the study period. In the first 12 months of the study the patients responded to 75% of the calls, while in the last 12 months the corresponding value was 69%. The median number of responded telephone calls was 18 (interquartile range 16, 20).
Response to telephone calls in 2007 and 2008. There were 381 persons in the study and all were called every month (except in cases of withdrawal from the study or death)
The distribution of answered calls is shown in Figure 2. When separating between less frequent and frequent responders, using the 10th percentile of response as cut off, the less frequent responders (≤10 received calls) were more likely to be current smokers and have hypoxaemia (PaO2 < 8.0 kPa) (Table 1). The median number of responses varied significantly with presence of chronic cough; subjects with chronic cough responded less frequently than those without (P = 0.029, Table 2). In multivariate analyses, the association of non-response and current smoking was not significant (Table 3). In a similar model taking disease characteristics into account, there was no association between chronic cough and non-response (Table 3). In the two multivariate models with adjustments for demographic variables and disease characteristics, only month number was significantly associated with response rate (P < 0.001).
Distribution of unanswered telephone calls in 2007 and 2008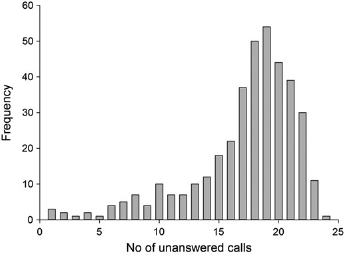
Characteristics of the study population. Significance was tested with chi-squared for categorical variables, students t-test for continuous variables with a normal distribution (FEV1 and pack-years), and Mann-Whitney U and Kruskal Wallis tests for continuous variables with skewed distributions (age)

ns, P ≥ 0.05
Number of telephone calls answered
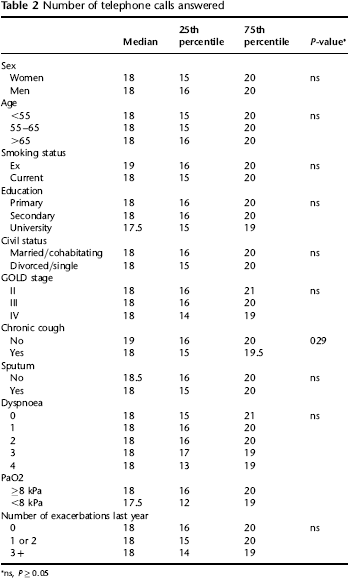
ns, P ≥ 0.05
The multivariate relationship between the number of telephone calls answered, demographics and disease characteristics

ns, P ≥ 0.05
Discussion
During the two-year telephone follow up study of 381 patients with COPD, the monthly response rates were 48–81%. In multivariate analyses neither clinical nor demographic features were associated with non-response, but there were fewer answered calls during summer. To our knowledge, this is the first study to report response rates and evaluate them in the light of variables that might bias results in a telephone survey of COPD patients.
The monthly response rates were similar to response rates in telephone surveys both in Norway and other countries.15,16 The lowest response rate was obtained in July during the second year of follow-up. In both years of follow up the response rate was lower in June and July. In the multivariate model, response rate was only dependent on the month in which the calls were placed. Non-response during summer can be explained by vacations and outdoor activities. There was a gradual drop in response rate from the first to the second year. The reduction in response rate over time could be due to lack of updated contact information. 14 However, telephone numbers and addresses were updated regularly using Internet based phone directories, which are publicly available in Norway. Furthermore, this telephone survey was part of a larger cohort study of COPD patients that included regular half-yearly visits to the study centre, where the patients themselves updated contact information. Thus, the gradual drop in response rate suggests that COPD patients participating in telephone follow-up surveys tire over time. The slight increase in non-response throughout the study was neither associated with demographical nor clinical variables, which does not suggest that non-response bias increases as response rate drops. However, lower response rates can lead to decreased statistical power, and this should be kept in mind when telephone surveys of COPD patients are planned. Courses of action that might improve response rate include monetary incentives, pre-notification letters, closer follow up contact, and mentioning personal obligation to participate. 17
We chose the 10th percentile as a cut off between frequent and infrequent responders. Due to the skewed distribution of the response (Figure 2), using percentiles is a useful way to describe the distribution. The median and interquartile ranges of the distribution for the subgroups of the variables were fairly similar, see Table 2. We wanted to investigate whether the infrequent responders would introduce bias, so we chose the 10th percentile as a cut off since this is often used as the lowest percentile when survey response is described. 18 The finding that current smokers are inclined to respond less in unadjusted analyses is in line with findings from postal surveys10,12,17,18 where smokers have responded less or not at all. In previous telephone surveys low response rates have been reported both as independent of19,20 and associated with smoking. 21 However, after adjustments for other variables, the response rate among smokers and ex-smokers did not differ significantly in our study.
In bivariate analyses subjects with chronic cough responded to fewer calls than subjects without chronic cough, which is not surprising. Subjects with chronic cough often have impaired health-related quality of life partly due to interruption of conversations or telephone calls 22 , and might avoid talking on the telephone.
In the multivariate analyses however, neither demographic nor disease characteristics were associated with lower response to telephone calls. The finding that response rates did not introduce bias in our study is in line with previous studies of responders and non-responders in telephone surveys23,24, but not all. 25 Davern et al. concluded that no significant differences were observed in key health variables among responders and non-responders in three telephone surveys of non-institutionalized adults in Minnesota and Oklahoma. 23 Lee et al. found that response rate did not substantially affect the representativeness of data when analysing data from the California Health Interview Survey 24 In another American survey investigating non-response, the Behavioural Risk Factor Surveillance System (BRFSS), lower telephone response rates were related to younger individuals (18–34 years), women and racial/ethnic minorities. 25 Our study population was ethnically homogeneous and did not include subjects younger than 40 years of age, so we cannot evaluate these variables in relation to non-response. The American telephone surveys described above were conducted in general population samples, whereas our study was conducted in a patient cohort. Interest in the study matter positively influences response rate. 26 For instance, general population surveys addressing cancer have obtained higher response rate from first- or second degree-relatives of people diagnosed with cancer. All our subjects had COPD, were willing to come half yearly to the study centre and undergo testing. Their willingness to participate in order to learn more about their disease might have attenuated the effect that variables like gender and age usually have on non-response. Our study adds to the current body of knowledge by confirming that there is little risk of response bias in telephone surveys of COPD patients.
The present study had several strengths. The survey comprised all clinically relevant COPD stages, and the patients were recruited from both outpatient and general population sources. Finally, the study lasted for 24 months, enabling the descriptions of trends. However, the limitations of the study should be acknowledged. The participants were seen every six months apart from the monthly calls. How these half-yearly visits may have influenced the responses to the telephone calls is unclear. Hence the generalizability of the study results may be limited to COPD follow-up studies in which the participants are also seen at a regular basis.
In conclusion, responders and less frequent responders had similar characteristics in our telephone follow-up survey of COPD patients. This suggest that telephone surveys of COPD patients can give representative estimates for the COPD population at large, and that non-response does not necessarily introduce bias. However, response rates influence statistical power. Thus the gradual drop in response rate observed throughout our study implies that non-response and measures to counteract it should be considered when such surveys are planned.