



Abstract
We examined symptom scores and physiological measurements from patients who were using a pilot COPD telemonitoring service. Of 33 patients recruited to the study, 19 were monitored for longer than 200 days. We identified three patterns of exacerbation, which we termed discrete (n = 5), rolling (n = 9) and over-ridden (n = 4). The association between FEV1, pulse and SpO2 and total symptom score was examined using multilevel logistic regression. The intraclass correlation coefficient for the model was high (0.36) indicating that much of the variance was due to differences between individuals, rather than within individuals. Compared to baseline, at the onset of exacerbations (n = 172) the mean pulse rate increased from 87 to 94 /min and the mean SpO2 fell from 93.6 to 92.4%. However, physiological variables did not differentiate between exacerbations and isolated bad days (n = 150). Few patient records displayed clear patterns of normality and exacerbation. Clinicians selecting patients for telemonitoring should assess the patient’s perception of variation in their symptoms and provide careful training and support whilst patients are learning to monitor their condition.
Introduction
Exacerbations of chronic obstructive pulmonary disease (COPD) are a major cause of hospital admissions and death. 1 Prompt intervention with antibiotics and steroids may prevent admissions and improve quality of life, 2 although difficulties in recognising early symptoms of deterioration 3 and delays in accessing care 4 may result in late presentation. While many patients find telemonitoring in COPD to be reassuring and perceive it to have prevented hospital admissions,4,5 the evidence for reduced hospitalisation for exacerbations of COPD is unconvincing. 6 A recent trial of telemonitoring in COPD showed no significant benefit in delaying time to admission. 7 One reason for this lack of benefit was considered to be the absence of algorithms that accurately predict exacerbations.
Algorithms for detecting exacerbations have been derived from studies of paper-based symptom diaries, 3 based on international definitions of exacerbations. 8 However, paper diaries have significant limitations, being susceptible to selective and retrospective recording. Although new symptom-based algorithms with improved predictive values are being developed, their performance in clinical practice remains insufficiently sensitive and specific. 9 Similarly, physiological measures such as spirometry, pulse oximetry and heart rate have poorly understood day-to-day variation, which may provoke unnecessary alerts and, alone, have limited predictive validity for COPD admissions. 10 A composite measure that combines pulse oximetry with symptoms in predicting a deterioration requiring treatment with antibiotics or steroids may be useful, but it is not clear how best these should be combined. 10
In a pilot telemonitoring study we used algorithms that generated frequent clinically unnecessary alerts, 4 suggesting poor discrimination for exacerbations. Although it is well recognised that people with COPD under-report exacerbations,3,4 there is concern that such high levels of alerting may represent over-detection of exacerbations resulting in alert fatigue, 11 and/or over-treatment. 4
We therefore examined the daily data from COPD patients using a pilot telemonitoring service, 4 to describe exacerbation patterns, examine relationships between symptoms and physiological variables and identify any changes in physiological variables at the onset of exacerbation.
Methods
The pilot study took place in 2008, with ethics approval from the appropriate committees. A full description of the study methodology with qualitative and quantitative outcomes has been published elsewhere. 4
A total of 33 commercially available tele-monitoring systems were installed in the homes of patients. The patients were selected by their general practitioners as having moderate/severe COPD and being at risk of a hospital admission. There were four participating practices situated in relatively deprived areas of Lothian. The only exclusion criterion was moderate/severe dementia.
Patients used a touch screen computer (Intel Corporation, Santa Clara, California) to record a validated symptom score, 2 comprising three questions asking about the cardinal symptoms of an exacerbation, 12 and five which aimed to detect possible infective triggers. Physiological measurements were oxygen saturation (SpO2), pulse rate and forced expiratory volume in one second (FEV1). Daily readings were transmitted via a broadband link to a call centre which referred the patients to their usual primary care service for clinical care. Patients were provided with an action plan and an emergency supply of antibiotics and steroids which they were encouraged to commence as soon as an exacerbation was recognised.
Data processing
Daily monitoring data available for analysis.
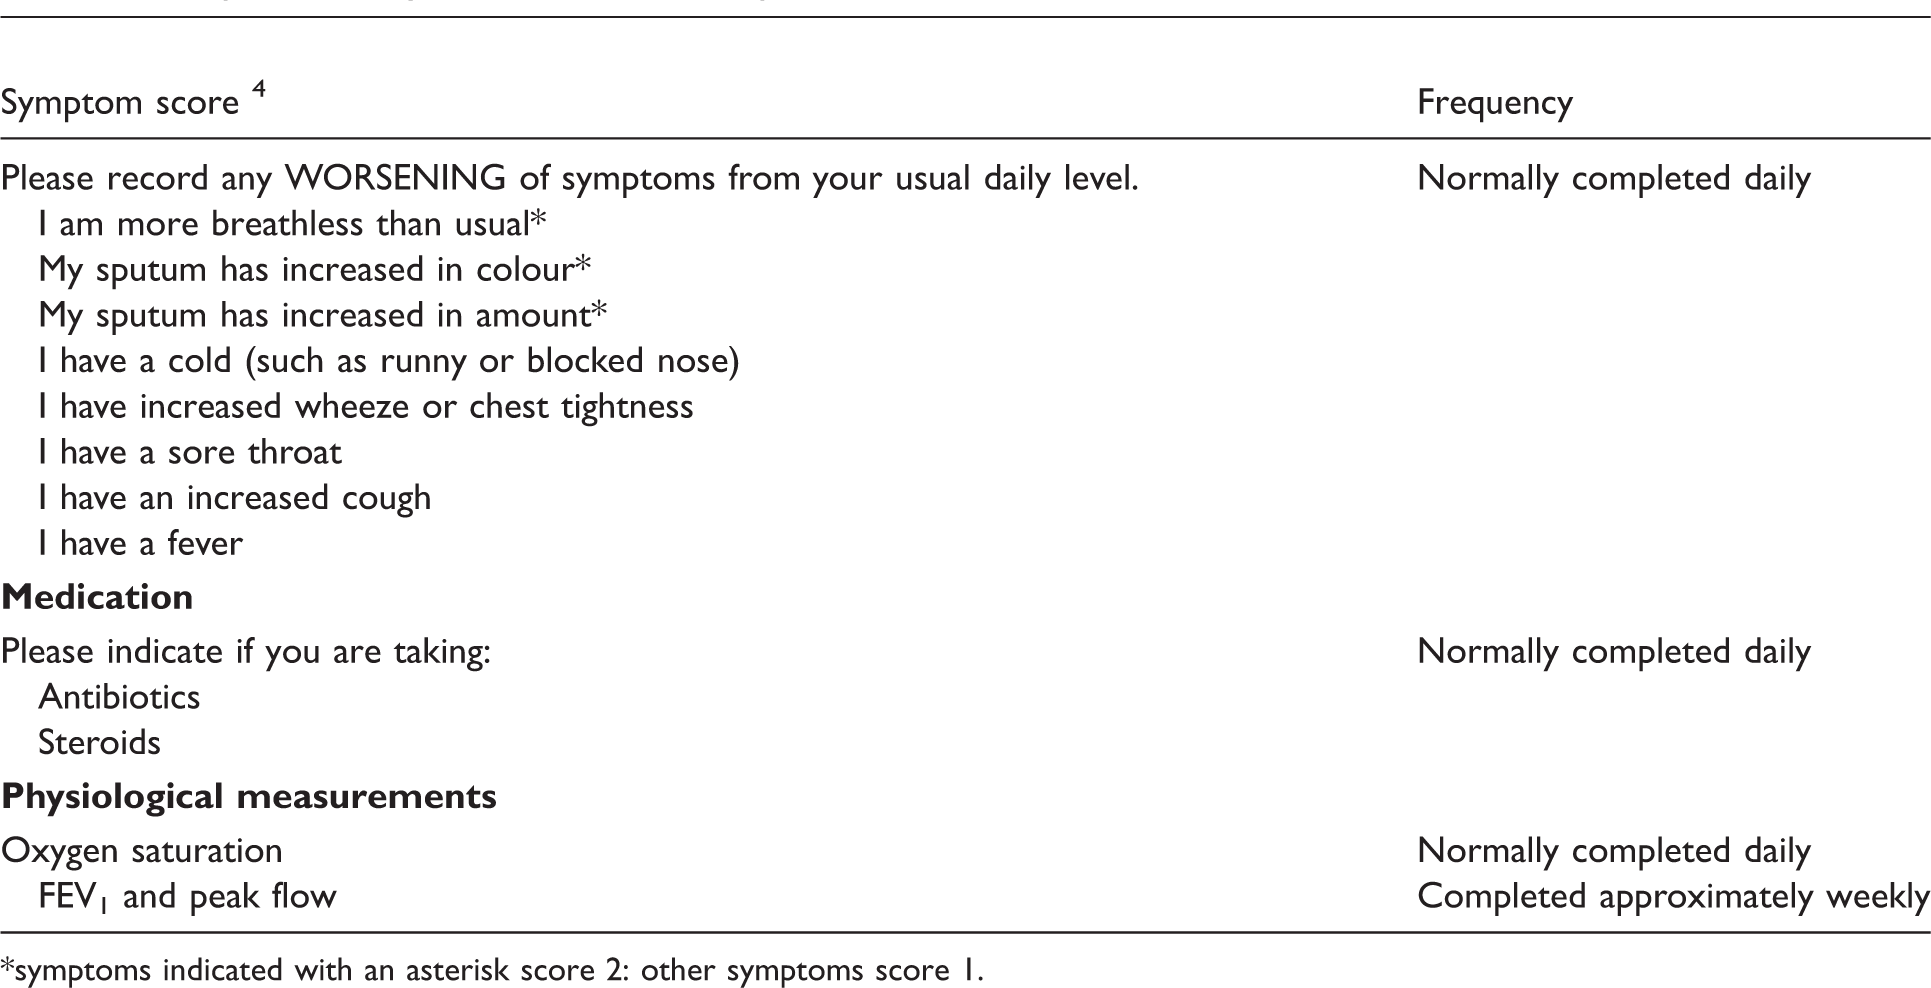
symptoms indicated with an asterisk score 2: other symptoms score 1.
From the symptom data we generated a total symptom score (one point for each item present, range 0-8). 2 In line with global guidelines, 8 we used two indicators of exacerbations: the first was whether the patient met Anthonisen’s et al. criteria (three or more symptoms including at least one of increased breathlessness, sputum amount or sputum colour for at least two days 12 ), which has been widely applied in studies using the validated symptom score2,3,10 and the second was whether the patient was taking an antibiotic on that day. For both of these indicators of exacerbations we defined the onset of an exacerbation as when two consecutive days meeting the criteria immediately followed two consecutive days which did not meet the criteria.
All data series contained missing data points. This was especially the case for FEV1. Missing data could not be assumed to be missing at random, especially as a sequence of missed days might indicate admission to hospital because of deterioration or a holiday during a period of comparatively good health. We therefore did not attempt imputation of missing data.
Exacerbation patterns
Time series plots were constructed for each participant who collected more than 200 days of data. These presented total symptom score, whether the patient met the criteria of Anthonisen et al. for exacerbation 12 and whether they reported taking antibiotics that day. Missing days were left blank. Two researchers independently inspected and grouped the plots according to the apparent pattern of symptoms and response. There was no attempt at a priori classification. After initial independent inspection the two researchers discussed their decisions before agreeing a classification of exacerbation patterns based on the data.
Association between symptoms and physiological variables
We inspected the association between symptom score, FEV1, pulse and SpO2 by constructing scatter plots for each pair of variables and each patient. We then tested the association of FEV1, pulse and SpO2 with total symptom score using multilevel regression, nested by individual and adjusted for the autocorrelation present in the data by specifying an AR(1) correlation structure to the models.
Changes associated with exacerbation
In order to capture changes in monitored values around the onset of an exacerbation, we took the worst value (lowest SpO2, highest pulse rate) from the first day in which criteria were met and the one preceding it. We took this approach because there was liberal antibiotic use in the study with treatment commencing at an early change of symptoms and it was likely that participants starting antibiotics on a given day would already have completed their telemonitoring data for the day before commencing, or being instructed to commence treatment. We analysed this using three approaches. First we summarised the changes in monitoring values from two days before the exacerbation with the worst value at the onset. Second we compared the worst day at the start of antibiotic treatment with the worst of two days during a period of non-treatment using multilevel logistic regression. Third we compared the onset of an exacerbation with a single “bad day” in which the clinical criterion for exacerbation was met on one day only and then reverted to sub-threshold level.
Multilevel regression analyses were conducted using the glmmPQL function from the MASS package for R.
Results
Characteristics of the participants.

Four people declined the pilot study baseline assessment but used the telemonitoring service under the arrangements with the health service. They provided anonymous data and we have no baseline information on these four patients.
Severity was based on FEV1 and classified according to the Global initiative for Obstructive Lung Disease. 8
Classification of exacerbation patterns
We identified three patterns of exacerbation, which we termed discrete exacerbations, rolling exacerbations and over-ridden exacerbations:
Discrete exacerbations were seen in five patients who had long spells of minimal symptoms with occasional flare-up of symptoms, most of which were treated with antibiotic. A less distinct rolling exacerbation pattern was seen in nine patients. These patients frequently had high levels of symptoms and took courses of antibiotics. In some cases they rarely returned to normal levels of symptoms or stayed off antibiotic treatment for more than a few days. Three of these patients had more than 20 antibiotic courses in a year, each course lasting between five days and 2 weeks. A pattern of over-ridden exacerbations was seen in four patients who frequently had symptom levels which indicated an exacerbation but who only rarely took antibiotics. We regarded this as over-riding the alarm signal from the symptoms.
One patient could not be categorised using this system because they did not have a change in symptom scores/exacerbations throughout the monitoring period.
In general, these patterns remained constant for an individual patient over the course of the telemonitoring. Example plots are shown in Figure 1.
Classification of exacerbation patterns. (a) Discrete pattern (n = 5) exhibiting long spells of minimal symptoms with occasional flares of symptoms, most of which were treated with antibiotic (b) Rolling pattern (n = 9) showing frequent, almost continuous, high levels of symptoms with frequent courses of antibiotics (c) Over-ridden pattern (n = 4) with frequent symptoms, few of which triggered antibiotic prescription.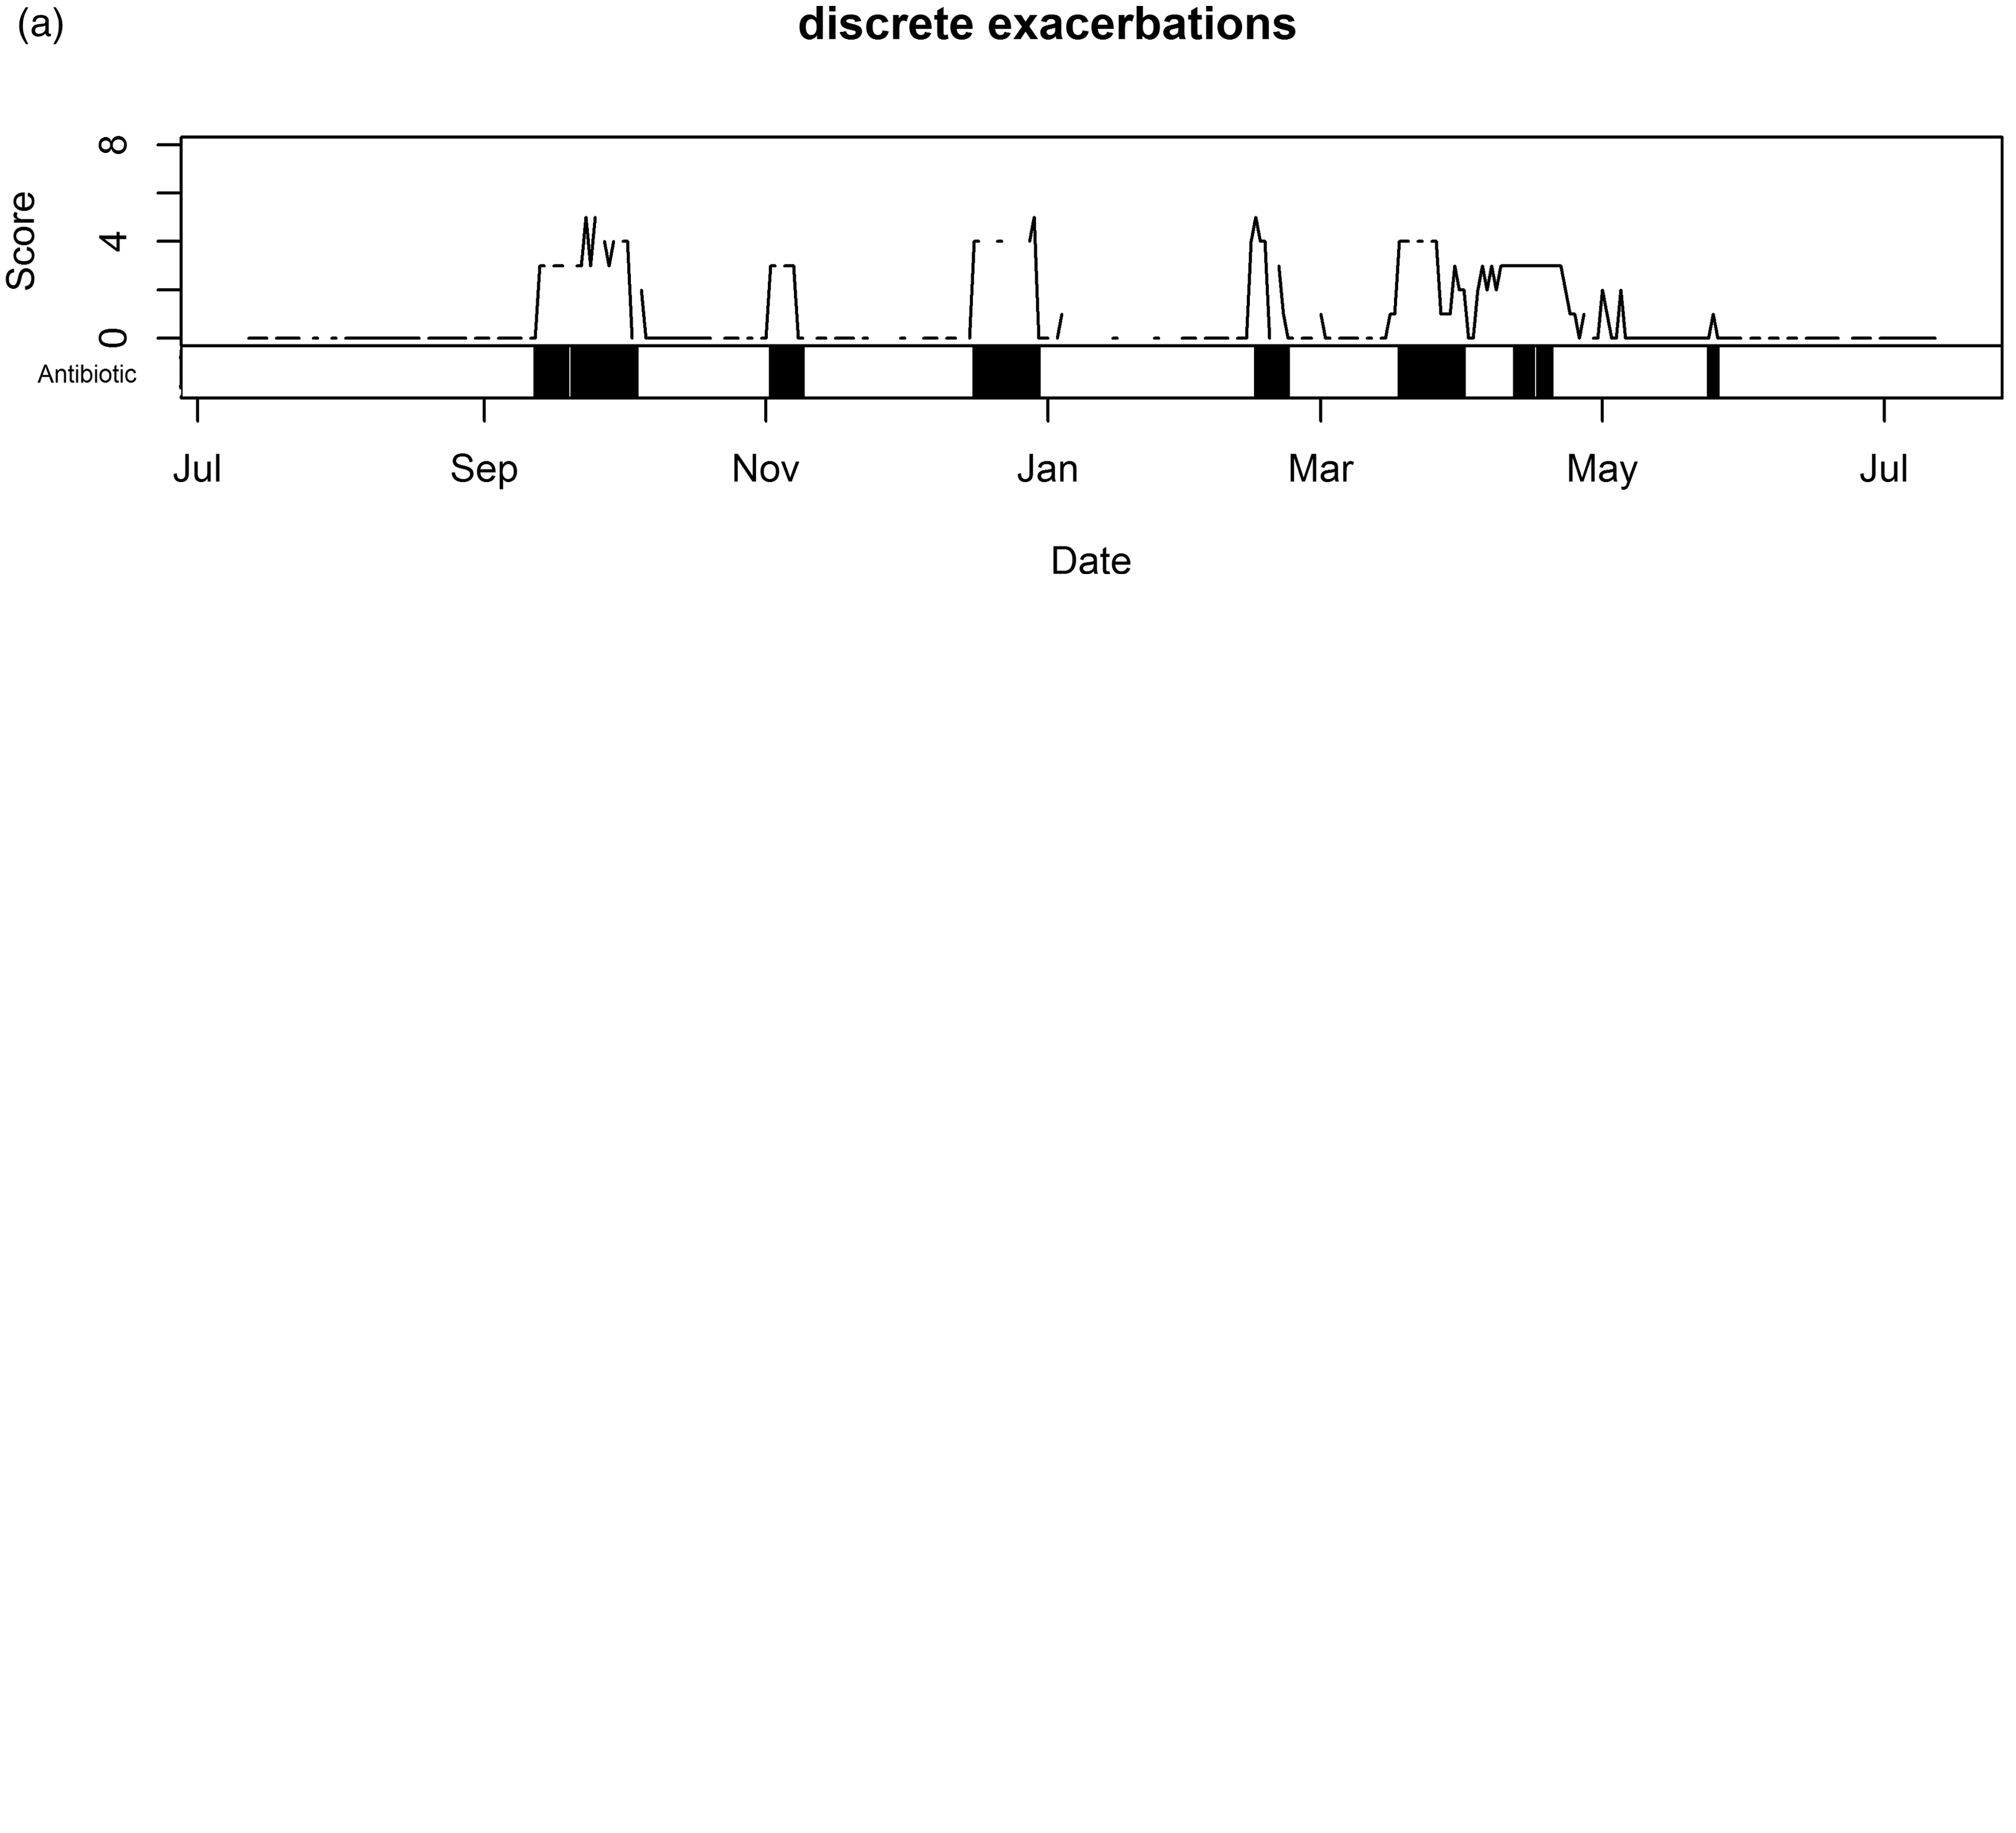
Association between symptoms and physiological variables
The correlation between symptom score and SpO2 is shown in Figure 2. Plots of symptom score against FEV1 or pulse rate showed similarly weak association. There was a strong correlation between FEV1 and PEFR (data not shown). The results of the multilevel linear regression model of total symptom score predicted by FEV1, SpO2 and pulse rate are summarised in Table 3. The intraclass correlation coefficient for the model was high (0.36) indicating that much of the variance was accounted for between individuals rather than within individuals.
Correlation between symptom score and SpO2. Multilevel linear regression model of total symptom score predicted by FEV1, SpO2 and pulse rate. fixed effects coefficient from linear mixed effects model. change in total symptom score associated with 0.1 L reduction in FEV1. change in total symptom score associated with 1% absolute reduction in SpO2. change in total symptom score associated with 5 beats per minute increase in pulse rate.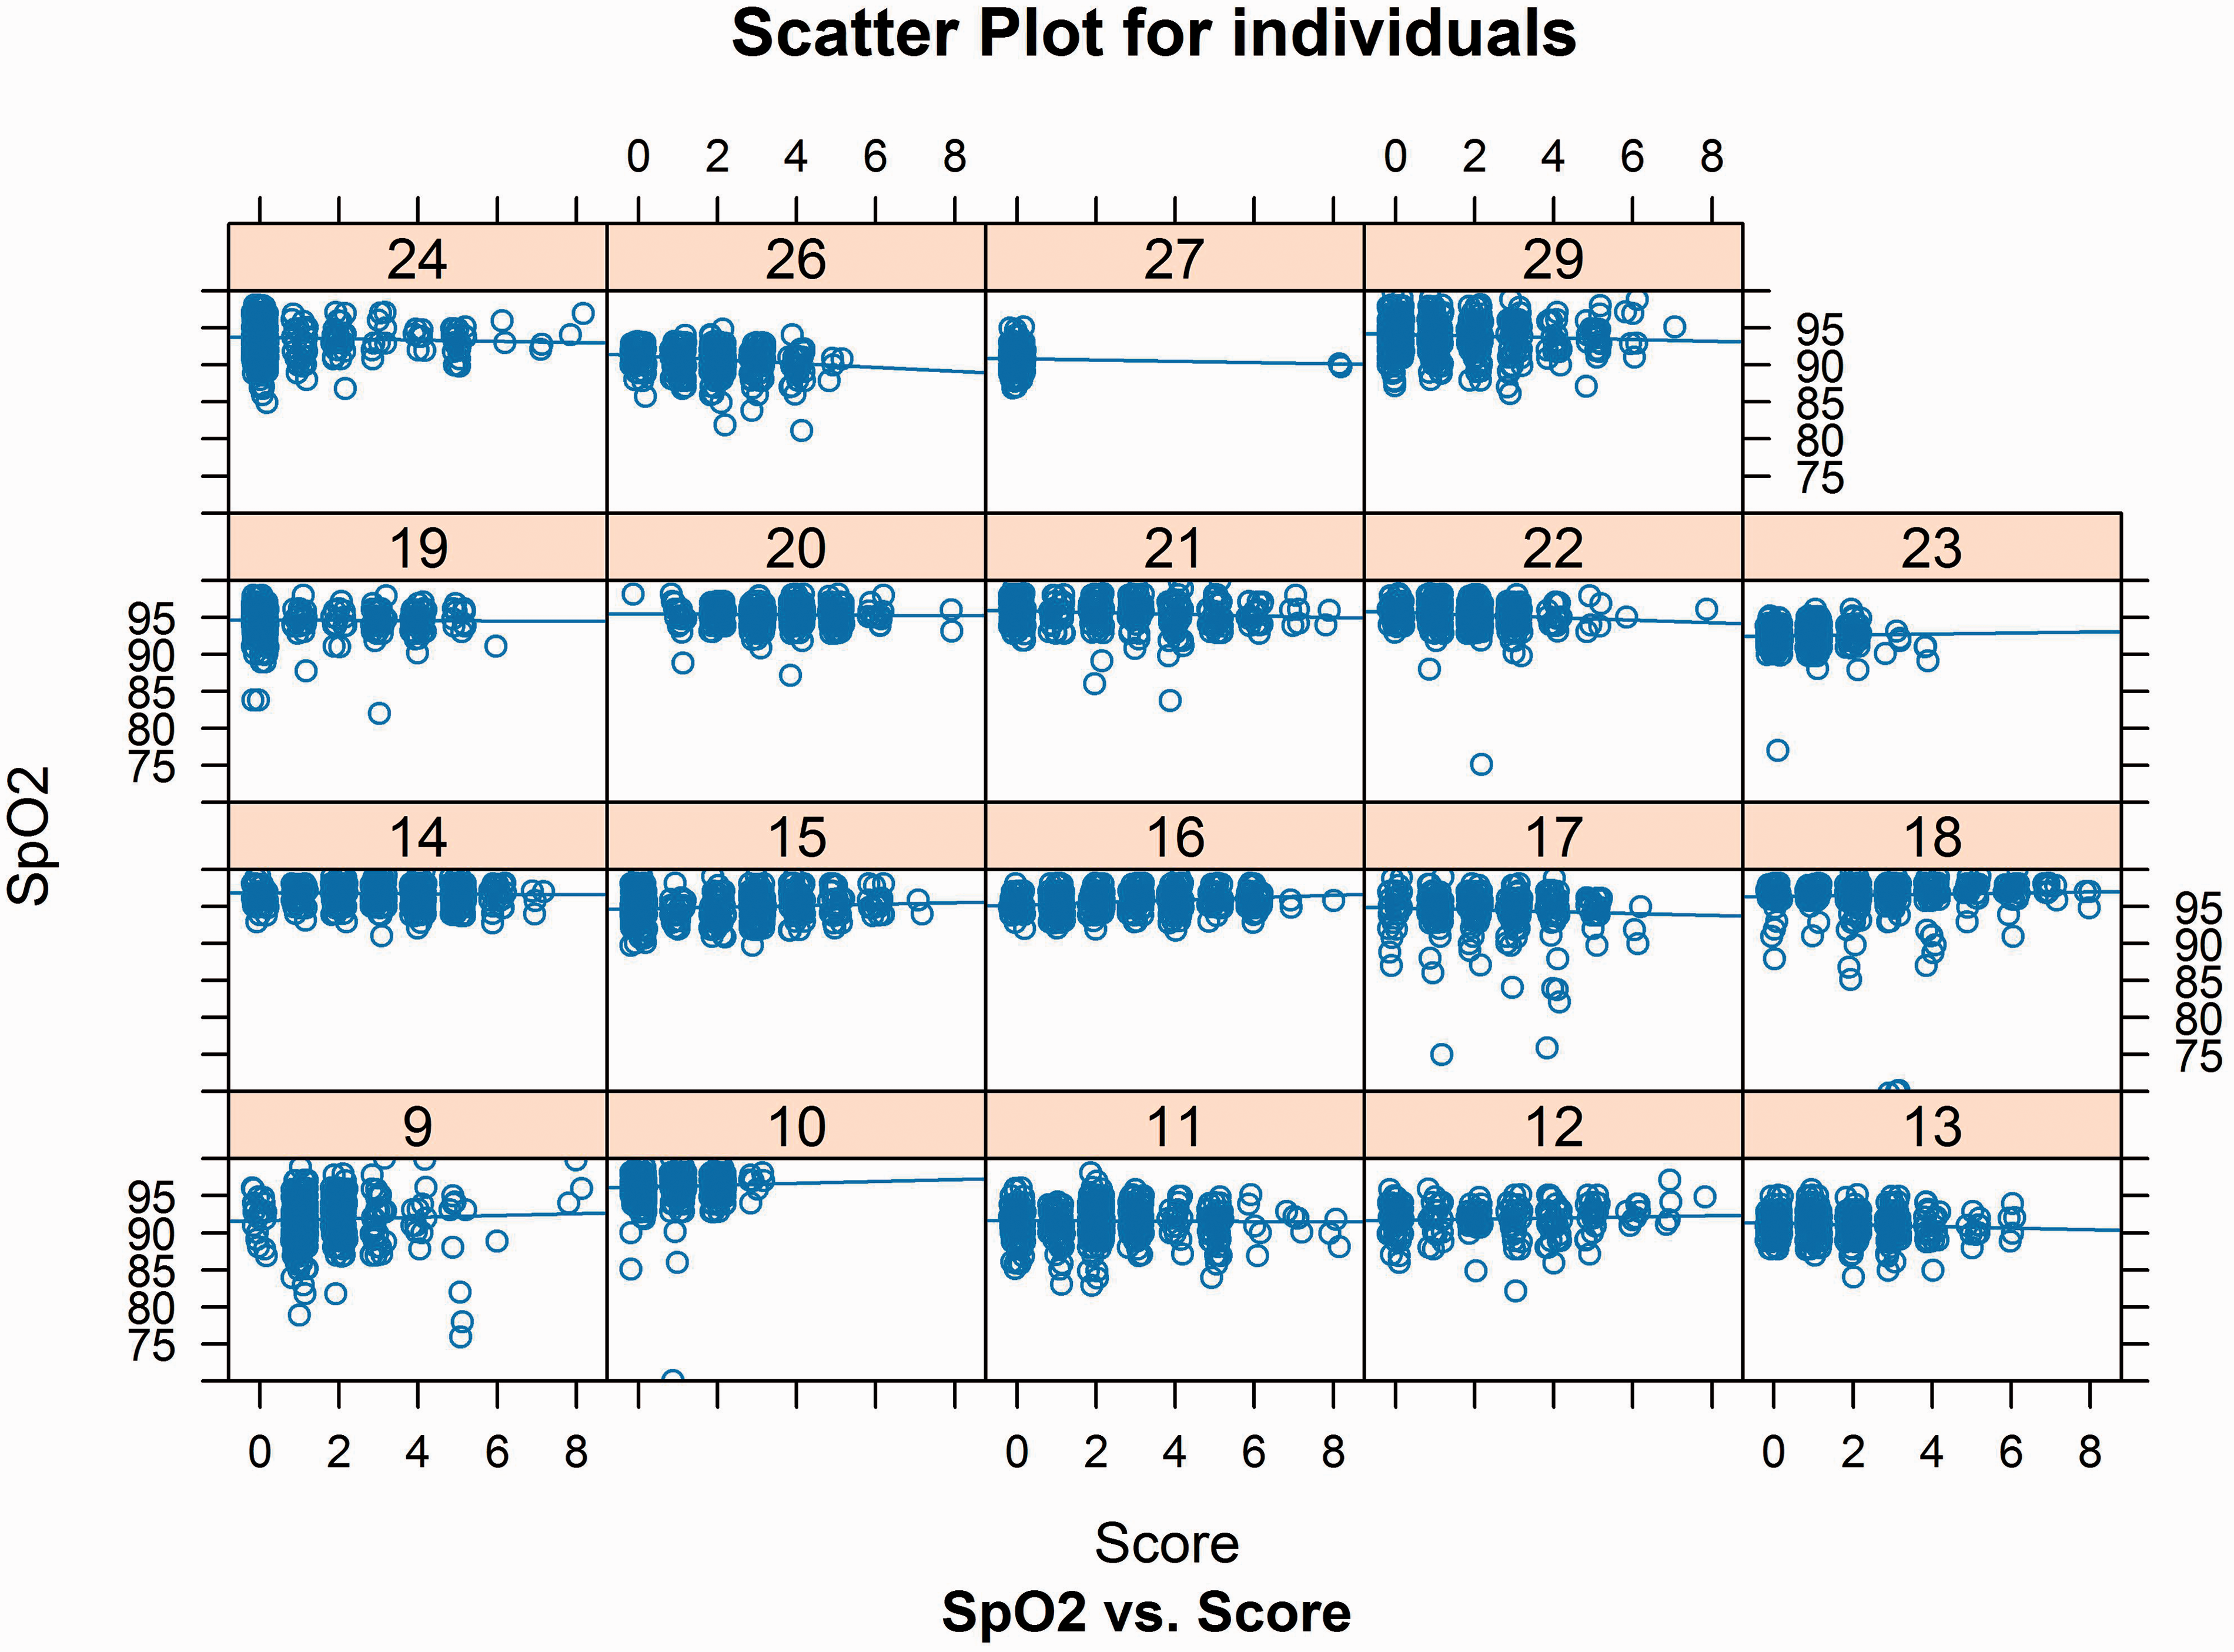

Association between physiological variables and exacerbations
There were 172 treated exacerbation episodes suitable for analysis. The median number of exacerbations was 7 per patient (interquartile range 2 to 14).
The analysis required sequences of data for consecutive days and was restricted to symptom score, pulse rate and SpO2 because FEV1 was only collected intermittently. The mean pulse rate before exacerbation was 87.4 per minute (95% CI: 85.1 to 89.7) and at the start of exacerbation rose slightly to 93.7 per minute (91 to 96.3). Mean SpO2 before exacerbation was 93.6% (93.2 to 94.1), falling to 92.4% (91.9 to 92.9) around the onset of exacerbation. The distributions of changes for each exacerbation are shown in Figure 3. In addition to the 172 treated exacerbations there were 150 episodes of symptoms which met the threshold for exacerbation on one day only and were not treated with antibiotics. Sub-group analysis of the five patients with a pattern of discrete exacerbations interspersed by normality showed that the onset of exacerbations was associated with a rise in pulse and fall in SpO2 of approximately one SD of the between-exacerbation values (data not shown).
Changes prior to commencing antibiotic treatment. (a) SpO2 (b) pulse rate.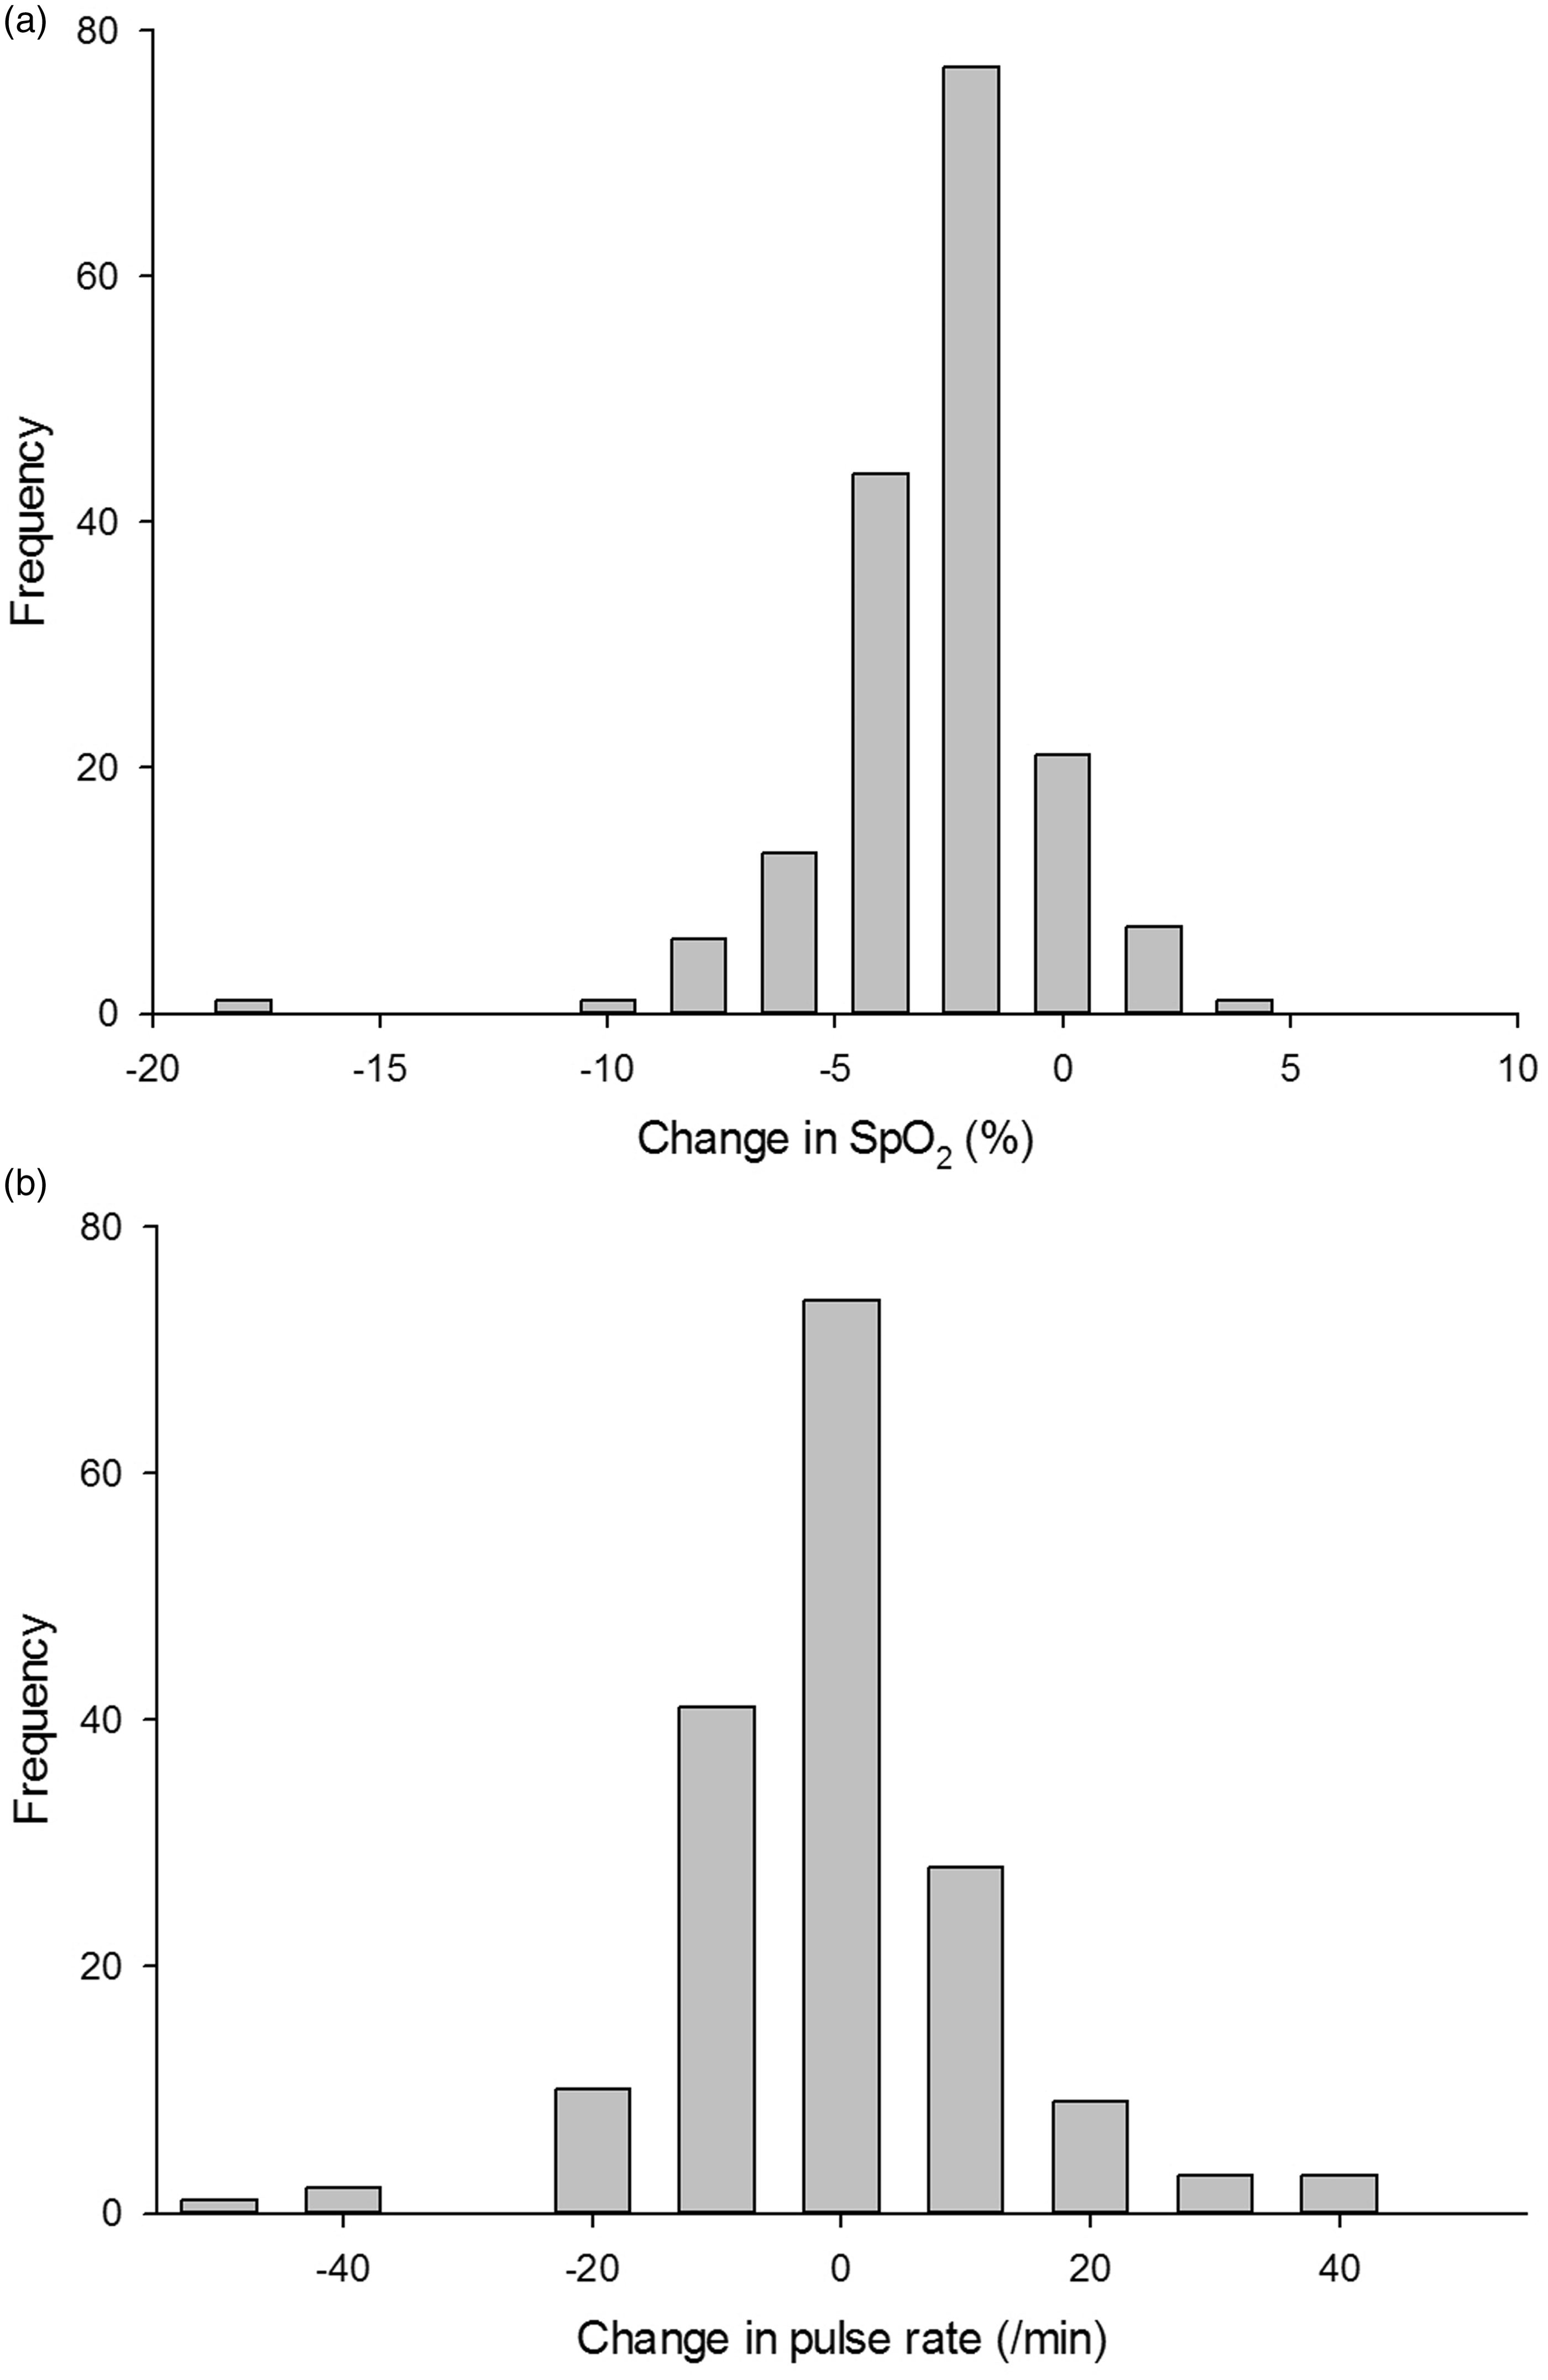
Results of multilevel logistic regression indicating odds ratio for multiple variables predicting exacerbation compared to usual days and single isolated “bad” days.
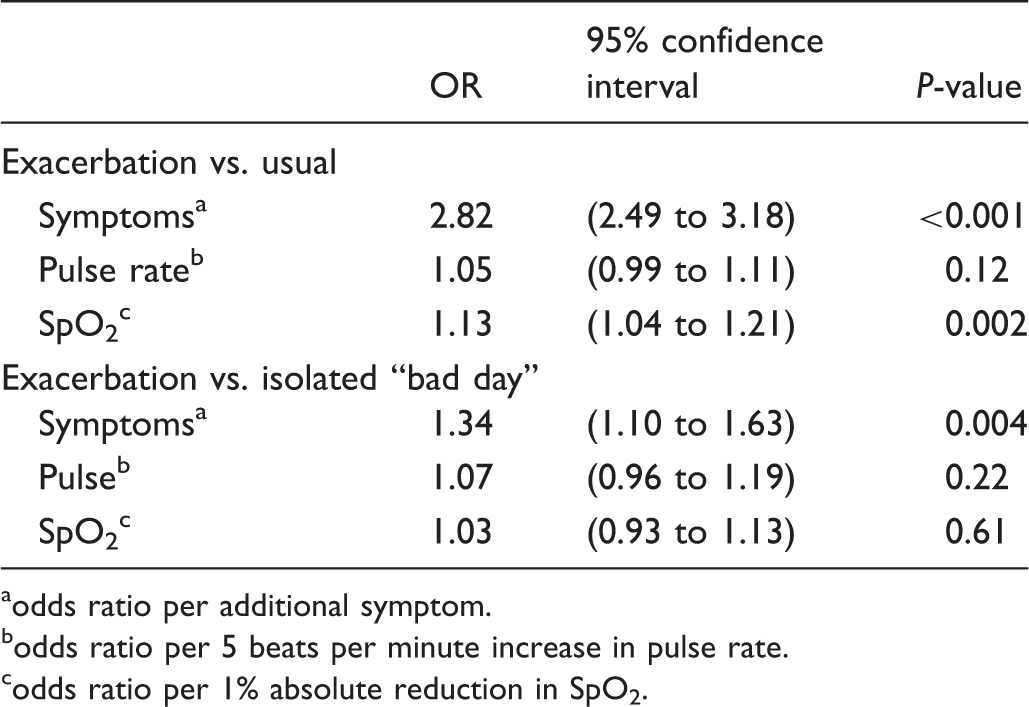
odds ratio per additional symptom.
odds ratio per 5 beats per minute increase in pulse rate.
odds ratio per 1% absolute reduction in SpO2.
Discussion
We found that relatively few of the patients displayed clear patterns of normality and exacerbation. Most had a pattern in which exacerbations recurred frequently or in which symptoms persisted. We found only weak associations between the physiological variables that were monitored and either total symptom score or episodes of exacerbation. Physiological measurements were unable to differentiate between exacerbations and isolated bad days.
Strengths and limitations
The present study was relatively small. Only 19 patients had data for at least 200 days so their clinical condition, exacerbation rate, patterns of telemonitoring data and responses to change in symptoms may not have included all possible scenarios. Thus they may not be typical of a wider population of people with COPD. Nevertheless, they were identified from primary care populations as being suitable candidates for telemonitoring, so they may be representative of patients recruited to telemonitoring services in the UK.
Although we had patients’ self-reported use of antibiotics, we do not know for individual episodes whether they were self-administered or commenced on the advice of a clinician. The globally recognised definition of an acute exacerbation, 8 however, does not distinguish between patient or clinician-initiated changes of medication, so our reliance on subjective data reporting satisfies current guidelines.
Despite recent technological advances, the variables measured have not changed substantially, 12 so it is unlikely that the discriminatory performance of more recent systems will have improved substantially.
Relation to other published work
Telemonitoring has been proposed for ensuring timely management of exacerbations of COPD with the aim of reducing hospital admissions. 13 Much of the evidence to support monitoring, detection and early intervention has been extrapolated from research in patients with COPD who have been trained over a number of studies to maintain an accurate paper symptom diary.2,3,10 Our data suggest that in routine practice only a minority (five out of 19 patients) maintained a symptom diary with discrete episodes of increased symptoms corresponding to treated exacerbations. This has a number of implications. First, nearly half the patients exhibited a rolling pattern of nearly continuous exacerbations and antibiotic treatment: this was reflected in the quantitative data from the pilot study which reported a very substantial increase in antibiotic usage, 4 which raised concerns amongst some of the participants’ general practitioners about over-treatment.4,5 In the subsequent randomised controlled trial the substantial number of alerts, and the trend to increased treated exacerbations did not result in reduced admissions. 7 Conversely, a quarter of the patients seemed to over-ride exacerbations. We do not know whether it was the patient who ignored the symptoms, or their clinician who advised overriding the alarm, perhaps because the overall clinical situation did not warrant treatment. Anecdotally, there were patients who had a very low threshold for reporting symptoms or who misinterpreted “more breathless than usual” (for them) as “more breathless than normal” (for others).
Second, inspection of the charts (see Figure 1) illustrates the problem that many patients have in distinguishing the onset of exacerbations from ‘bad days’.4,5 The patients in our pilot study were trained to monitor their symptoms routinely, yet there was a clear pattern of exacerbations in only one-quarter of them. This suggests that current monitoring tools may not be sufficiently discriminatory for most patients. Other, well-validated, but longer symptom questionnaires may be better, 14 but will need to be shortened for routine clinical use.
Third, the difficulty in identifying exacerbations may be one factor in the equivocal outcomes of trials of self-management in COPD which expect patients to detect and commence treatment for exacerbations.15,16 This difficulty may be the reason for the positive results in some more intensive programmes, 17 compared to negative 18 or adverse outcomes in others. 19
Telemonitoring enables monitoring of physiological outcomes and both patients and their clinicians express considerable confidence in the pulse oximetry.4,5 However, we observed only modest changes in SpO2 and pulse rate associated with exacerbations, limiting its value as a predictor of exacerbations. Hurst et al. suggested that a composite pulse rate and SpO2 score could distinguish exacerbation onset from symptom variation. 10 However we did not find this, possibly because of the much less distinct separation between exacerbations and periods of stability in the datasets from the majority of our participants. The development of convenient technology to monitor variables such as respiratory rate or activity levels, combined with sophisticated personalised algorithms, offers hope for better monitoring protocols in future.
Implications
Our findings have implications for clinicians when considering how they can help patients to improve their ability to establish a baseline and detect changes in symptom scores. Commissioners of services will similarly need to be aware that a proportion of patients with COPD will struggle to detect the changes that underpin telemonitoring. Developers of telemonitoring systems may need to develop improved algorithms.
Conclusion
The present study suggests that only a minority of patients who monitor the clinical condition of their COPD have symptom patterns that distinguish clearly between periods of stability and exacerbations. Oxygen saturation and pulse rate were only weakly associated with symptom score or exacerbations. Until improved algorithms are available, clinicians selecting patients for telemonitoring should assess the patient’s perception of variation in their symptoms and provide careful training and support whilst patients are learning to monitor their condition.
Footnotes
Acknowledgements
We thank the participating patients and general practices, Careline who provided the monitoring, the Wellcome Clinical Research Facility nurses who undertook the data collection, Paddy Corscadden and the NHS Lothian IT team who implemented the technology. Dr Rob Elton provided a statistical opinion. We acknowledge the support of Lewis Ritchie, Chris Griffiths and Anne-Louise Kinmouth. The study was supported by grants from Intel, Tunstall and the Scottish Centre for Telehealth. Hilary Pinnock and Brian McKinstry received Senior Clinical Fellowships from the Chief Scientist Office of the Scottish Government during the course of the project.