
Abstract
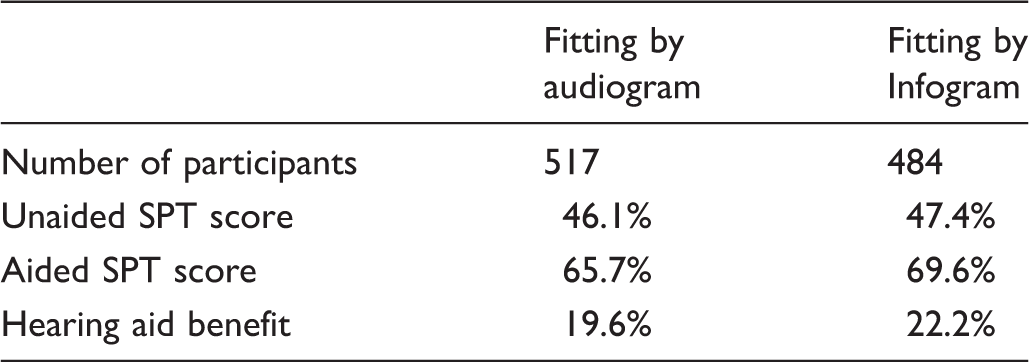
This research was conducted to evaluate the efficacy of an online speech perception test (SPT) for the measurement of hearing and hearing aid fitting in comparison with conventional methods. Phase 1 was performed with 88 people to evaluate the SPT for the detection of significant hearing loss. The SPT had high sensitivity (94%) and high selectivity (98%). In Phase 2, phonetic stimulus–response matrices derived from the SPT results for 408 people were used to calculate “Infograms™.” At every frequency, there was a highly significant correlation (p < 0.001) between hearing thresholds derived from the Infogram and conventional audiograms. In Phase 3, initial hearing aid fittings were derived from conventional audiograms and Infograms for two groups of hearing impaired people. Unaided and aided SPTs were used to measure the perceptual benefit of the aids for the two groups. The mean increases between unaided and aided SPT scores were 19.6%, and 22.2% (n = 517, 484; t = 2.2; p < 0.05) for hearing aids fitted using conventional audiograms and Infograms respectively. The research provided evidence that the SPT is a highly effective tool for the detection and measurement of hearing loss and hearing aid fitting. Use of the SPT reduces the costs and increases the effectiveness of hearing aid fitting, thereby enabling a sustainable teleaudiology business model.
Keywords
Introduction
Hearing difficulties are common and poorly treated in Australia. Approximately 20% of the Australian population have a significant hearing loss and this percentage rises to 50% for people aged 60 years and over. Although some modern hearing aids can alleviate hearing difficulties, less than 25% of people who would benefit from hearing aids actually own them and a high proportion of hearing aids end up “in-the-drawer” instead of “in-the-ear” or “behind-the-ear”. The barriers to improved hearing health in Australia include the high cost of hearing aids purchased through the conventional audiological business model, the inconvenience of the audiological model including distance to the nearest audiologist, the perceived stigma of wearing hearing aids, and the reluctance of 75% of people with hearing difficulty to seek help. Teleaudiology, including online sales and self-fitting of high quality hearing aids supported by high quality and highly accessible services online, presents an opportunity to overcome these barriers. 1 A systematic review of telehealth applications in audiology in 2010 identified only 27 studies that fell within the scope of the review; 2 only one of these investigated the use of hearing aid fitting as an intervention. 3
Much of the cost of conventional audiology is associated with expensive equipment and sound treated rooms, and with the need for people with higher degrees. As with other telehealth initiatives in Australia, acceptance of teleaudiology may be slow in coming, but early adopters are already being attracted to the teleaudiology model. 4 Evidence of effectiveness is required to achieve acceptance and trust in the teleaudiology model from professionals and hearing aid users. The present study was part of a research program conducted over the last three years designed to improve the standard and reduce the cost of hearing health care, thus encouraging more people to become hearing aid users. The intention was to provide scientific evidence that hearing difficulties can be overcome as effectively as the usual approach without the need for expensive equipment or highly trained people, and the specific objective was to evaluate the efficacy of an online speech perception test (SPT) for the measurement of hearing and for hearing aid fitting in comparison with conventional methods.
Methods
Ethics approval for the research was provided by the Royal Victorian Eye and Ear Hospital Research and Ethics Committee, Project 14/1164H, “Maximising speech perception benefits in hearing aid users.”
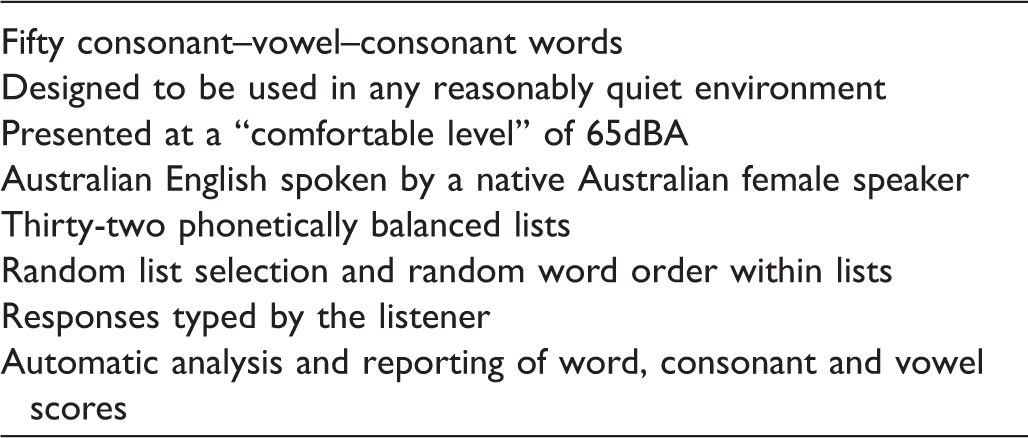
Characteristics of the online speech perception test (SPT).
Phase 1: evaluation of the SPT for the detection of hearing loss
A pilot study was performed with 39 people known to have good hearing and 49 hearing aid users to assess the sensitivity and specificity of the SPT for the detection of significant hearing loss. The participants with good hearing performed the SPT online without supervision and the hearing aid users performed the SPT without their hearing aids in a sound treated booth under controlled conditions.
Phase 2: evaluation of the SPT as a measure of hearing loss
The SPT has been used in addition to standard audiograms with hundreds of clients in the Blamey Saunders clinic for the purpose of measuring hearing loss. Information transmission analysis was applied to phonetic stimulus–response matrices derived from SPT results to generate an “Infogram™” for each SPT (Figure 1).
7
Analysis of data for 408 people with both an unaided SPT and an audiogram using Principal Components Analysis and Multiple Regression yielded a method of predicting a “speech audiogram” from the Infogram.
8
In the statistical analysis reported here, the mean differences and standard deviations of the differences between speech audiograms and conventional audiograms are reported, together with the correlations between the two types of hearing thresholds at nine audiological frequencies.
An Infogram representing a listener's SPT result. The Infogram shows the percentage of information transmitted for a series of speech features arranged with low-frequency features on the left to high frequency features on the right. The aggregate scores were 18 vowels out of 50, 31 consonants out of 100, and 6 whole words correct out of 50.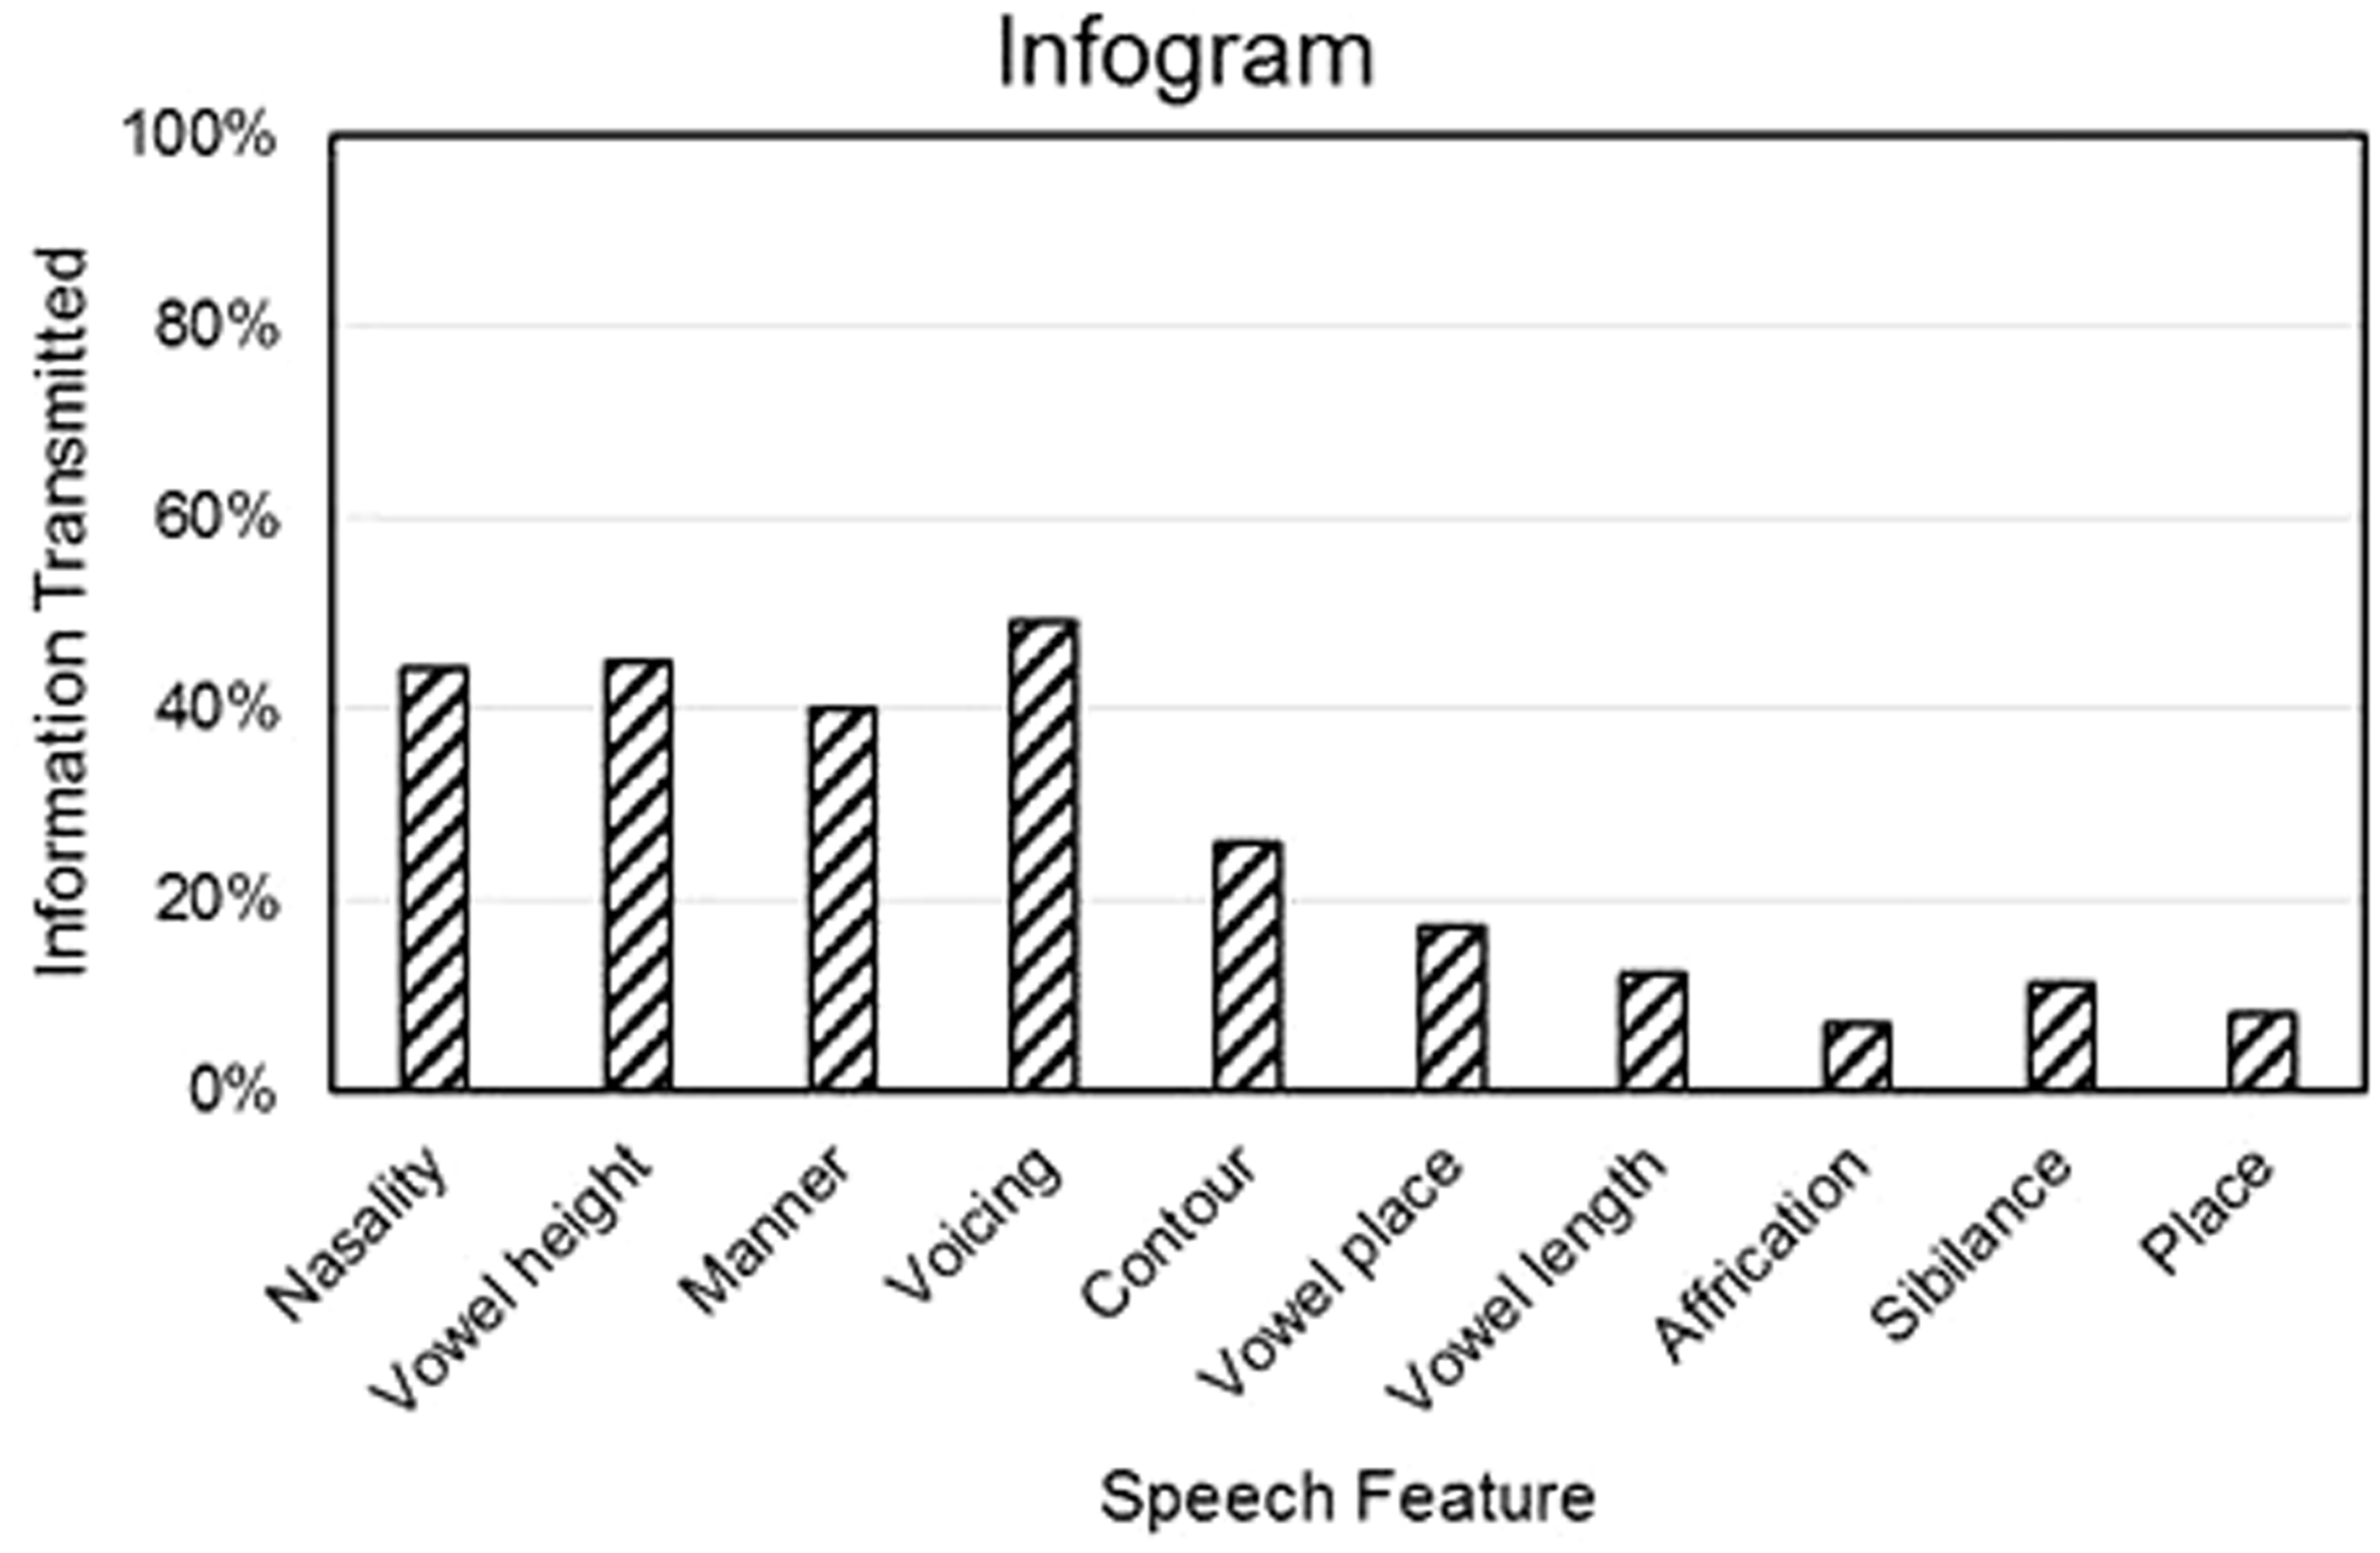
Phase 3: evaluation of the SPT for hearing aid fitting
A retrospective analysis of data was conducted for 1001 users of Blamey Saunders hearing aids from July 2013 to June 2015 who had performed both aided and unaided SPTs either online or in the clinic. The difference between the aided and unaided word scores was used as a measure of benefit of the hearing aids. Hearing aid fittings performed from July 2013 to June 2014 were derived from conventional audiograms. Hearing aid fittings after June 2014 were derived from Infograms alone or Infograms and audiograms together if an audiogram was available. A two-sample t-test was used to compare the hearing aid benefit for the two groups.
Results
Phase 1
Figure 2 shows that the distributions of word scores for the 49 hearing aid users and the 39 people with good hearing overlapped to a small extent. When the criterion for “good hearing” was set at 44 or more words correct, and the criterion for a “significant hearing loss was set at less than 44 words correct, then the SPT gave 94% sensitivity to significant hearing loss (46 out of 49 hearing aid users correctly identified), 100% specificity (39 out of 39 people with good hearing correctly classified), and 98% accuracy (85 out of 88 people correctly classified).
Histogram of SPT word scores for two groups of listeners.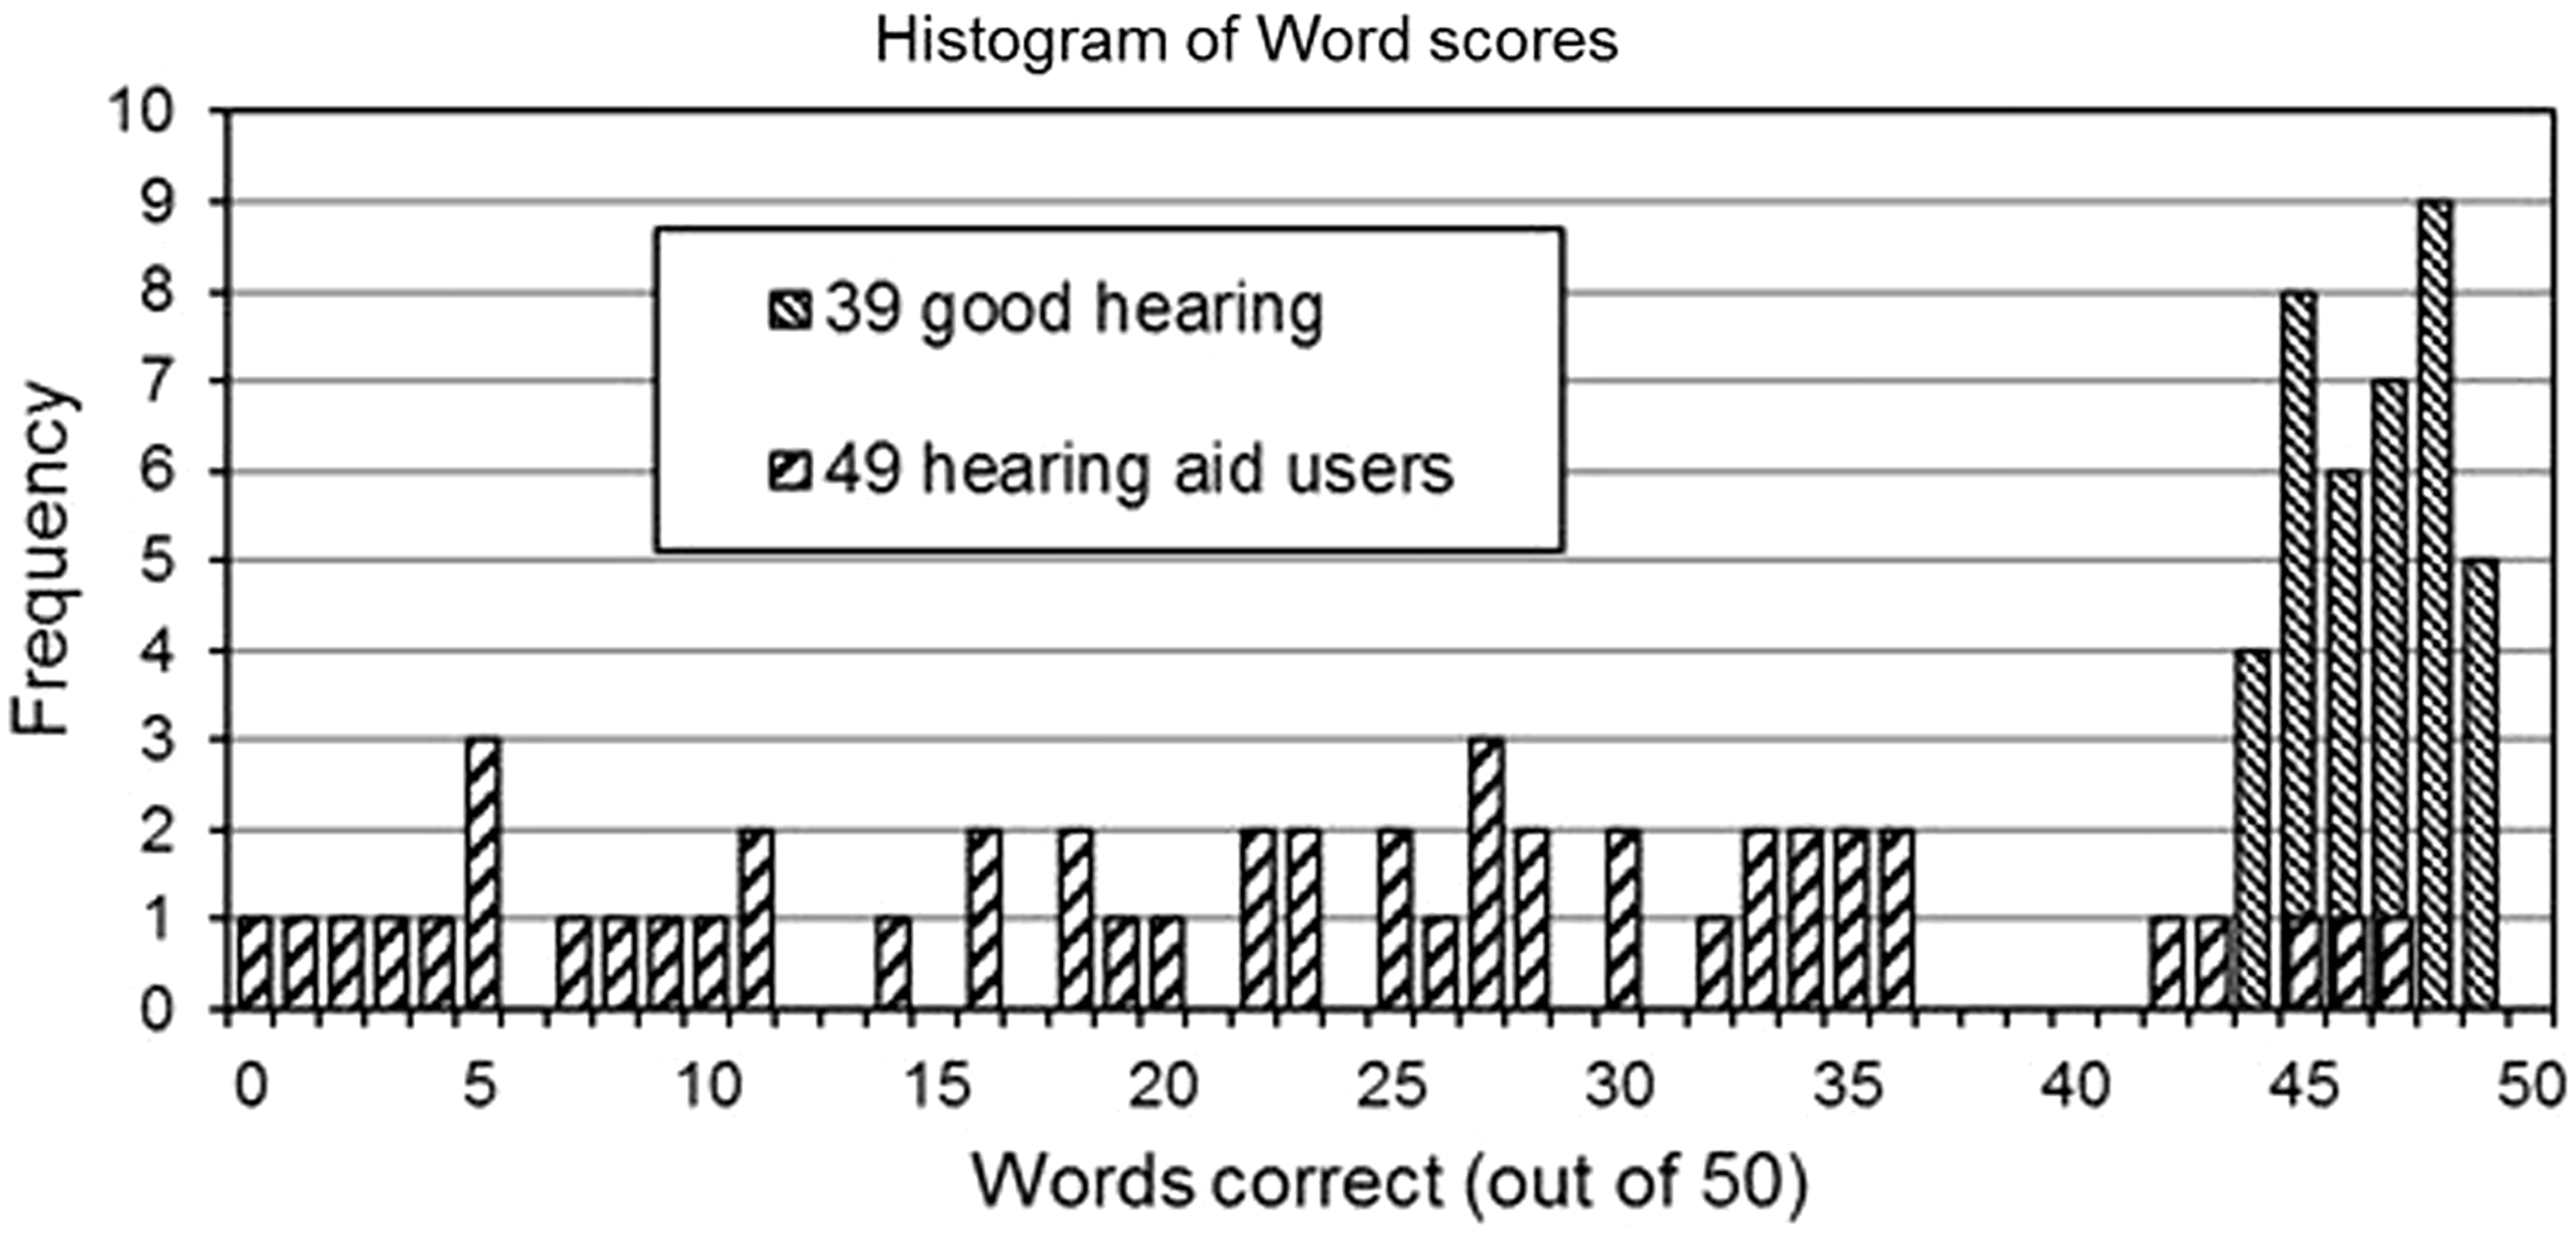
Phase 2
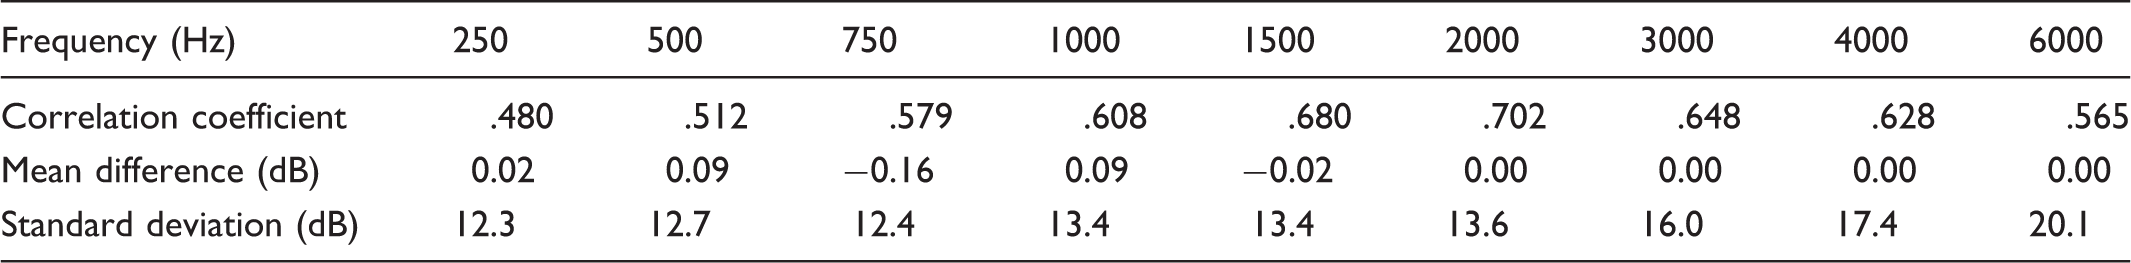
The speech audiogram values derived from Infograms fell reasonably close to the conventional audiogram values for the better ear. This is illustrated in Figure 3 for a typical hearing aid user. Table 2 shows the correlation, mean difference, and standard deviation of the difference between the speech audiogram and the conventional audiogram hearing thresholds at each of the standard audiological measurement frequencies. The correlation was highly significant (p < 0.001) at every frequency.
Comparison between a speech audiogram calculated from the Infogram in Figure 2 and conventional audiograms for the same listener. The speech audiogram lies close to the listener's better (right) ear audiogram. The left ear audiogram is shown for reference. Statistical comparison of 408 speech audiograms and conventional audiograms.
Phase 3
Mean results for the evaluation of benefit from hearing aid fitting.
Discussion
Phase 1
The sensitivity and specificity of the SPT compare favourably with 80% and 83% respectively for the widely used telephone digits in noise screening test. 9 The SPT result has the added advantage over the conventional audiogram that it is easily understood by the listener that missing more than 10% of words in quiet conversation represents a significant hearing difficulty.
Phase 2
The results in Table 2 and Figure 3 show that the Infogram and speech audiogram derived from the SPT contains frequency-specific information about the listener's hearing. Not every speech audiogram was as close to the better ear conventional audiogram as in the example of Figure 3. This is not surprising given that the SPT is performed at a suprathreshold intensity level and it is well-known that there are large variations in suprathreshold hearing for people with the same hearing thresholds. 10 It was also clear from the analysis that the speech audiograms for people with mild, moderate, and severe hearing loss were closer to conventional audiograms than those for people with near-normal hearing or profound hearing loss where the SPT was affected by ceiling and floor effects respectively. This approach to hearing measurement is a large step forward compared with previous studies that have used conventional equipment at remote locations controlled by clinicians at a central location. 11 The latter approach would be necessary for complex clients, but is not required for the majority of people with mild to severe hearing loses.
Phase 3
The hearing aid fittings based on the SPT provided at least as much benefit as fittings based on conventional audiograms. This is an important result, as it demonstrates for the first time that prescriptions based on the audiogram are not the only way (and perhaps not the best way) to fit hearing aids, and enables the costs and complications of audiometric testing to be avoided for most people with mild-to-severe hearing loss. In addition to its utility in fitting hearing aids, the SPT demonstrates the benefit of hearing aids to the client in a meaningful way.
Limitations
When used as a measure of hearing, the SPT should be performed under controlled conditions. If the SPT is presented at a level greater or less than 65dBA, the speech audiogram may under- or over-estimate the hearing loss. When the SPT is performed in free field with binaural listening, the speech audiogram represents the estimated hearing thresholds in the better ear. Monaural thresholds may be estimated with monaural presentation under headphones. The current SPT is designed for native speakers of Australian English with a full adult vocabulary. Reduced performance has been observed for non-native English speakers, for people with non-Australian accents, and for children.12,13
It is well known in the developed world that the hearing aid market is only 25% penetrated (or potentially less) by the conventional audiology service model. 14 Eikelboom and Atlas found that 32% of 116 people surveyed in Australian audiology centres would be willing to use telemedicine services. 4 If this percentage also applies to people who do not use audiology centres, there is a very good chance that the teleaudiology approach may have a substantial impact on hearing health in Australia. This conjecture is consistent with Blamey Saunders experience since 2008 where a large proportion of our clients are first-time hearing aid users and over 50% of our clients use our teleaudiology services in preference to our conventional audiology clinic.
Conclusion
The three-phase study provided scientific evidence that the SPT is an effective tool for the detection and measurement of hearing loss and for hearing aid fitting and therefore hearing difficulties can be overcome without expensive equipment or highly trained people.
Footnotes
Acknowledgements
The authors wish to acknowledge the long-term contributions of others in achieving the outcomes described here, including our colleagues at The University of Melbourne, the Bionics Institute, Dynamic Hearing Pty Ltd (now part of Cirrus Logic), Swinburne University, the audiologists and audiometrists who worked with the participants in these studies, and the hearing aid users themselves.
Declaration of Conflicting Interests
The authors declared the following potential conflicts of interest with respect to the research, authorship, and/or publication of this article: the authors are employees and/or co-owners of Blamey and Saunders Hearing Pty Ltd, the company that developed the teleaudiology business model and the hearing aid fitting methods that are the subject of this paper, with honorary positions at the Bionics Institute, The University of Melbourne, and Swinburne University.
Funding
The authors disclosed receipt of the following financial support for the research, authorship, and/or publication of this article: the work was supported by Blamey and Saunders Hearing Pty Ltd with government assistance from a Commercialisation Australia grant, a Victorian Technology Voucher, and the R&D tax incentive. Blamey and Saunders Hearing Pty Ltd is a “profit for purpose” company whose purpose is to improve the hearing health of Australians using a sustainable business model. The Bionics Institute acknowledges the support it receives from the Victorian Government through its Operational Infrastructure Support Program.