
Abstract
Longitudinal blood- and cognitive data from 879 adults were analyzed to extract a multidimensional health structure for prediction of cognitive change. Six health components were identified and replicated at two waves. Following, cognitive outcomes were regressed on the health components. Large proportions of cognitive age related variations were accounted for by baseline health in both cross-sectional and prospective analyses. Less variation was accounted for when health change and cognitive change were contrasted. Cardiovascular health was particularly important for prediction of cognitive change. Our study underlines causal relations between health and cognitive functions, and suggests that some effects are long term.
Good health is of vital importance for everyday life and is considered a basic human right by the World’s Health Association (HEALTH21, 1998). Aging per se means increased risk for poor health, but declining health is not equivalent to normative aging. Importantly, health and cognition have a parallel development throughout the adult life span, and both often start to decline around the sixth decade of life (Wahlin, 2004). However, health has important explanatory value for cognitive decline. Many studies focus on how single health indicators may account for age-related cognitive decline. Few studies focus on health as a multidimensional concept.
There is a large variation in cognitive performance, involving both stability and change, across the adult life span. Furthermore, there are many potential predictors of both interindividual and intraindividual variations in cognitive development during aging. Most likely, many factors such as genetic, lifestyle, environmental, sociodemographic, and health factors interact and affect cognition throughout the life span.
In the past, chronological age has been considered as one of the most vital predictors of cognitive performance throughout the life span. Contrasting, data from a more recent longitudinal Canadian study indicate that both health and biological ages are more important for prediction of cognitive decline than chronological age (Wahlin et al., 2006).
There is growing evidence supporting that various systemic syndromes and single health parameters affect cognition. Studies associate somatic conditions such as metabolic syndrome (Yaffe et al., 2004) and other cardiovascular disease markers at subclinical levels (Fahlanderet al., 2000) with cognitive decline. Hypertension is one of the single most studied health conditions in this context, and several studies associate cognitive decline with poorly controlled blood pressure. This holds for children, adolescents, and younger and older adults alike (Lande et al., 2003; Waldstein, 1995). Recently, studies show a link between body mass index (BMI) and cognitive decline (e.g. Dahl et al., 2009). Longitudinal data from the Whitehall II study associate both overweight and underweight in early adulthood, to poorer cognitive performance in midlife (Sabia et al., 2009).
Diabetes type II, characterized by hyperglycemia, and reduced insulin sensitivity have potential to affect cognition in a negative direction according to both cross-sectional (Yeung et al., 2009) and longitudinal findings (Noyens et al., 2010). Cross-sectional data of healthy adults demonstrate also that blood glucose and long-term glucose (glycosylated hemoglobin (HbA1c)) on subclinical levels affect cognition (Nilsson and Wahlin, 2009).
Findings regarding lipid level effects on cognition are somewhat conflicting. The direction of the associations might vary with age since the effects of high lipid levels on cognitive ability are more pronounced before the age of 65 years (Reynolds et al., 2010). Studies associate increased levels of high-density lipoproteins (HDLs) with superior cognitive function (Atzmon et al., 2002) and low plasma levels of high-density lipoprotein (HDL) cholesterol are associated with cognitive decline in older adults (Atzmon et al., 2002; van Exel et al., 2002). In a 4-year follow-up on elderly women, high low-density cholesterol (LDL) and total cholesterol were associated with cognitive impairment (Yaffe et al., 2002), and high cholesterol counts were risk factors for mild cognitive impairment in late life in a population-based study (Kivipelto et al., 2001). Furthermore, cross-sectional data from young and middle-aged men linked low serum LDL, HDL, and totalcholesterol with poorer cognitive performance(Zhang et al., 2004).
Several studies relate markers of inflammation to cognition. Most of those studies are based on data from elderly using serum interleukin-6(Il-6) and c-reactive protein (CRP) levels. The relationship is consistent in large longitudinal studies of well-functioning elderly, associating higher CRP and Il-6 levels with cognitive decline (Weaver et al., 2002; Yaffe et al., 2004). Other markers of inflammation are more sparsely examined in relation to cognitive ability. Cross-sectional findings show a link between low albumin and hemoglobin plasma levels and poor cognitive performance in older adults. The same negative cross-sectional relation was reported in a large population-based study using albumin (Llewellyn et al., 2010). Contrasting, no association was found between hemoglobin and cognitive decline in a longitudinal study of older women (Atkinson et al., 2005). A large population-based study of cross-sectional data from Swedish army draftees associated the erythrocyte sedimentation rate (ESR) with reduced cognitive ability already in the age of 18–20 years (Karlsson et al., 2010).
Changes in thyroid function, within both the pathological and normal ranges, can influence cognitive function. Both cross-sectional and longitudinal data from the Kungsholmen study associated the alterations of thyroid hormones and cognition in the elderly (75–96 years). Cross-sectional data indicated a relation between higher levels of thyroid-stimulating hormone (TSH) and more favorable performance on episodic memory tasks (Wahlin et al., 1998). These findings were later confirmed by longitudinal data (Wahlin et al., 2005). No relations between thyroxine and cognition were found in these studies.
The effects of low vitamin B12 and/or folate (B9) levels on cognitive functioning are well documented (e.g. Wahlin et al., 1996). In short, both cross-sectional and longitudinal studies have provided evidence for an association between these vitamins and many aspects of cognitive performance, especially in older adults and clinical populations (see Calvaresi and Bryan, 2001, for an overview).
There are few studies using a multivariate approach to physical health. When health is conceptualized in a multidimensional manner, three approaches are frequently taken: a medical or physical model, a functional or social definition model, and a psychological or subjective evaluation model. A number of studies have evaluated interrelations and validity of those constructs (e.g. Whitelaw and Liang, 1991).
A handful of studies have used a factor analysis approach to assess underlying constructs of specific conditions such as metabolic syndrome and insulin resistance syndrome (Ghosh, 2005; Kue Young et al., 2002; Li and Ford, 2007). To our knowledge, the present study is the first attempt to explore whether there is an underlying pattern of health in objective biomedical laboratory and clinical assessment data, and hence, also the first to investigate whether the structure can predict alterations in cognition across several measurement occasions. We aim at studying health from a multidimensional perspective using several medical parameters of health from the population-based prospective Betula study.
First, we wanted to explore whether an underlying structure of health was present in our laboratory data. Second, we hypothesized that health would mediate more age-related variations in the cross-sectional analyses than in the longitudinal analyses. The finding that accounts of cross-sectional age variance extraction generates more significant results than longitudinal analyses is well established (Hofer et al., 2003; Lindenberger et al., 2011; Sternäng et al., 2010).
Third, we expected baseline health to predict cognitive development across measurement occasions, since our biological indicators are expected to also produce long-term effects on cognitive performance (e.g. HbA1c). Fourth, we hypothesized that if longitudinal associations were detected, they would not be entirely reflected by parallel change in health and cognition. Rather, we expected that change between the first two measurement intervals would generate alterations in cognitive functioning in the following measurement interval. By these hypotheses, we assume that change in biological function causes differences in cognitive function rather than the reversed causal direction.
Methods
Design
The Betula study is a population-based study designed to measure cognitive function and health in adults across the life span. It is a longitudinal study on aging, memory, and dementia; has been going on for 20 years; and involves several samples. The present study concerns sample 1 (S1). The participants have been tested, interviewed, and examined medically at five occasions (1988–1990, 1993–1995, 1998–2000, 2003–2005, and 2008–2010). The subjects are divided into 10 different age cohorts: C1, C2, C3, …, C10. Subjects belonging to C1 were born in 1953–1954, subjects in C2 were born in 1948–1949, and so on in five-year backward intervals to C10, which consists of subjects who were born in 1908–1909. There were 100 subjects in each cohort on the first test occasion, equally distributed across men and women. For more detailed information about the Betula study and design, see Nilsson et al. (1997).
Participants
The participants were randomly sampled from the population registry in Umeå in the northern part of Sweden. Umeå is a medium sized city with a population of approximately 100,000 inhabitants. Each participant was assessed with a battery of clinical and self-report instruments targeting cognitive function, demographic factors, and selected indices of health. Persons sampled were first contacted by mail, followed by a telephone call to make appointments for health examination and memory testing 1 week later. In this letter, it was explained that how the name of each participant had been obtained; that participation was voluntary and could be interrupted at any time; that the health examination and the memory testing would each take 1.5–2 hours; and that all results would be kept in a coded, unidentifiable format. The goal of the sampling was to obtain 1000 participants in each sample with a similar male/female ratio for each age cohort reflecting that of the population. People with dementia, Down’s syndrome, serious vision or hearing impairments, and a first language other than Swedish were excluded and replaced by another person from the pool.
The present study involves a sample of 879 nondemented adults from (S1) who participated in the first, second, and third waves of data collection (T1, T2, and T3). Participants meeting the diagnostic criteria for dementia according to Diagnostic and Statistical Manual of Mental Disorders (4th ed.; DSM-IV) at wave 2 or 3 were excluded (N = 78). Also, because of the strong impact of hypothyroidosis or hyperthyroidosis on cognitive functioning, persons with TSH or free thyroxine values outside of the normal range (±2.5 standard deviation (SD)) at T1 or T2 were excluded (N = 43).
Participants were equally distributed across 10 age cohorts: 35, 40, 45, 50, 55, 60, 65, 70, 75, and 80 years of age when first tested at wave 1 (T1; 1988–1990). The second data wave (T2) occurred 5 years later (1993–1995) (age range: 40–85 years) with a return rate of 86 percent. The third data wave (T3) was carried out between 1998 and 2000 (age range: 45–90 years). The return rate at T3 was 85 percent. Data from 879, 756, and 613 participants at T1, T2, and T3, respectively, were analyzed. Missing data on both independent and outcome variables were <5 percent. Missing cognitive data were replaced using the estimation maximization (EM) method in SPSS 19, such that replacement of missing values was based on the tasks contained in the composite scores described in the following.
Measures
The memory tasks were administered during two test sessions, which lasted between 1.5 and 2 hours for each participant. All participants were individually tested. Composite scores were derived from 11 episodic recall tasks, 3 recognition tasks, and 4 fluency tasks. Block design from the Wechsler Adult Intelligence Scale (Wechsler, 1981) was used as a single measure and indicator of spatial ability. The division of tasks into recall and recognition memory tasks is supported by a previous confirmatory factorial approach (Nyberg et al., 2003).
Episodic recall
Recall of actions
Subjects were exposed to 16 verb -nouns sentences, all describing a basic action (e.g. lift the book), and were asked to perform the actions in an 8-s interval. The next list was learned with no enactment. These orders were counterbalanced across participants. The nouns of the sentences were divided into four different semantic categories. A free recall test of the sentences was followed. The number of sentences (correct verb and noun) were included in the composite scores.
Cued recall of nouns
Participants were asked to divide the 32 sentences into eight semantic categories. They were informed about that these might be serve as cues to remember the nouns.
Sentence recall
Participants were asked to recall as many as possibly of 16 verb–noun sentences verbally encoded earlier in the test session.
Activity recall
At the end of the second test session, the subjects were asked to describe as many as possible of the 27 tasks that they were exposed to in the second session.
Item and source recall
Subjects were presented with fiction statements about famous and nonfamous people. The fictive statements were presented in different conditions: auditorily or visually. Statements were represented to questions that could be answered on the basis of previous knowledge derived from the previous test situation or general knowledge. For each item, the subject was also asked to report the medium through which the information was originally presented. They were asked to report both intra-experimental sources (e.g. printed on a yellow or red card) and extra-experimental sources (e.g. papers and books). Number of correct items and source responses were noted.
Recall/divided attention
Subjects were presented with four different wordlists, all including 12 nouns. The items were read out loud at a pace of 2 s/item. Afterward, subjects reported as many words as possible at a given pace (2 s/word), indicated by a metronome. For one list, the study/retrieval was performed under full attention. Study retrieval in the other lists was combined with performing a secondary task. This task consisted of sorting red and black cards into piles based on colors. In one task, division of attention was applied at study but not retrieval. In another condition, the distraction was applied at the retrieval phase but not at the study condition. In a final condition, distraction occurred both at study and at retrieval of words. The order between the four conditions was counterbalanced across subjects.
Episodic recognition
Face/name recognition
At the second test session, the subjects were silently exposed to 16 photographs of children’s faces (8 s/photo). There was a Swedish first and surname typed below the photo. About 45 minutes into the session, participants were shown 24 photographs of 12 exposed and 12 unexposed faces, randomly intermixed. The participants made an old and new judgment in response to each face, and they were asked to identify. For each face that they judged to be old and for each missed target face, they were asked to identify the names from the list of four alternatives (first and family names). Number of hits minus false alarms for faces and number of hits for family names were used to index performance.
Recognition of nouns
About sixty minutes into the second test session, participants were presented with a list of 23 nouns. Half of the nouns were from the enacted and nonenacted sentences studied earlier with eight nouns from each condition, and the 16 other nouns served as distractors. The final measures used were the sum of hits minus false alarms.
Verbal fluency
Semantic fluency
Two measures of category fluency were used. In the first task, the participants were asked to say as many professions as possible with the initial letter B during 1 minute. In the second task, they were asked to produce five-letter words of animal names with the initial letter S.
Phonemic fluency
Two tests of which subjects generated as many words as possible in 1 minute were used. In the first condition, participants said as many words as possible with the initial letter A. In the next condition, participants generated as many words as possible with the starting letter M, containing five letters.
Spatial ability
The block design test from the Wechsler Adult Intelligence Scale (Wechsler, 1981) was used as an indicator of spatial ability. The participants had to place red and white blocks such that they were in line with a target pattern. Standard procedures were applied.
Medical assessment
Collection of 40 mL venous blood from each participant was performed between 7 a.m. and 7.30 p.m. by a nurse. Owing to this range of blood sampling hours, subjects were not fasting. Three months after the first examination, the participant returned to Umeå University Hospital to provide another 25 mL blood. Totally, 55 mL were used for complete blood workup (chemistry) and 10 mL were kept deep frozen for future analyses. Blood pressure measures were conducted at both measurement points (T1 and T2). Resting blood pressure was performed using auscultatory method, in lying position, after5 minutes of rest, and in the majority of cases in the right arm. A sphygmomanometer and cuff of normal size, and a stethoscope, were used. Length and weight were measured by a nurse for latter calculation of BMI. BMI was calculated as weight (kg)/height (m2).
Biochemical analyses
Total serum cholesterol and triglyceride, thyroxine, TSH, B12, folate (B9), albumin, hemoglobin (Hb), ESR, glucose, and HbA1c concentrations were analyzed by the Clinical Chemistry Laboratory at Umeå University Hospital.
Triglycerides and cholesterol were analyzed by a colorimetric method on a Hitachi 717 (Boehringer Mannheim). Hba1c concentrations were determined using boronate-affinity chromatography using cation-exchange high pressure liquid chromotography (HPLC). Genomic DNA was separated from the whole blood using standard technique. Glucose was analyzed by a hexokinase method on a Hitachi 911 (Boehringer Mannheim). Vitamin B12 and folate (B9) were determined using DPC dual count (Boil protocol) and by a radioimmunoassay method on the Quantaphase II B12/Folate Radioisotope Dilution Assay (Bio-Rad Diagnostics Group, Hercules, CA, USA). The modified Westergren method was used for measurement of ESR. Hb was analyzed with a cyanide method on Coulter C, Coulter S, and Coulter S+. Albumin was analyzed on SMA II (Technicon) and Hitachi 717. Thyroxine was analyzed on Amerlex-M RIA (Amersham) and AxSYM (Abbott). TSH analyses were performed on Milenia Kinetic EIA System (DPC) and AxSYM.
Statistical analyses
Fourteen health-related variables, known to impact cognition, were chosen for principal component analysis (PCA): BMI, systolic blood pressure (SBP), diastolic blood pressure (DBP), triglycerides, cholesterol, glucose, HbA1c, TSH, thyroxine, B12, serum folate (B9), albumin, Hb, and ESR.
All cognitive test results were converted into standard score units (Z). We created composite scores for episodic recall (11 tasks), recognition (3 tasks), phonemic fluency (2 tasks), and semantic fluency (2 tasks), by summing and averaging measures. Block design was kept as a single indicator variable, but for the purposes of comparisons also converted to Z scores. All respective measures of episodic recall and recognition and fluency were significantly intercorrelated (p s < .01), respectively, at all measurement points, ranging r s from .175 (between the semantic fluency tasks) to .740 (free and cued recall of verb and nouns). Descriptive statistics of independent variables (blood-work, blood pressure, BMI, and demographics) are shown in Table 1, and descriptive statistics of the cognitive variables are displayed in Table 2.
Descriptive statistics of demographics and blood-work.

SD: standard deviation; DBP: diastolic blood pressure; SBP: systolic blood pressure; BMI: body mass index; HbA1c: glycosylated hemoglobin; Hb: hemoglobin; ESR: erythrocyte sedimentation rate; TSH: thyroid-stimulating hormone.
Descriptive statistics of cognitive variables (Z scores).
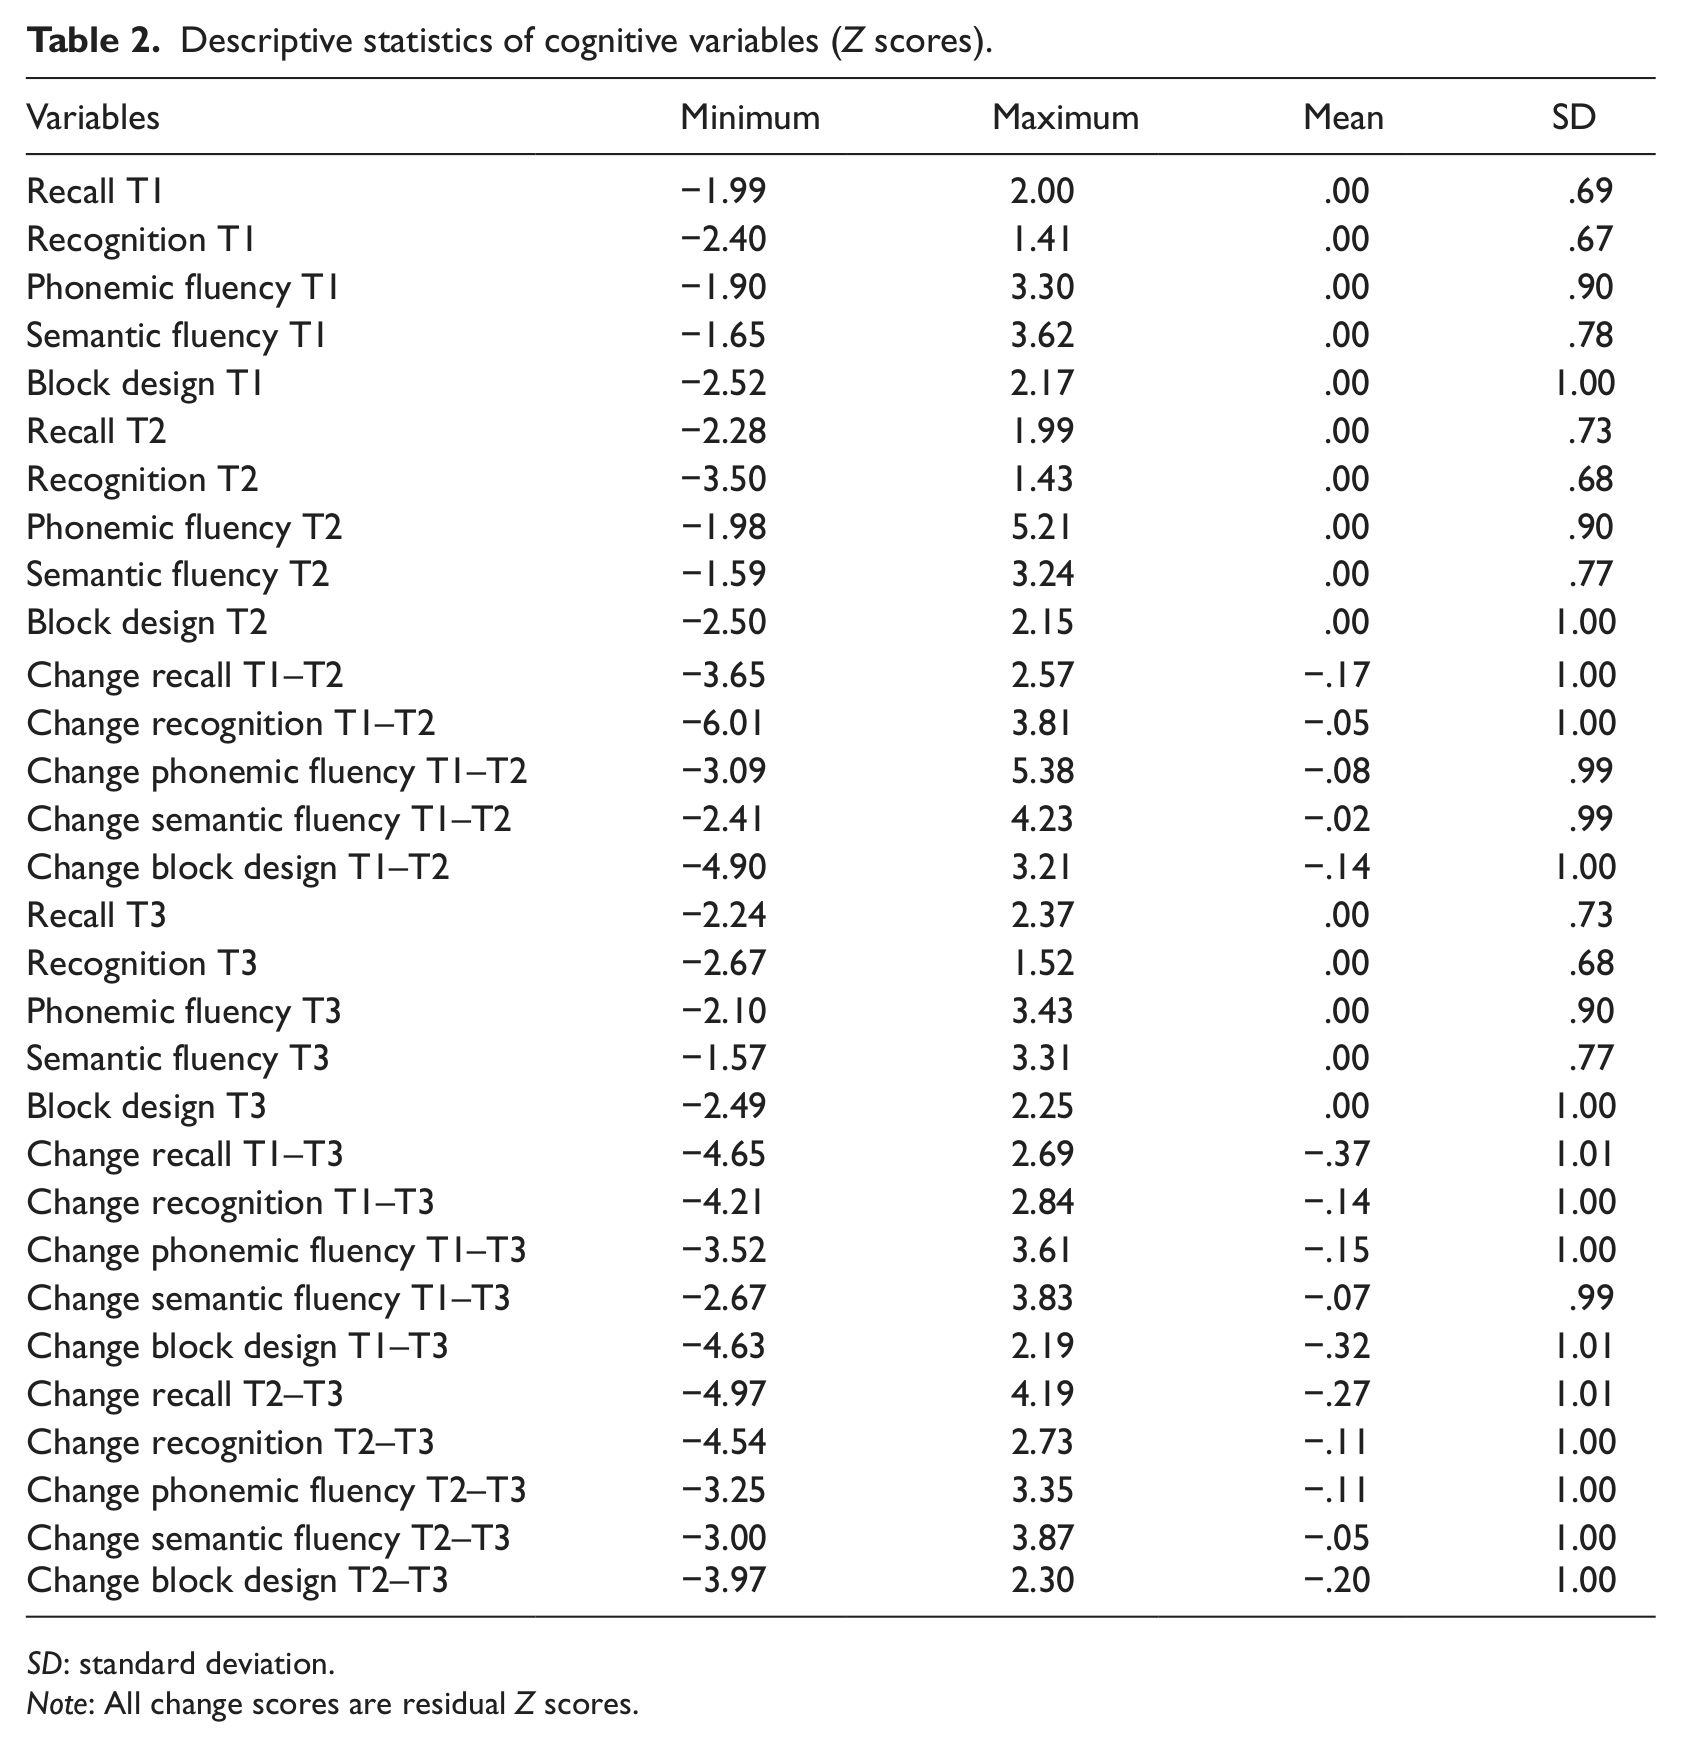
SD: standard deviation.
Note: All change scores are residual Z scores.
Separate analyses were performed on the equivalent blood parameters, blood pressure, and BMI from the first (T1) and second (T2) data waves. The components were extracted, with a PCA procedure, using orthogonal varimax rotation, which produces uncorrelated factors. The rationale behind the selection of rotation was to avoid multicollinearity in the following hierarchical multiple regression analyses. The correlations were accurately reproduced from the factors with correlations ranging from .321 (albumin and ESR; T1) to .831 (glucose and HbA1c; T2), which indicated good factorability. Six components with eigenvalues > 1 were found. Also the scree test indicated six components. Loadings of >.30 were regarded as significant. Most of the loadings were >.70, indicating an excellent item-to-factor loading in orthogonal rotation (Comrey and Lee, 1992). The interpretation and naming of the factors were based on high loading items and standard clinical physiology. They were named as follows: metabolic component (SBP, DBP, and BMI), glycemic component (glucose and HbA1c), lipid component (triglycerides and cholesterol), inflammatory component (ESR, Hb, and albumin), nutritional component (B12 and folate), and thyroid component (TSH and free thyroxine) (see Table 3). The same structure was derived at T1 and T2, respectively.
Results from the principal component analysis of medical health parameters at T1 and T2.
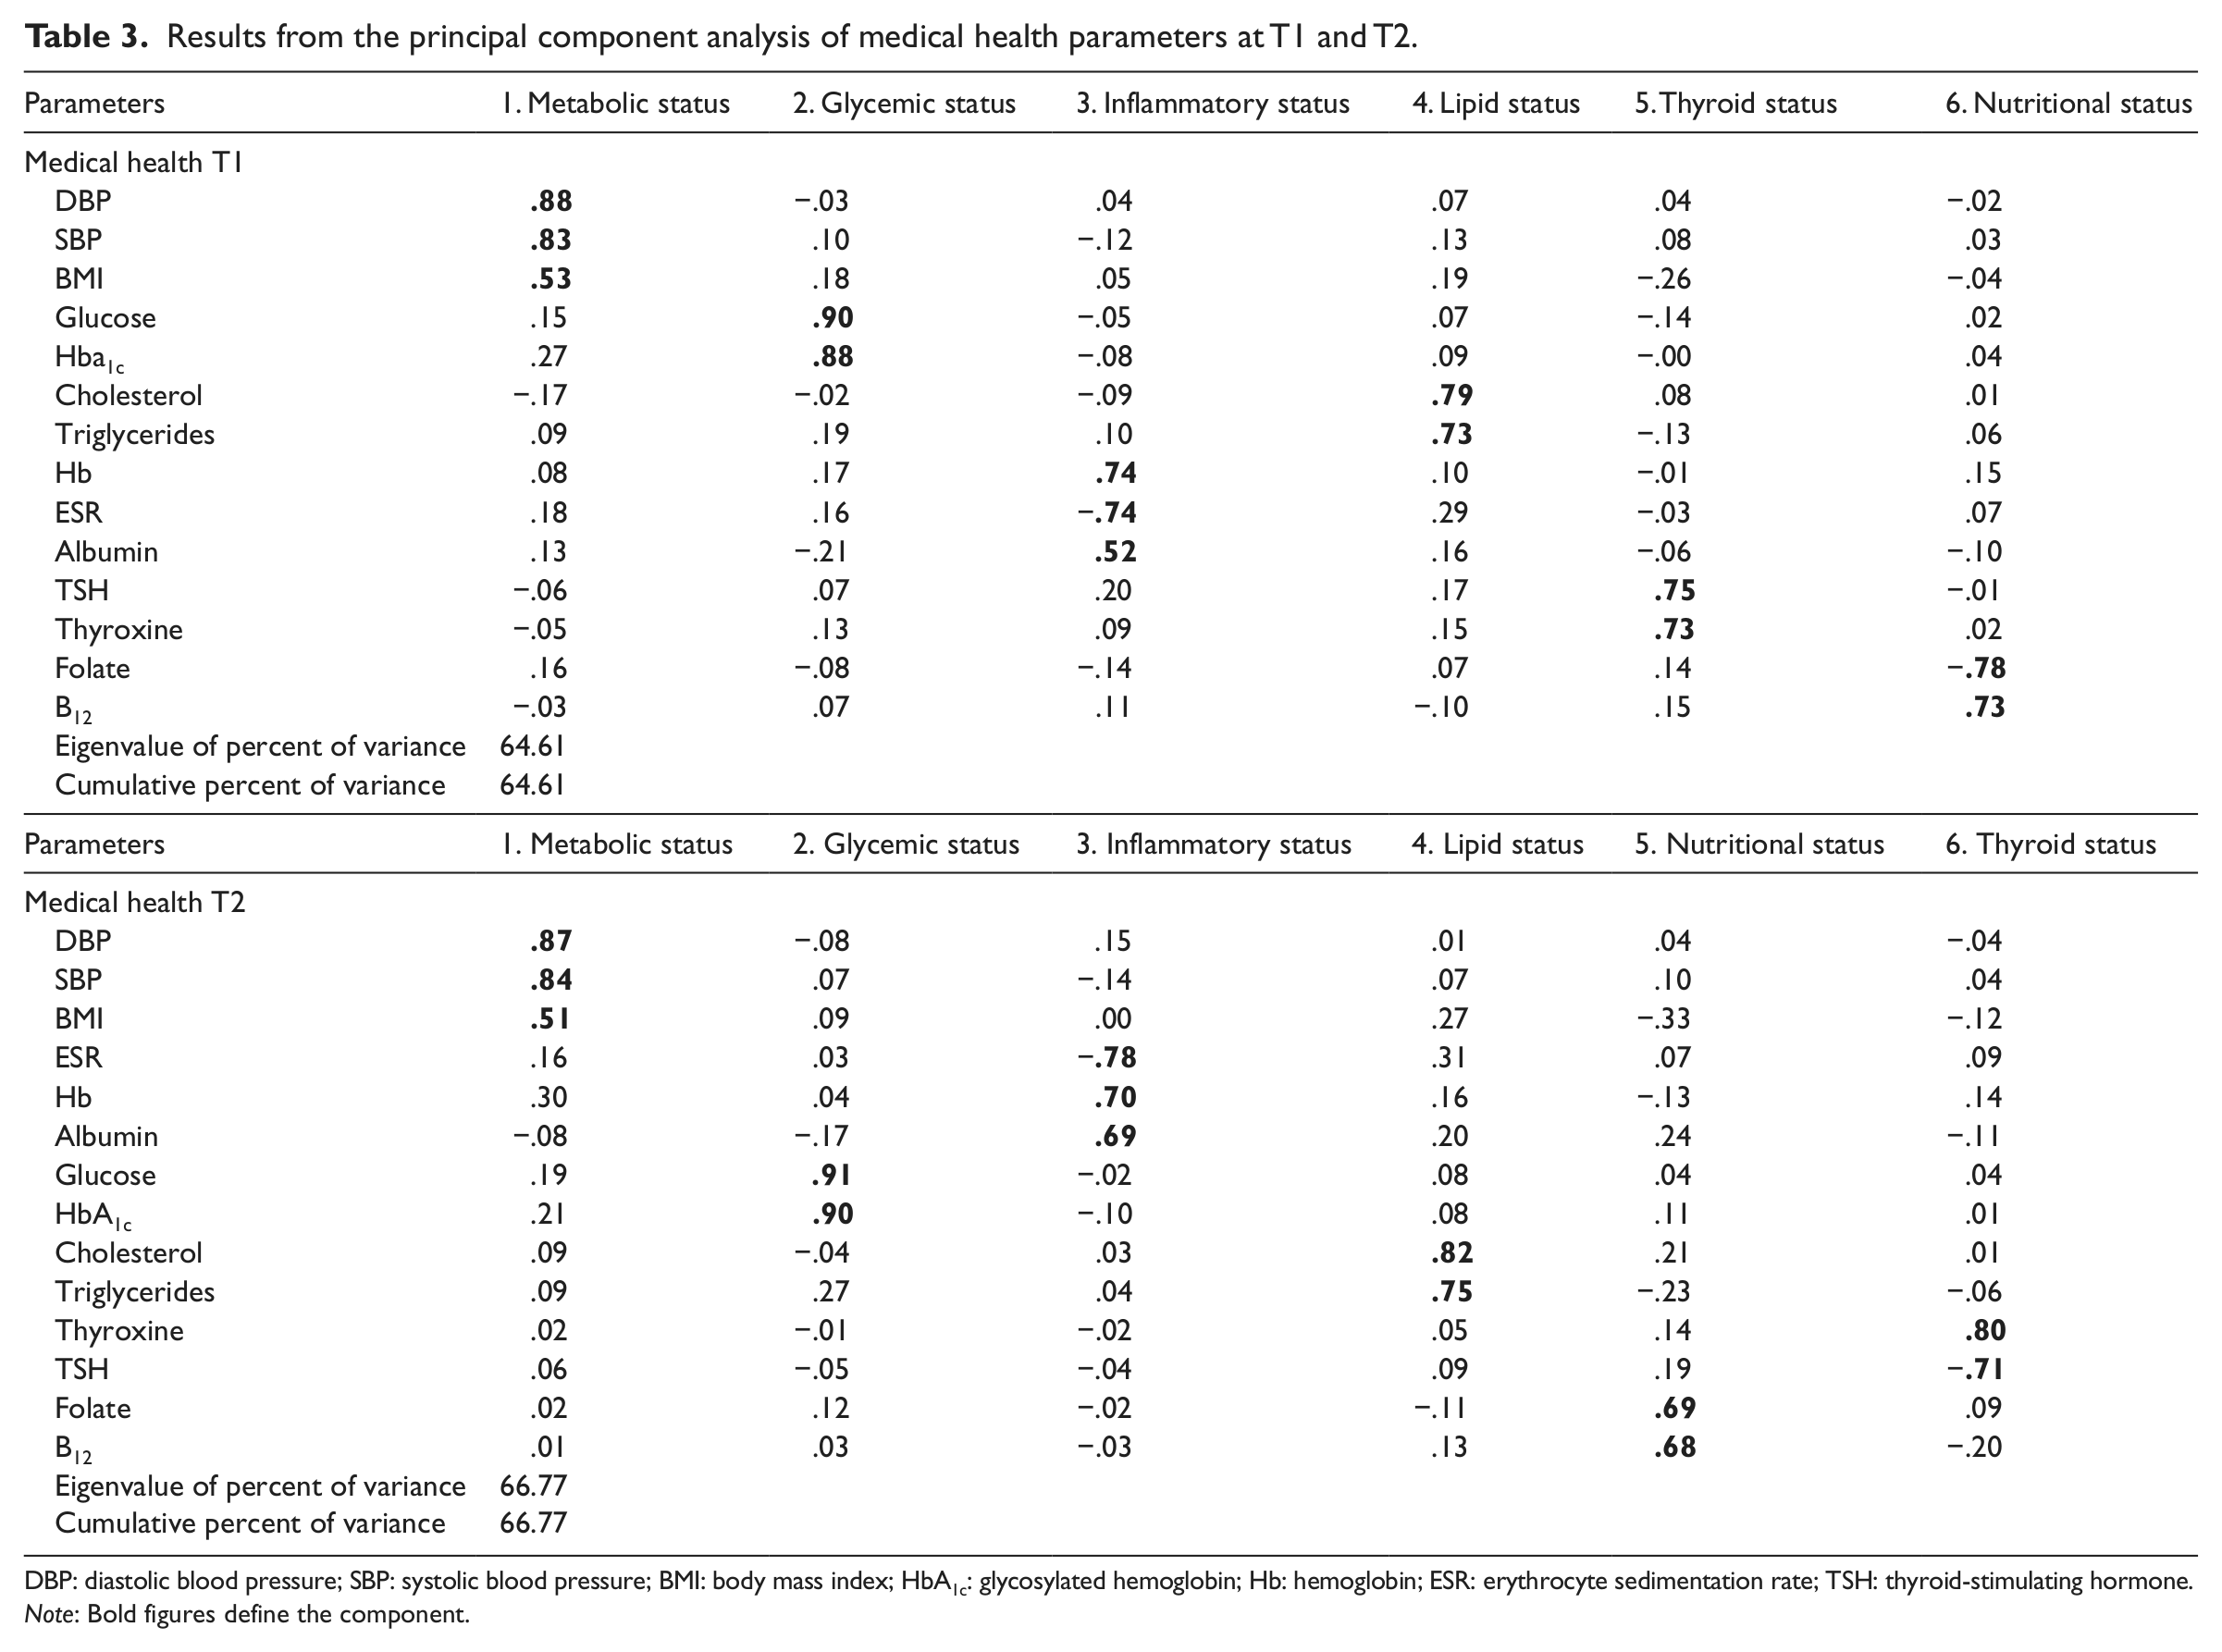
DBP: diastolic blood pressure; SBP: systolic blood pressure; BMI: body mass index; HbA1c: glycosylated hemoglobin; Hb: hemoglobin; ESR: erythrocyte sedimentation rate; TSH: thyroid-stimulating hormone.
Note: Bold figures define the component.
Component scores, from both analyses, were obtained for each individual, to be used in later hierarchical regression models described in the following. Next, residual change scores were computed for T1–T2 cognitive and health change, and T1–T3 and T2–T3 cognitive change. These scores were obtained by regressing follow-up data on data from the relevant previous occasion. Residuals were preferred to change scores since they are unaffected by regression to the mean effects and independent of baseline levels of performance (Crabbe and Weigel, 1987).
Mediation can be expressed as the proportion of variance in the outcome variable (Y) that the mediator (M) shares with the predictor (X). Here, we investigate whether health can mediate age-related differences and changes in cognitive performance. In order to examine the extent to which the health model accounted for age-related cognitive variations, we applied the following formula proposed by Salthouse (1996): a = (b − c)/b, where a is the explained age-related variance, b is the amount of variance in cognition accounted for by age if entered alone in the regression model, and c is the amount of variance in cognition accounted for by age when entering the health components first and age second in a different step. Specifically, separate regressions (Model A) were performed before examination of each main regression (Model B). In these first regressions, age was entered as a single predictor of each relevant outcome, and R2 for age was calculated. In all other hierarchical regression models, health scores were entered in the first step, followed by age in the last step.
The analyses followed a structure of four sections. First, we examined, at T1 and T2, cross-sectional associations between the health components and cognitive ability. Second, baseline health was used to predict cognitive change in the T1–T3 interval. Third, we examined whether parallel health change across T1–T2 predicted cognitive change in the same time interval. Finally, we examined whether health change in the T1–T2 interval predicted future cognitive change in the T2–T3 interval.
Results
Cross-sectional analyses
Cross-sectional associations were examined at both T1 and T2. Results are shown in Table 4. At T1, age had the strongest predictive value across all cognitive domains. Lower age was associated with better cognitive performance on all measures, although the associations were more pronounced for episodic recall and recognition and spatial ability.
Cross-sectional results of hierarchical multiple regression analyses predicting cognitive function by health components at T1 and T2, respectively.
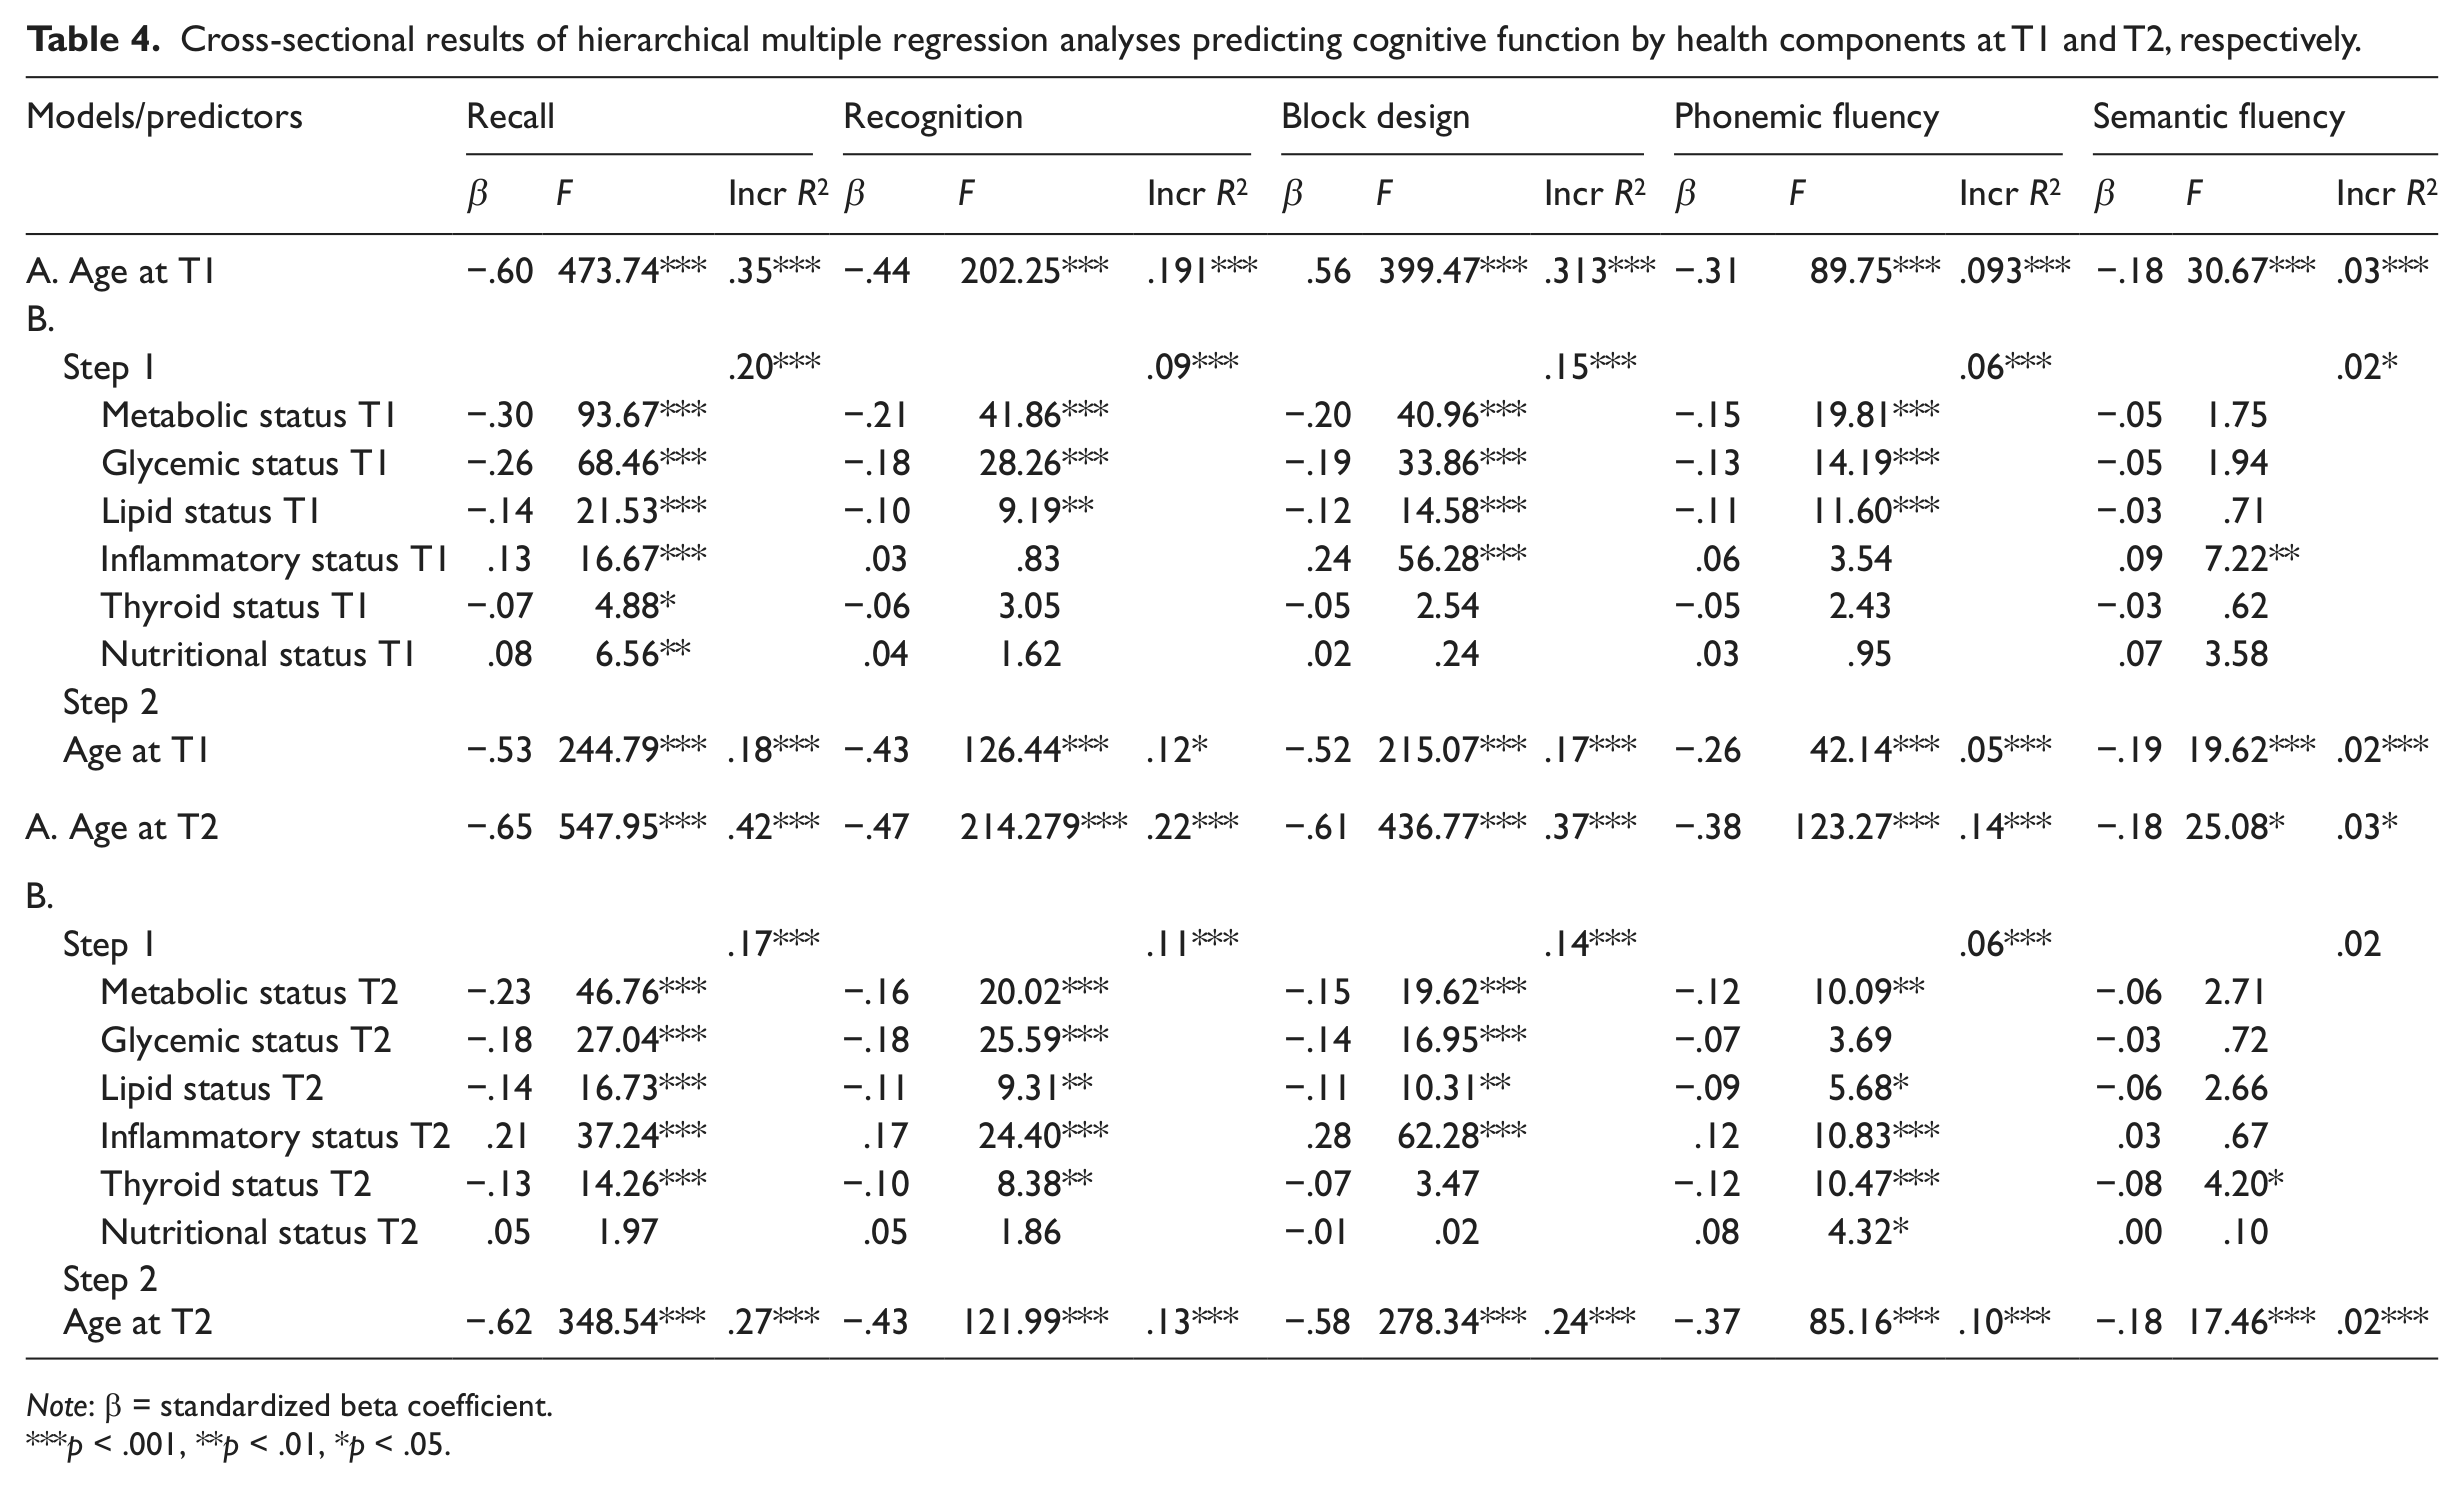
Note: β = standardized beta coefficient.
p < .001, **p < .01, *p < .05.
There were significant associations between higher metabolic scores and worse cognitive performance on episodic recall and recognition, spatial ability, and phonemic fluency. Lower levels of glycemic load predicted better cognitive performance across all tasks, with the exception of semantic fluency. Furthermore, there was a significant association between higher lipid levels and lower performance on episodic recall and recognition, spatial ability, and phonemic fluency. Higher levels of inflammatory status were associated with better episodic recall, spatial ability, and semantic fluency. Lower levels of thyroid status showed marginal but significant associations with better episodic recall. Higher levels of nutritional markers, finally, predicted better performance on episodic recall.
Hence, just 13 regressions out of 30 failed to approach significance: metabolic, glycemic, and lipid status with semantic fluency; inflammation status with episodic recognition and phonemic fluency; thyroid status with recognition memory, spatial ability, and phonemic and semantic fluency; and nutritional status, finally, with all but episodic recall.
Following, T2 data were analyzed in the same way. In these analyses, a similar pattern of results was obtained. The main differences were that higher markers of inflammation were now also associated with better cognitive performance on episodic recognition, while the association with fluency changed from semantic to phonemic fluency. Furthermore, there was no association between glycemic status and phonemic fluency at T2. In contrast to the T1 data, the associations between thyroid status and nutritional status with phonemic fluency were significant at T2. Lower scores of thyroid status were now also associated with better performance episodic recognition. Nutritional status was positively associated with phonemic fluency, but no other cognitive tasks. Regarding semantic fluency, only lower scores on thyroid function were significantly associated with better performance. Contrasting T1 data, no association was found between nutritional levels and episodic recall. For T2 data, 9 out of 30 regressions involving health failed to reach significance.
At T1, 48.4 percent, 37.2 percent, 44.4 percent, 51.6 percent, and 32.4 percent of the age-related cognitive variations in episodic recall and recognition, spatial ability, and phonemic and semantic fluencies, were accounted for by the health factors, respectively. The same figures at T2 were 35.5 percent, 41.7 percent, 34.3 percent, 29.1 percent, and 28.1 percent.
Baseline health versus cognitive change in the T1–T3 intervals
Next, we examined whether baseline health predicted cognitive change between the T1 and T3 measurement points. All results are presented in Table 5. Older age was associated with more negative cognitive change across all measures but semantic fluency, although the association was most pronounced for the episodic recall tasks and spatial ability.
Results of hierarchical multiple regression analysis predicting cognitive change in the T1–T3 measurement intervals by health components at T1.

Note: β = standardized beta coefficient.
p < .001, **p < .01, *p < .05.
Significant negative associations were found for metabolic, glycemic, and lipid status at baseline and residual changes in all cognitive measures, except semantic fluency. Furthermore, higher load of inflammation at baseline predicted less cognitive decline in episodic recall, spatial ability, and phonemic fluency. Higher levels of thyroid hormones at baseline were associated with cognitive decline in episodic recall and recognition. Higher baseline scores in nutrition, finally, were significantly associated with less decline in recognition memory and phonemic fluency. Across episodic recall and recognition, spatial ability, and phonemic and semantic fluencies, 49.0 percent, 46.0 percent, 41.2 percent, 62.0 percent, and 50 percent of the age-related variations in cognitive change were accounted for by health, respectively.
Health change relative to parallel cognitive change betweenT1 and T2
In the third set of analyses, we aimed at determining whether health change predicted parallel cognitive change in the T1–T2 interval. Results are shown in Table 6. Age at T2 had a negative significant association with all cognitive change variables in the T1–T2 interval, although the association was less obvious on semantic fluency.
Results of hierarchical multiple regression analysis predicting cognitive change in the T1–T2 measurement intervals by health change in the T1–T2 interval.
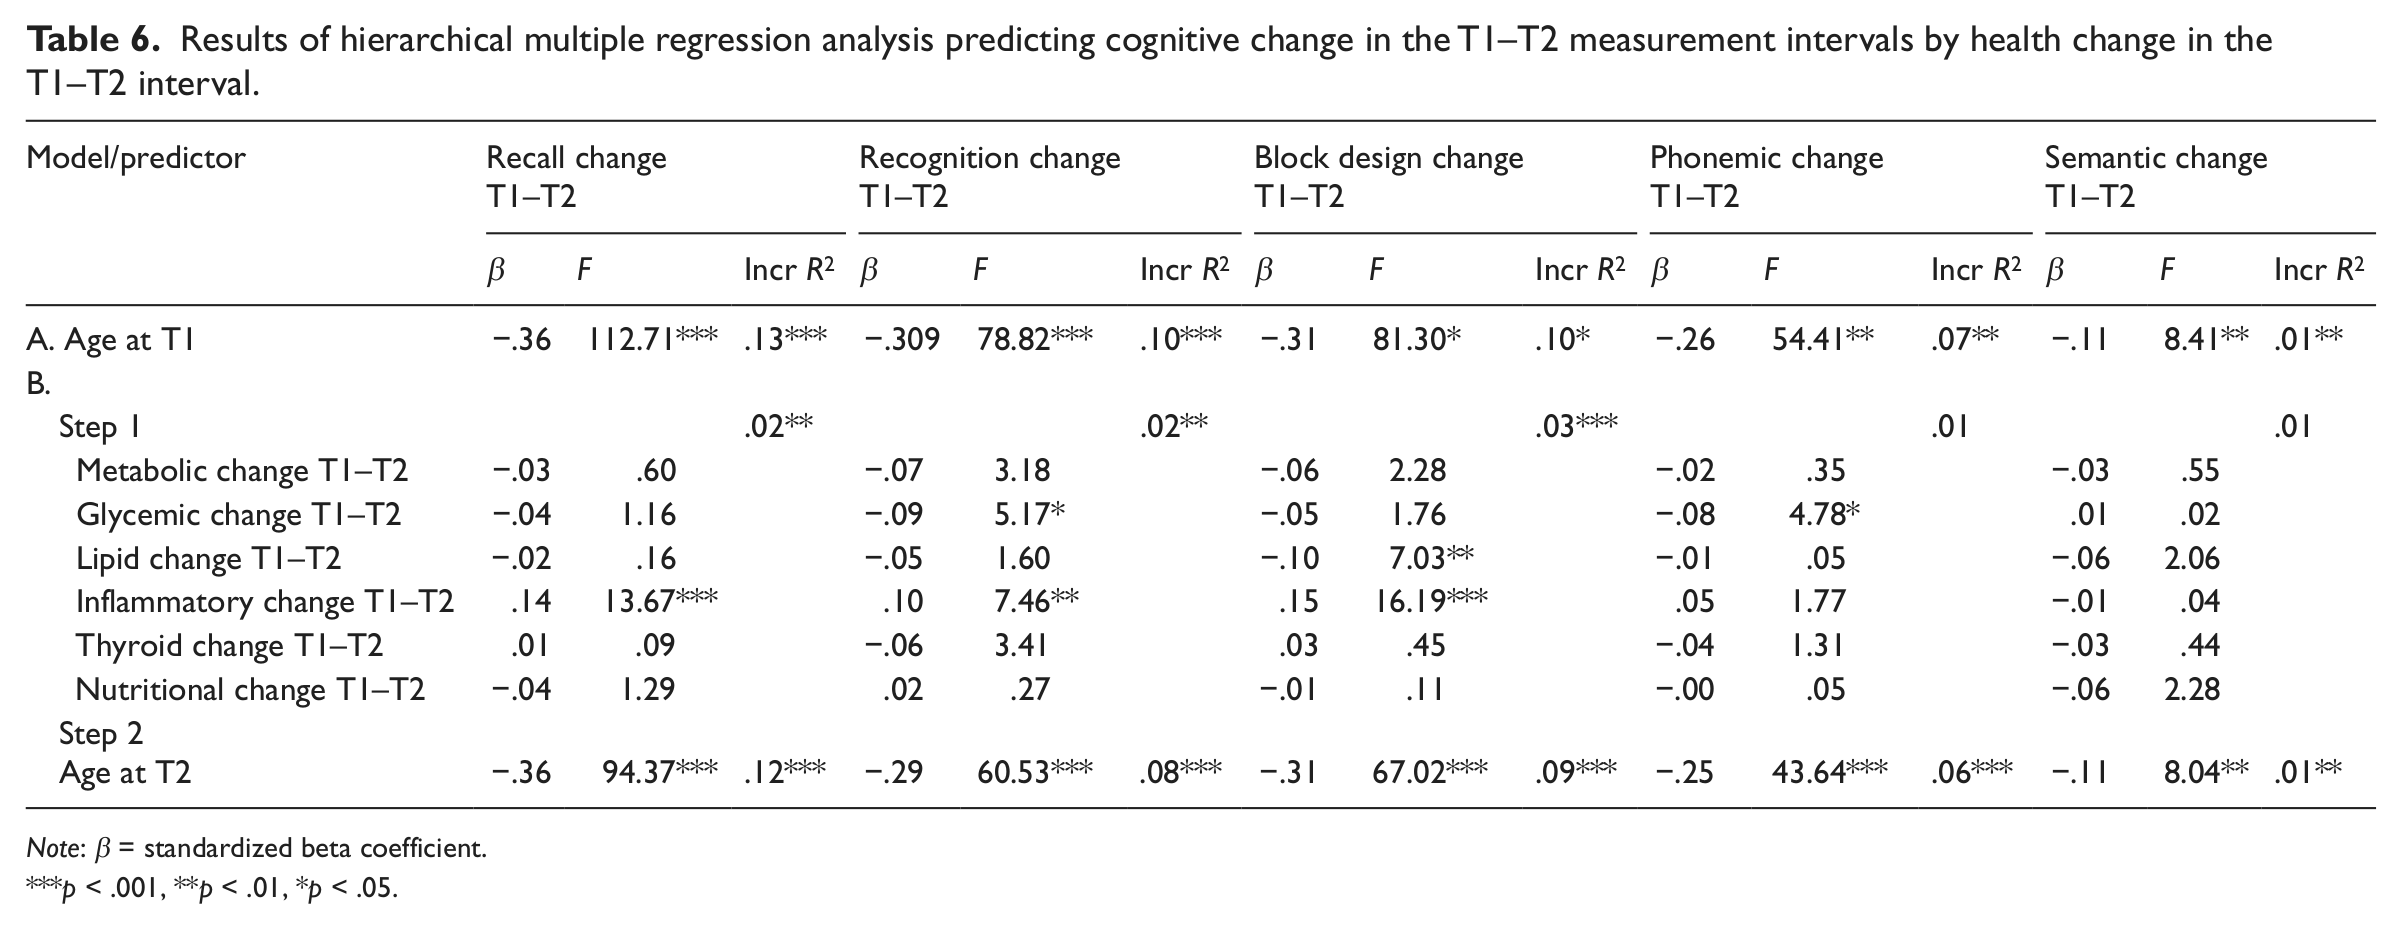
Note: β = standardized beta coefficient.
p < .001, **p < .01, *p < .05.
Increased glycemic status in the T1–T2 interval showed significant predictions of cognitive decline in episodic recognition and phonemic fluency in the same time intervals. Increasing lipid levels were significantly associated with declining spatial performance. Increasing inflammatory status between T1 and T2 was associated with less cognitive decline in episodic recall, recognition, and spatial ability in the parallel time interval. Across episodic recall and recognition, spatial ability, and phonemic fluency change scores, 10.7 percent, 17.7 percent, 12.2 percent, and 13.2 percent of the age-related variations in cognitive change were accounted for by the health variables, respectively. The age-related variations in semantic fluency change were too small for making a meaningful calculation.
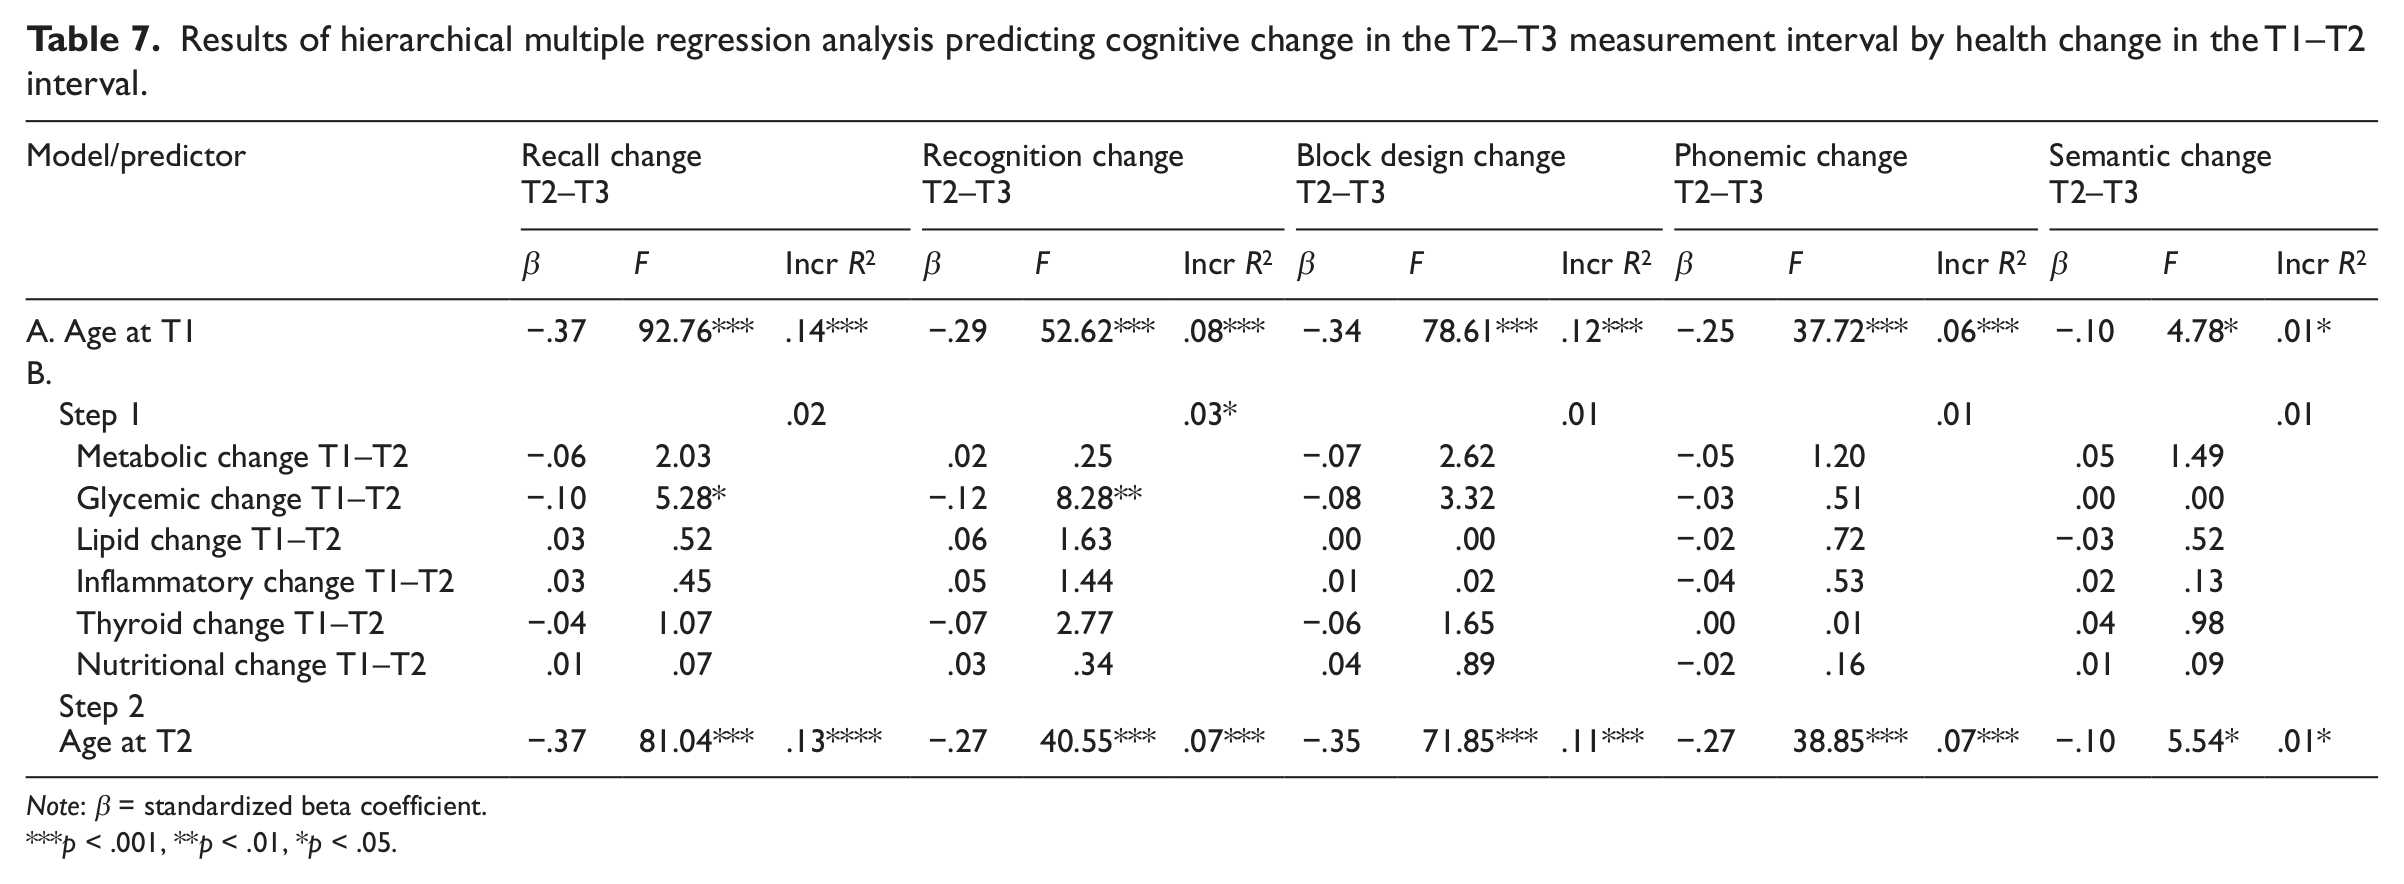
T1–T2 health change relative to cognitive change in the T2–T3 time interval
In the final set of analyses, we examined whether 5-year change (T1–T2) in health predicted future 5-year change (T2–T3) in cognitive performance. There were significant negative associations between age and all cognitive change variables in the T2–T3 time interval. This was again least pronounced in the semantic fluency domain. All results are presented in Table 7. An increase of glycemic levels in the T1–T2 interval significantly predicted future decrease in episodic recall and recognition memory. Furthermore, there was a tendency of a negative association between increase in glycemic load and spatial performance (p = .069). For the age-related variations in episodic recall and recognition and spatial ability change (T2–T3), 6.7 percent, 18.3 percent, and 3.4 percent were accounted for by the health-related change (T1–T2), respectively. The age-related variance was too small in the fluency measures to calculate any meaningful percentage score.
Results of hierarchical multiple regression analysis predicting cognitive change in the T2–T3 measurement interval by health change in the T1–T2 interval.
Note: β = standardized beta coefficient.
p < .001, **p < .01, *p < .05.
Discussion
The main aim of this study was to explore the existence of a medical health model based on medical parameters and to investigate whether variation and variations of change in health predicted cognitive function and change in the adult life span. To achieve these goals, we used both cross-sectional and longitudinal data from the first three data waves of the prospective Betula study (Nilsson et al., 1997). We expected the associations between medical health and cognition to be stronger in the cross-sectional data than the longitudinal data, based on previously reported inconsistencies between cross-sectional and longitudinal analyses, and studies of age mediation accounts of cognitive differences and change (Hofer et al., 2003; Lindenberger et al., 2011; Sternäng et al., 2010). We also expected the analyses of prospective cognitive change to generate the least significant results if health change was separated in time from cognitive change. All our hypotheses received empirical support.
Our study is unique from two perspectives. To the best of our knowledge, a multivariate approach to model health from extensive objective medical data has not been published previously. Most attempts to create models of health have used self-rated information about health status (e.g. Liang et al., 1991; Østbye et al., 2009; Stump et al., 1997; Whitelaw and Liang, 1991). Furthermore, we had access to a large population-based sample, and both longitudinal and cross-sectional data describing health and cognition in a sample of wide age range (35–80 years).
In the following, we concentrate our interpretations at the level of trends rather than at the level of piecemeal individual findings. We adopt this strategy because it permits us to focus on the preeminent finding of the PCA health structure.
The principal finding was that health could be modeled by six components: (1) metabolic (DBP, SBP, and BMI), (2) glycemic (glucose and HbA1c), (3) inflammatory (ESR, Hb, and albumin), (4) lipid (triglycerides and cholesterol), (5) nutritional (folate and B12), and (6) thyroid (TSH and free thyroxine). Importantly, this finding was consistent in cross-sectional data from two different measurement points (T1 and T2), and more than 60 percent of the variance was accounted for by the model at both occasions.
Prior to the regression analyses, longitudinal data were transformed to standardized residual change scores to reflect change over time. The main findings from the regression analyses were as follows: first, the cross-sectional analyses from both measurement points (T1 and T2) generated more explained variance across all cognitive measures than the following prospective and longitudinal analyses. Results in the two cross-sectional sets of analyses were quite similar and most analyses approached significance.
Second, cognitive change over 10 years was predicted from baseline health. Lower levels of metabolic, glycemic, inflammatory, and lipid components were associated with decrease in cognitive function, in the domains of episodic recall and recognition, spatial ability, and phonemic fluency. Higher levels on inflammation markers were associated with less cognitive decline on episodic recall and recognition, spatial ability, and phonemic fluency. Higher levels of thyroid hormones at baseline were associated with cognitive decline in episodic recall and recognition. Higher levels of nutritional markers at baseline significantly predicted less decline of episodic recognition and phonemic fluency. Semantic fluency change was not affected by any of the health indicators at baseline. Apart from this, the obtained results were very similar to the results generated from the cross-sectional analyses. A strikingly large proportion of age-related variations in the cognitive measures were accounted for by health when baseline health was used for prediction of both cross-sectional data and prospective change.
Third, a different pattern was found for the sets of analyses using time-varying predictors of health change versus cognitive change. The analyses of parallel 5-year change in health and cognition demonstrated that increase in glycemic change significantly predicted decline of episodic recognition and phonemic fluency. Furthermore, increasing load of inflammation generated less decline in episodic recall and recognition and spatial ability. Significance was reached for increasing lipid levels and decline of spatial ability. Finally, in the analyses of change of health between T1 and T2 interval, later cognitive change in the T2–T3 interval showed that a lowering in glycemic load resulted in later better performance on episodic memory function (recall and recognition).
Most of the results from the cross-sectional and prospective analyses were in the expected directions, with the exceptions of thyroid and inflammatory functions. Higher baseline scores on the thyroid component were associated with worse cognitive performance at baseline and cognitive changes in the T1–T3 measurement intervals. Those findings are in line with the previous cross-sectional findings (Van Boxtel et al., 2004), but contradict recent findings in older adults, using TSH as a time-varying predictor (Wahlin et al., 2005). Such differences might occur from differences of measures, since we used a composite score containing both TSH and free thyroxine. Furthermore, sample characteristics were different such that the contradicting study was performed solely on older adults.
The positive association between the inflammatory composite scores containing ESR, Hb, and albumin, and cognitive performance was surprising. No previous studies have focused on inflammation as a construct in relation to cognition, but studies investigating single parameters of inflammation like Il-6 and ESR do in general show a negative association (e.g. Karlsson et al.,2010; Yaffe et al., 2004).
The finding that cross-sectional age variance extraction generates more significant results than longitudinal analyses is well established by the previous studies of cognitive deficits and decline (Lindenberger et al., 2011; Sternänget al., 2010). Such discrepancies might partly be due to more temporary health effects, which do not remain, but it is also likely that it is related to the cross-sectional design that uses interindividual mean differences instead of intraindividual change. Such inconsistencies have also theoretically been explained as effects of time-related mean trends (Hofer et al., 2003; Lindenberger et al., 2011). Considering this, the cross-sectional results from the present study should be interpreted with caution.
The prospective analyses of baseline health regressed on cognitive change in the T1–T3 interval are also somewhat liberal test of causality, the reason being that individual differences in health at baseline are not necessarily time varying, reflecting changing health. Indeed, this prospective analysis generated more explained variance than our following two longitudinal analyses. Change in health, predicting future change in cognitive function, was our most conservative test of causality. The purpose of contrasting parallel change predictions (Table 5) with change predicting future change (Table 6) was to extract findings that did not overlap between the two. What remained in this most conservative test were associations of glycemic change with episodic memory decline (episodic recall and recognition). It is still possible that the low explained variance in the longitudinal analyses is partly due to a relatively short follow-up period (5 years).
A limitation of our study was lack of data on LDL and HDL cholesterol. Information about fasting prior to the measurement of triglyceride, cholesterol, and glucose levels was not provided to the participants. More specific inflammatory markers, such as CRP and Il-6, would be desirable to fully explore the relation between systemic inflammation and cognition. As a caveat, we would like to stress that in the absence of similar studies, comparisons with studies such as those referred to is what remains. Our health components all comprise biological markers, each of which has been explored in relation to cognition in separate previous studies. The main task here was to explore the potential impact of a component model.
The cognitive battery comprised four components (episodic recall and recognition, visuospatial function, and phonemic fluency) known to be sensitive to both age-related and health-related changes. In addition, we included for control purposes a component of semantic fluency, which is known to be less sensitive to both age-related and health-related influences. The general pattern of results throughout the analyses confirmed that the expected abilities were sensitive to age and health, while the semantic component was less sensitive. Also, as expected, the most health-sensitive cognitive indicators were episodic recall and recognition, followed by spatial ability (e.g. see Wahlin, 2004).
Summing up, our health structure may be a helpful inferential tool for future studies. Our study highlights that more cross-sectional, than prospective, and longitudinal age-related cognitive variations are accounted for by the health variations. Baseline health had a prospective impact on cognition, and the longitudinal analyses showed that earlier change in glycemic function predicted future change in episodic memory. Those results indicate that elevated levels of blood sugar may have long-term effects on hippocampus-dependent cognitive domains. Our study provides support for causal relations between health and mental functions and suggests that some effects are long term. The study sample is a large population-based sample of adults, known to reflect the Swedish population on various demographic factors (external validity) (see Nilsson et al., 1997), which makes the results possible to generalize to the general public.
Footnotes
Declaration of conflicting interest
The authors declare that there is no conflict of interest.
Funding
The Betula Longitudinal Study was supported by the Bank of Sweden Tercentenary Foundation (grant 1988-0082:17), the Swedish Council for Planning and Coordination of Research (grants D1988-0092, D1989-0115, D1990-0074, D1991-0258, D1992-0143, D1997-0756, D1997-1841, D1999-0739, and B1999-474), the Swedish Council for Research in the Humanities and Social Sciences (grant F377/1988-2000), and the Swedish Council for Social Research (1998–1990: grants 88-0082 and 311/1991-2000). Åke Wahlin was funded by a grant from the Swedish Council for research in the Humanities and Social Sciences (grant 421-2007-1616).