



Abstract
As part of a prospective cohort study of 1354 female and 347 male healthcare personnel, we examined the stability of subjective social status over ~7 months and the prospective association between subjective social status and self-rated health status. Most (82%) subjective social status ratings were stable (within ±1 point). Lower baseline subjective social status among healthcare personnel was associated with more subsequent reports of fatigue and headache and worsening global self-rated health status. Healthcare personnel who placed themselves on the bottom half of the subjective social status ladder were four times more likely to experience a decline in global self-rated health status and half as likely to improve to excellent self-rated health status.
Keywords
With growing recognition of the health consequences of social disparities (Adler and Rehkopf, 2008; Murray et al., 2006; Prus, 2011), a burgeoning literature has emerged focused on the connection between health and subjective social status (SSS), or how people perceive their position in a social hierarchy (Adler, 2009). A series of studies that asked participants to place themselves on a 9- or 10-step ladder relative to others in the United States in terms of education, income, and occupational status have observed associations between SSS and self-rated health status (SRH) and medical conditions (Adler et al., 2000, 2008; Demakakos et al., 2008; Franzini and Fernandez-Esquer, 2006; Hu et al., 2005; Operario et al., 2004; Ostrove et al., 2000; Singh-Manoux et al., 2003; Wolff et al., 2010), metabolic risk factors (Adler et al., 2000; Cooper et al., 2010; Gruenewald et al., 2006; Manuck et al., 2010; Wright and Steptoe, 2005), and even differences in brain morphology (Gianaros et al., 2007).
Although most research to date has been cross-sectional, several prospective studies suggest that SSS explains changes in health status among adolescents (Goodman et al., 2007) and middle-aged adults (Singh-Manoux et al., 2005) and susceptibility to illness (Cohen et al., 2008; Thompson et al., in press). In our prospective cohort study of healthcare personnel (HCP) at two medical centers, we had an opportunity to assess health status and SSS at enrollment, examine health reports during wintertime surveillance, and then reassess SSS and health status at the end of the study. The three objectives of our study were as follows:
Examine the stability of SSS ratings between two assessments ~7 months apart and identify correlates of SSS changes.
Assess the prospective association between SSS and subsequent reports of headache, fatigue, and SRH.
Confirm that SSS is not solely a proxy for objective socioeconomic status (SES) and that SSS–SRH associations persist after controlling for demographic, medical, health behavior, and work characteristics.
Method
Participants
Details on cohort recruitment have been presented previously (Thompson et al., 2012). Briefly, a prospective cohort of HCP was enrolled in Fall 2010 (1 September to 30 November 2010) at Scott & White Healthcare (SWH) in central Texas and Kaiser Permanente Northwest (KPNW) located in Oregon and Washington. Eligible enrollees were (a) aged 18–65 years, (b) working full-time, (c) employed by and receiving medical care from the healthcare system for >12 months, and (d) providing direct patient care. Announcements and email invitations regarding a study of “respiratory illness and healthcare workers” were targeted to all employees. Participants were offered small incentives in the form of cash or gift cards.
Procedures
Timing of surveys
Participants were asked to complete an Internet-based questionnaire at enrollment (T1) and at the end of the study (23 April to 30 May 2011; T3). For 20 weeks (1 December 2010 to 22 April 2011; T2), participants were asked to complete a brief survey about their health during the prior week. The survey was available via Internet-based and automated telephone formats, though most surveillance reports (78%) occurred via the Internet. Study procedures, informed consent documents, and data collection instruments were reviewed and approved by institutional review boards at both sites.
Demographics and SES measures
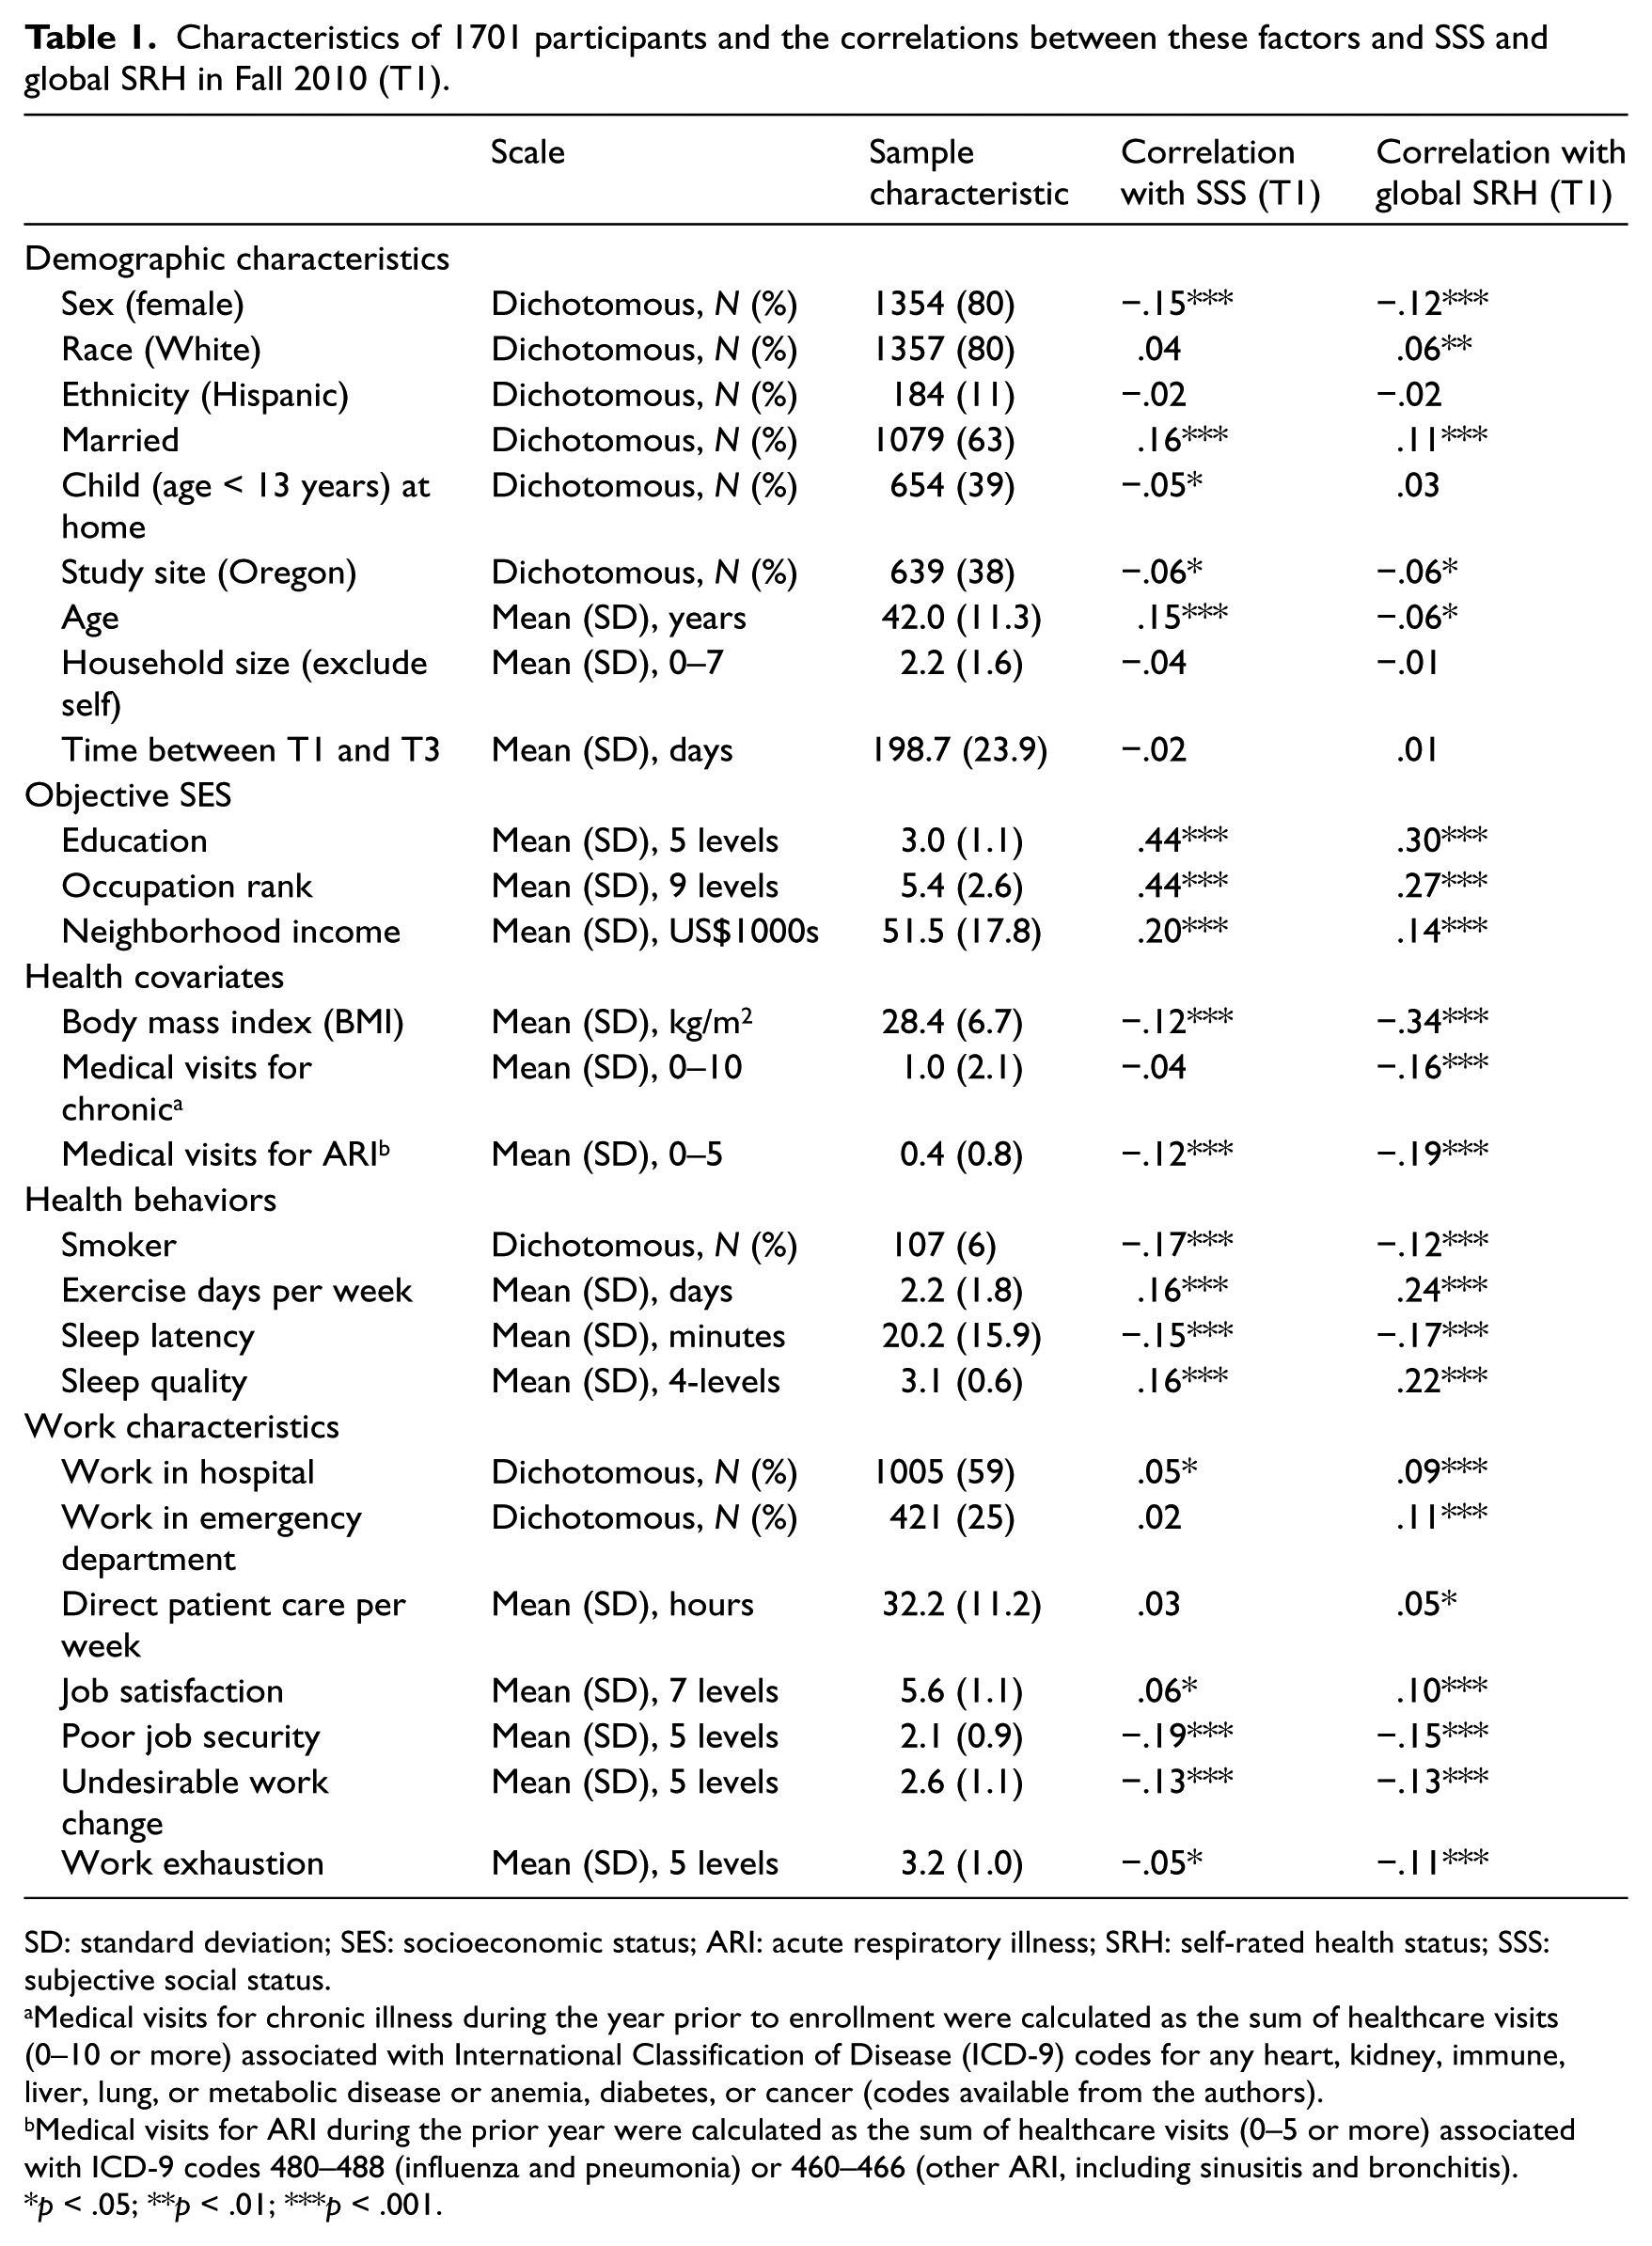
The enrollment questionnaire included items on demographics and three indicators of objective SES: education, occupation, and street address, which was used to identify US census block (Table 1). Education was measured with five ordinal levels (high school or less, some college, college degree, master’s degree, or advanced degree). Occupational rank was represented with a 9-level ordinal variable, which categorized jobs by level of responsibility, education and training requirements, and average salary: (1) medical assistants, (2) phlebotomists, (3) dental and optometry assistants, (4) medical technicians, (5) medical therapists, (6) practical nurses, (7) registered nurses, (8) nonphysician primary providers including nurse practitioners, and (9) physicians. To illustrate trends, occupational rank tertiles were also examined with three occupations in each tier. Median neighborhood household income was determined by 2000 US census block for the participant’s home address.
Characteristics of 1701 participants and the correlations between these factors and SSS and global SRH in Fall 2010 (T1).
SD: standard deviation; SES: socioeconomic status; ARI: acute respiratory illness; SRH: self-rated health status; SSS: subjective social status.
Medical visits for chronic illness during the year prior to enrollment were calculated as the sum of healthcare visits (0–10 or more) associated with International Classification of Disease (ICD-9) codes for any heart, kidney, immune, liver, lung, or metabolic disease or anemia, diabetes, or cancer (codes available from the authors).
Medical visits for ARI during the prior year were calculated as the sum of healthcare visits (0–5 or more) associated with ICD-9 codes 480–488 (influenza and pneumonia) or 460–466 (other ARI, including sinusitis and bronchitis).
p < .05; **p < .01; ***p < .001.
SSS was assessed with the validated single-item MacArthur Scale (Adler, 2009; Operario et al., 2004; Singh-Manoux et al., 2003). Participants were presented with a picture of a 9-rung ladder and were told the following: At the top of the ladder are the people in the United States who are best off—those who have the most money, the most education, and the most respected jobs. At the bottom are the people who are the worst off—who have the least money, the least education, and the least respected jobs or no job.
Participants were asked to place themselves on the ladder, and this was scored from 1 (worst) to 9 (best).
Health measures
SRH was assessed with a standard 5-level rating of overall health from 1 (poor) to 5 (excellent) (Idler and Benyamini, 1997; Jylha, 2009; Prus, 2011). Global SRH (“Overall, how would you describe your health?”) was assessed at T1 and T3. Weekly SRH (“How would you describe your health during the past week?”) was assessed during weekly surveillance (T2). Each surveillance report also asked whether or not the participants had experienced headache or fatigue during the prior week.
Body mass index (BMI) was calculated with height and weight (kg/m2) from self-report at T1, except for 30 observations extracted from medical records. Medical visits for chronic illness during the year prior to enrollment were calculated as the sum of healthcare visits (0–10 or more) associated with International Classification of Disease (ICD-9) codes for any heart, kidney, immune, liver, lung, or metabolic disease or anemia, diabetes, or cancer (codes available from the authors). Medical visits for acute respiratory illness (ARI) during the prior year were calculated as the sum of healthcare visits (0–5 or more) associated with ICD-9 codes 480–488 (influenza and pneumonia) or 460–466 (other ARI, including sinusitis and bronchitis).
Health behaviors measures
All health behaviors, including smoking status, were assessed at T1 from self-report. Vigorous exercise was the number of days per week during the past month that participants “exercised, worked out, or engaged in some other physical activity to work up a sweat.” For questions regarding sleep, participants were asked to think about their habits during the past month, including number of minutes they take to fall asleep each night (sleep latency) and their overall sleep quality rated from 1 (very bad) to 4 (very good).
Work characteristics measures
Number of hours per week with direct patient care and whether or not the participant worked in a hospital or emergency department were assessed by self-report at T1. Other work characteristics and attitudes were assessed as part of the T3 questionnaire. Job satisfaction was assessed using a validated single-item measure (“Overall, how satisfied are you with your current job?”) (Wanous et al., 1997) with a Likert scale from 1 (extremely dissatisfied) to 7 (extremely satisfied). Three addition items drawn from prior studies (De Croon et al., 2003; Shen et al., 2006; Siegrist et al., 2004) assessed perceived job security (“My job security is poor”), undesirable changes at work (“I have experienced an undesirable change in my work situation”), and work exhaustion (“I am physically exhausted after a typical day at work”), using a Likert scale from 1 (strongly disagree) to 5 (strongly agree).
Statistical analysis
Similar to prior studies (Cohen et al., 2008; Thompson et al., in press), SSS was examined as an ordinal variable (range: 1–9), and effects were illustrated using tertiles, which divided participants into approximately equal groups of low to middle (ratings of 1–5), high (6–7), and very high (8–9) ranking. In addition, similar to previous studies (Singh-Manoux et al., 2005), linear regression was used to estimate the association between SSS and both weekly and global SRH variables. Global SRH was also examined as a dichotomous variable (to represent declines or improvement in SRH) using logistic regression. Changes in SSS or weekly and global SRH were modeled in linear regression models by adjusting subsequent ratings by baseline ratings at enrollment (Cohen and Cohen, 2003). In secondary analyses, the role of health covariates, health behaviors, and work characteristics as potential mediators of the association between SSS and subsequent SRH was examined using the product of coefficient strategy (Hayes, 2013; Preacher and Hayes, 2008). All analyses were conducted using IBM SPSS 19.0 (Armonk, NY).
Results
Participant characteristics
Across study sites, 1781 of 2393 (74%) screened HCP were eligible, consented, and completed the enrollment questionnaire. The cohort included approximately 20 percent of the eligible HCP population at KPNW and 40 percent at SWH; women were more likely to volunteer than men (especially among those over the age of 50 years), and proportionally fewer physicians participated compared to other occupational groups (data not shown but available in Thompson et al., 2012). Of the 1781 HCP who completed the enrollment questionnaire, 1701 (95%) also completed the end of study questionnaire and constitute study participants for T1 and T3 analyses. The average time between T1 and T3 assessments was 28 weeks (standard deviation (SD) = 3.4 weeks). Participant characteristics are presented in Table 1. The mean age of participants was 42 years, 80 percent were female, and 80 percent were White (Table 1). Most (68%) placed themselves above the middle rung of the SSS ladder (median = 6.0, mean = 6.3, SD = 1.3). SRH was consistently high at T1 and T3, with 81 percent at both times describing their health as very good or excellent (both medians = 4.0, means = 4.1, SDs = 0.73).
Of the 1701 participants, 363 (21%) were excluded because they completed <5 weekly surveillance reports, resulting in 1338 participants included in T2 surveillance analyses. The characteristics of the excluded participants did not differ significantly from those included (data not shown). The mean number of surveillance reports per participant was 16.2 (SD = 7.1) and the average weekly SRH report was “very good” (median = 4.0, mean = 4.0, SD = 0.63).
Stability of SSS over approximately 7 months and correlates of change
SSS ratings at T1 were highly predictive of SSS ratings at T3 (unadjusted beta = .59 (±.02), p < .001); SSS ranking at T1 explained 35 percent of the variance at T3. Over half (59%) of the participants placed themselves on a different rung of the ladder at T3 than at T1, but most changes were minor. In fact, 82 percent of participants offered either the same rating or were within ±1 point of their original rating. Much of the change can be characterized as regression toward the mean. Participants with the lowest SSS at T1 increased their ranking at T3 by an average of +0.91 steps (95% confidence interval (CI) = 0.67–1.13), while those with the highest SSS reduced their ranking by −1.44 (95% CI = −1.77, –1.10; Supplemental Figure A).
As presented in Table 1, SSS at T1 was associated with most of the demographic, objective SES, health, health behaviors, and work characteristics we examined. When all these factors were entered into a multivariate model, change in SSS at T3 (i.e. SSS at T3 adjusted for SSS at T1) was independently associated with factors listed in Supplemental Table A, including job satisfaction and security.
Prospective associations between SSS and subsequent health reports
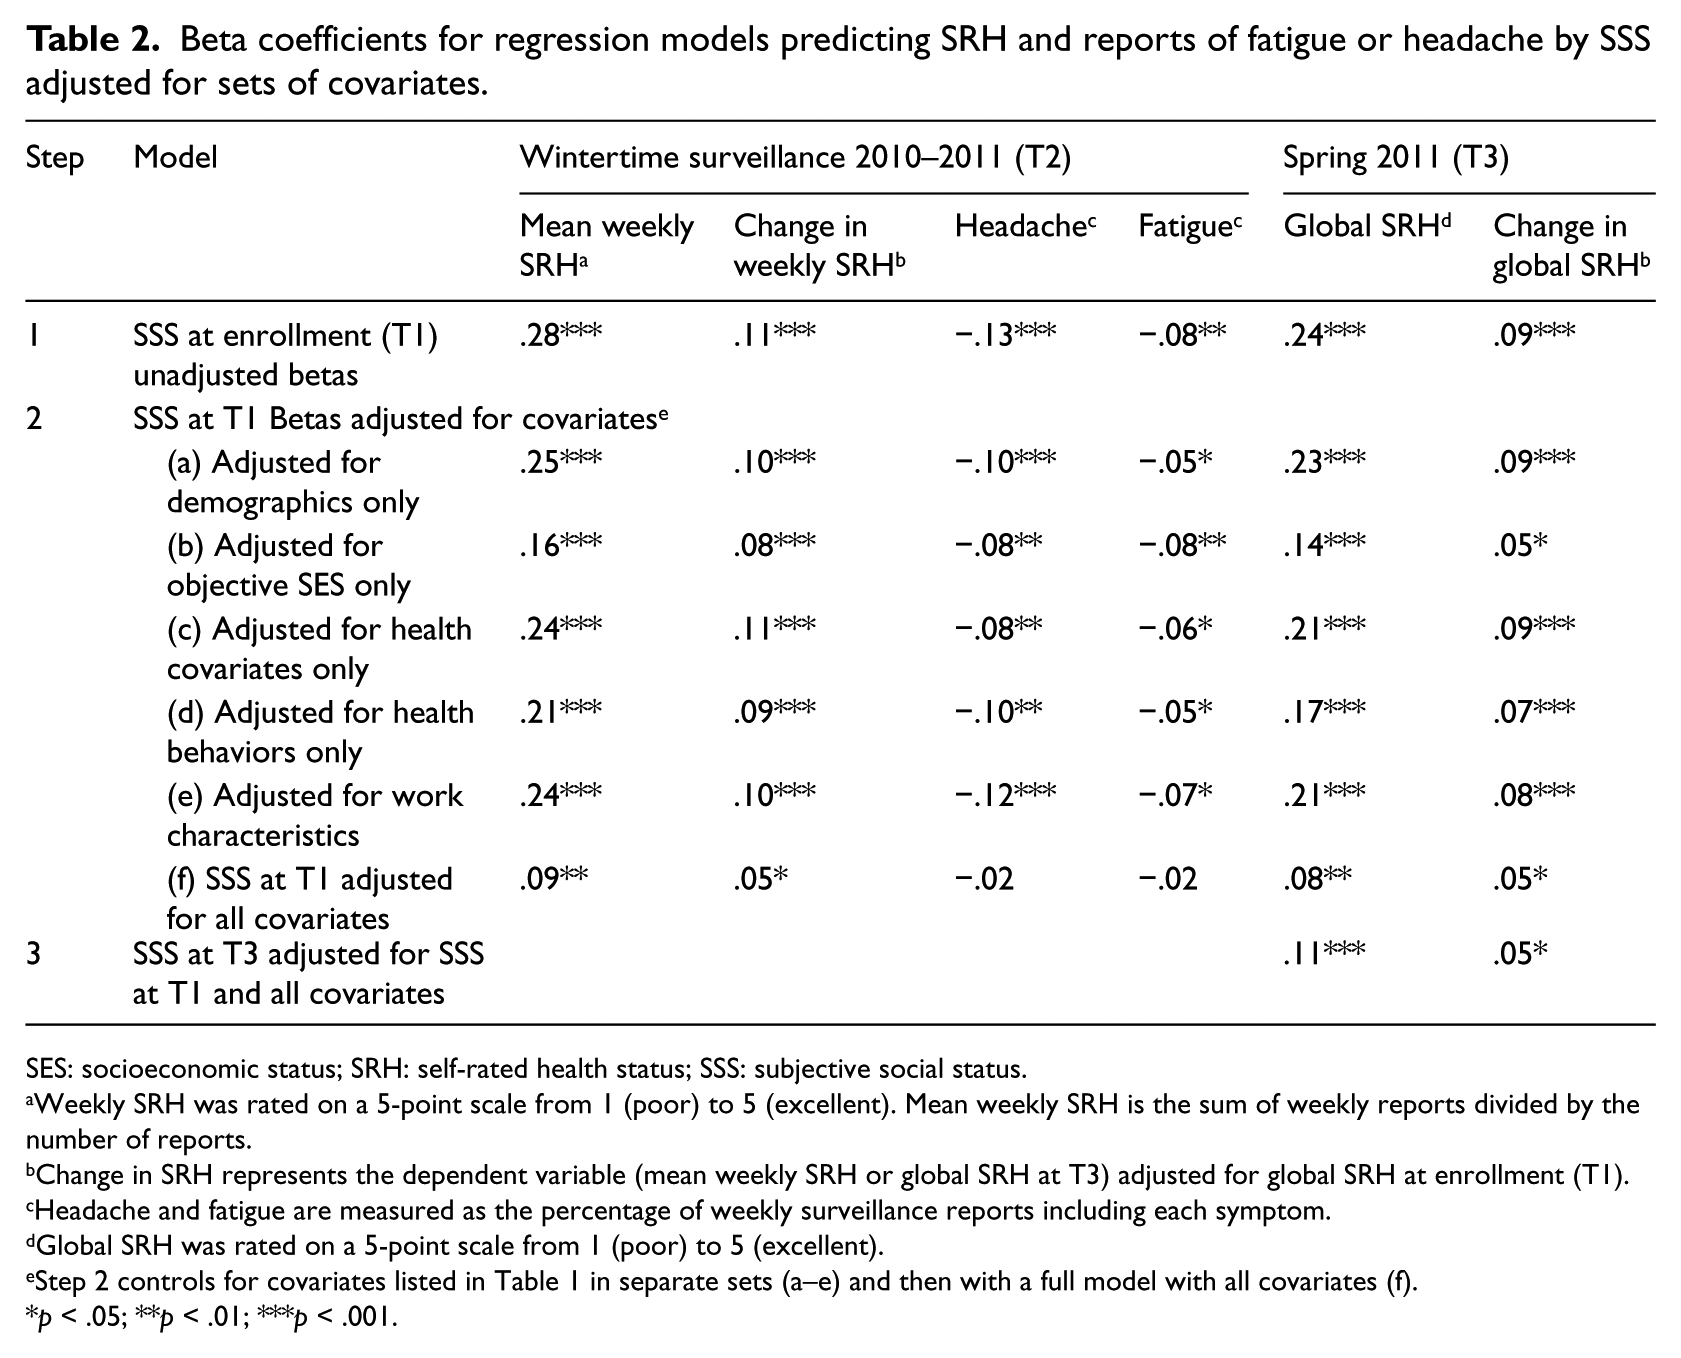
SSS at enrollment was significantly associated with all subsequent health reports (Table 2, step 1). HCP with higher SSS at T1 had higher average weekly SRH during surveillance, fewer reports of headache and fatigue, and higher global SRH ~7 months after enrollment. After the two highest steps in the SSS ladder, each step decline in SSS was associated with significantly lower weekly SRH reports (Supplemental Figure B). A similar gradient was also noted for weekly reports of fatigue and headache (Supplemental Figure C) and for global SRH at T3 (Supplemental Figure D).
Beta coefficients for regression models predicting SRH and reports of fatigue or headache by SSS adjusted for sets of covariates.
SES: socioeconomic status; SRH: self-rated health status; SSS: subjective social status.
Weekly SRH was rated on a 5-point scale from 1 (poor) to 5 (excellent). Mean weekly SRH is the sum of weekly reports divided by the number of reports.
Change in SRH represents the dependent variable (mean weekly SRH or global SRH at T3) adjusted for global SRH at enrollment (T1).
Headache and fatigue are measured as the percentage of weekly surveillance reports including each symptom.
Global SRH was rated on a 5-point scale from 1 (poor) to 5 (excellent).
Step 2 controls for covariates listed in Table 1 in separate sets (a–e) and then with a full model with all covariates (f).
p < .05; **p < .01; ***p < .001.
Global SRH was largely stable between T1 and T3 (R = .62, p < .001); in fact, 64 percent of participants offered the same global SRH report at both times. Nonetheless, lower SSS at T1 was associated with significant linear declines in weekly SRH at T2 and global SRH at T3 (Table 2, step 1). To illustrate the association between SSS and change in SRH, we also examined categorical declines and improvements in global SRH between T1 and T3. In this cohort of HCP working full-time, the vast majority (81%) described their global health at T1 as very good or excellent; only 19 percent described their health as good, fair, or poor. Of those who started in very good or excellent health, HCP with lower SSS at T1 were more likely to experience a decline in global SRH (to good, fair, or poor health) at T3 (beta = −.32 (±.07), p < .001). Among those in the low to moderate SSS (ladder rungs 1–5), 15 percent (56/385) who started with very good or excellent health declined to good, fair, or poor SRH at T3 compared to 4 percent (11/268) among those with very high SSS (ladder rungs 8–9); expressed as odds, the odds of decline in global SRH for those with low to moderate SSS was four times that of the odds of decline among HCP with very high SSS (odds ratio (OR) = 4.0, 95% CI = 2.04–7.22). Conversely, looking at those who started with less than excellent global SRH at T1 (i.e. poor, fair, good, or very good), higher SSS was associated with improvement to excellent global SRH at T3 (beta = .15 (±.07), p < .0); only 12 percent (51/420) of HCP with low to moderate SSS improved to excellent health compared to 20 percent (28/137) of HCP with very high SSS (OR = 0.54, 95% CI = 0.32–0.89).
Maintenance of prospective SSS effects after adjusting for covariates
The prospective association between SSS and subsequent weekly and global SRH and reports of weekly fatigue and headache remained statistically significant after adjusting for demographic characteristics (Table 2, step 2a), objective SES (step 2b), health covariates (step 2c), health behaviors (step 2d), and work characteristics (step 2e).
In addition, change in SSS between T1 and T3 was positively associated with global SRH and change in SRH at T3 (Table 2, step 3). In other words, reporting SSS at a higher rung on the SSS ladder at T3 compared to T1 was associated with better global SRH at T3 and improvements in global SRH from T1 to T3.
When all study variables were entered into multivariate models, SSS at enrollment continued to be a significant predictor of weekly SRH and global SRH and change in both measures but was no longer associated with headache or fatigue (Supplemental Table B). Occupational rank was independently associated with weekly and global SRH along with SSS in the multivariate models. As illustrated in Figure 1, mean weekly SRH increased with each tertile of occupational rank, and within each tertile, weekly SRH increased with higher SSS. Other consistent independent predictors of worse health reports (noted for at least half the outcomes examined) were higher BMI, more medical visits for ARI during the previous year, less exercise, longer sleep latency, poorer sleep quality, work exhaustion, and working at the Oregon study site (Supplemental Table B).

Mean weekly self-rated health status (SRH) during surveillance with 95% confidence intervals by tertiles of occupational rank and subjective social status (SSS) at enrollment.
Potential mediators of the association between SSS and SRH
In secondary analyses, the role of health covariates, health behaviors, and work characteristics as potential mediators of the association between SSS and mean weekly SRH and global SRH was examined. Significant indirect effects of SSS on both SRH outcomes were observed for BMI, medical visits for ARI, smoking, exercise, sleep quality, and perceived job security (Supplemental Table C).
Discussion
In our prospective cohort study of HCP, SSS at enrollment was associated with all subsequent health reports we examined, and in most cases, these associations were independent of participant and work characteristics. HCP with lower SSS had poorer average weekly SRH during 20 weeks of wintertime surveillance, reported more headaches and fatigue, and had lower global SRH at the end of the study. Lower SSS was also associated with subsequent declines in weekly and global SRH. Over the ~7 months of our study, HCP who placed themselves on the bottom half of the SSS ladder (rungs 1–5) had four times the odds of experiencing a decline in global SRH and one-half the odds of improving to excellent SRH compared to HCP at the top of the SSS ladder (rungs 8–9). Nonetheless, the effects we observed were not limited to individuals with the lowest SSS. We consistently observed a gradient in the association between SSS and health reports. Most notably, each step decline in SSS starting at the highest rungs (8–9) was associated with significantly poorer average weekly SRH.
Although prior research has established that SSS and health are interconnected (Adler, 2009), what is less clear is whether this association is causal and if so through what mechanism. Our findings increase the plausibility of a causal connection in three ways. First, by examining weekly reports of SRH, fatigue, and headache during 20 weeks of surveillance, we established that SSS is associated with health experiences over an extended period of time. Second, we found that SSS predicted linear changes in weekly and global SRH and categorical shifts toward improved or worsened global SRH. Thus, the effect of SSS is not limited to brief, cross-sectional snapshots of health but appears to predict sustained health states and different trajectories of health status. Third, the prospective associations between SSS and subsequent weekly and global SRH and changes in SRH are robust and remain after adjusting for demographics, objective SES, health and health behaviors, and work characteristics.
Why do HCP with lower SSS report poorer SRH? Consistent with previous studies (Cohen et al., 2008; Manuck et al., 2010; Sacker et al., 2001; Singh-Manoux et al., 2003; Thompson et al., in press), our data suggest that objective physical health, health behaviors, and perceived job security may explain part of this connection. HCP with lower SSS had higher BMI, visited the doctor more often for respiratory illnesses, were more likely to smoke, exercised less, had poorer sleep quality, and were more likely to see their job security as poor. These factors in turn were associated with worse self-rated health.
Part of the SSS–SRH association is also likely due to underlying differences in objective SES. Consistent with prior studies (Dunn et al., 2006; Wolff et al., 2010), we found that both objective SES and SSS maintained independent associations with weekly and global SRH in multivariate models. Although two prior studies found the association between occupation and global SRH disappeared or was greatly diminished after controlling for SSS (Adler et al., 2000; Singh-Manoux et al., 2005), in our study, both SSS and occupational rank had independent effects of similar magnitude. Overall, the physicians and nurse managers in the highest occupational tertile had better SRH than the medical assistants and phlebotomists in the lowest tertile, but within each of these tiers, HCP with higher SSS had better SRH than those with lower SSS. Thus, HCP with similar jobs and similar objective status had diverse subjective experiences of their status, and these variations in turn were associated with differences in subjective health over time. As one reviewer noted, the extent to which this may reflect underlying differences in optimism of self-enhancing attitudes (e.g. Rasmussen et al., 2009) deserves further investigation.
Although the predictive value of SSS is clear, further research is also needed to understand the measurement characteristics and meaning of the SSS ladder. The correlation we observed between SSS reports made ~7 months apart (beta = .59) and the percentage of off-diagonal or inconsistent reports (59%) was almost identical to observations from two previous studies (Goodman et al., 2007; Operario et al., 2004). Given that our cohort had stable jobs, income, and education during this period, the amount of shared variance between measurements (R2 = 35%) was less than we expected. However, shared variance probably underestimates the true reliability of single-item measures (Heise, 1969; Hunter and Schmidt, 1990). Nonetheless, we found that the vast majority of participants (82%) placed themselves on the ladder at the end of the study within ±1 rung of their original ranking. Reports were least reliable at the extreme ends of the ladder. Therefore, assuming that researchers continue to collapse extreme categories and follow linear tests with comparisons of SSS in tertiles or quintiles, as we and others (Cohen et al., 2008; Thompson et al., in press) have done, the interpretation of findings should be robust despite the modest instability.
Many of the factors associated with initial SSS are associated with changes in SSS ranking over time. Not surprisingly, HCP with less education and lower occupational rank placed themselves lower on the SSS ladder initially and were more likely to report even lower SSS when asked again. Lower job satisfaction and poor job security were also associated with declines in SSS. Change in SSS was also associated with changes in global SRH; increases in SSS were associated with improvements in weekly and global SRH. Thus, instability in SSS is not entirely random and is certainly worthy of further investigation.
Among our study’s strengths is its focus on HCP at medical centers in two geographic regions, its use of medical records to quantify medical utilization for acute and chronic illness, and the repeated measure of SRH during weekly surveillance. To our knowledge, this is the first study to examine the association between SSS and weekly rates of headache and fatigue, which are interesting health outcomes because they are among the most common health complaints (Verbrugge and Ascione, 1987) and closely tied to differences in global SRH (Jylha, 2009). Another strength of this study is our focus on occupational rank and work characteristics, which are underexamined factors in the social disparities literature, especially in the United States (Braveman et al., 2005; Clougherty et al., 2010; Demakakos et al., 2008). In addition to indicating that work characteristics may mediate part of SSS’s influence, the persistence of SSS–SRH associations after adjusting for job satisfaction is also informative because it further counters arguments that SSS–SRH associations are due to mono-method bias (Miyakawa et al., 2012; Singh-Manoux et al., 2003).
Our study also had at least four limitations. First, given that cohort consisted of mostly White working adults, variations in demographic characteristics, health, and SES were restricted, which may have limited our ability to detect associations that exist among those with poor health or low SES or consider how these associations may differ for racial or ethnic minorities, as some have observed (Wolff et al., 2010). Second, the extent to which our findings generalize to other populations or would be repeated with alternative methods of data gathering (e.g. interviews vs Internet questionnaires) is unknown. Third, the very good or excellent global SRH of the vast majority of participants, the short time interval between assessments, and the stability of global SRH reports reduced our ability to study change in SRH. Although it is noteworthy that we noted small but significant and robust associations between SSS and SRH change despite these restrictions, further research is needed to examine these associations over extended periods of time and with additional measures of both subjective and objective health outcomes.
Fourth, a limitation we share with other SRH research is a lack of clarity in what SRH represents (Bailis et al., 2003; Jylha, 2009). Given that very few participants experienced poor or fair SRH during our study, the relationships we observed are probably best understood as centering on differences in states of wellness and well-being rather than differences in illness or disease. Although medical utilization does not fully characterize objective health or disease burden, the fact that the magnitude of the SSS–SRH effects we observed remained largely unchanged after controlling for BMI and acute and chronic medical utilization would also suggest that SSS is connected to a self-concept of health that is not fully dependent on these objective health indicators.
In conclusion, we observed consistent associations between SSS and subsequent health reports. Lower SSS appears to be associated with conditions that tend to sustain less than excellent perceived health, increase the likelihood of declines in SRH, and reduce the likelihood of improvement. The subjective experience of SES appears to add to and accentuate the effects of objective SES on SRH. Although the influence of SSS may be mediated in part by differences in health behaviors, further research is needed to elucidate the interconnection between the subjective experiences of health and social status.
Footnotes
Acknowledgements
The authors thank Sam Bozeman, Samanth Beeram, Meredith Vandermeer, Lydia Clipper, Jennifer Gerber, Eresha Bluth, Jennifer Carlston, Ashley Kossie, Jacqueline Flores, Sarah Spencer, and Sue Reynolds for their assistance in project planning and data management. They also appreciate the contributions of their research assistants. They thank Alicia Fry, Jerry Tokars, and Joseph Bresee for feedback on early versions of this manuscript. Finally, they also thank the healthcare professionals at both study sites for participating in this study.
Endnote
Supplemental Table and Figures are available from the corresponding author, Mark G. Thompson, at
Declaration of conflicting interests
The authors report no conflict of interests. The findings and conclusions in this report are those of the authors and do not necessarily represent the views of the Centers for Disease Control and Prevention, Abt Associates, Inc., Kaiser Permanente Center for Health Research, or Scott & White Healthcare.
Funding
This study was supported by the Centers for Disease Control and Prevention (contract 200-2010-F-33396 to Abt Associates, Inc.)