
Abstract
Results of a cluster-randomized trial of a Screening and Brief Intervention for heavy drinkers in dental practice are reported. Data were obtained from 103 heavy drinking patients recruited from randomized intervention (7; n = 50) and control (6; n = 53) practices. Analysis of data revealed that 6-month decreases in total drinks per week were significantly (p < .05) greater for heavy drinking intervention (43%) than control patients (21%)—a 4 drink per week difference. Similar decreases were obtained for quantity and frequency among intervention patients compared to control patients. Despite power limitations, the 6-month results support the effectiveness of the Screening and Brief Intervention.
Introduction
Although alcohol use disorders are among the most prevalent and costly global conditions (Rehm, 2009), only 8.1 percent of those who need alcohol treatment in the United States receive it (Substance Abuse and Mental Health Services Administration (SAMSHA), 2012). As few heavy drinkers receive formal treatment, Screening and Brief Intervention (SBI) protocols have been developed to identify and intervene with heavy drinkers before more severe problems develop. These SBI approaches have been demonstrated effective in primary care and emergency departments in reducing heavy drinking and increasing treatment utilization (Hettema et al., 2005; Kaner et al., 2009; Vasilaki et al., 2006). Consensus panels have recommended brief interventions as “best practices” for people at risk of substance abuse (SAMSHA, 1999), and there is increasing interest in applying these approaches in other settings (National Institute on Alcohol Abuse and Alcoholism (NIAAA), 2005a). However, use of alcohol SBI in dental practice has only recently been suggested (McRee, 2012; Shepherd et al., 2011).
Support for the viability of alcohol SBI in dental practice is found in evidence that a majority of US adults (60% to 70%) visit a dental provider at least annually (Dye et al., 2007) and estimates of the prevalence of alcohol problems in dental practice of approximately 25 percent (Miller et al., 2006). Although alcohol SBI in dental practice appears rare (Cruz et al., 2005; McAuley et al., 2011), our own web-survey of dental practitioners (cf. Neff et al., 2013) indicated that a majority of dentists surveyed agreed (either strongly or agreed) that dental practice offered an “ideal opportunity” to screen and counsel about alcohol (76%), that screening and counseling for alcohol were appropriate in dental practice (71%), and that screening and counseling were appropriate for the dentist’s roles (78%). Furthermore, despite practitioner fears about patient resistance, Miller et al. (2006) reported that 75 percent of dental patients believed that alcohol screening and counseling were appropriate in dental settings. Finally, alcohol SBI in dental practices is consistent with Public Health Service (PHS) clinical practice guidelines for alcohol screening (U.S. Preventive Services Task Force, 2004), and fits ongoing dental initiatives in oral cancer screening and tobacco cessation (Carr and Ebbert, 2012).
To address the lack of SBI protocols for use in dental practice settings, we developed a 3- to 5-minute protocol incorporating motivational interviewing (MI; Miller and Rollnick, 2012) techniques and personalized normative feedback (PNF) to help reduce heavy drinking. Detailed information regarding the rationale, theoretical foundation, development, and content of the intervention is presented elsewhere (Neff et al., 2013).
Multi-level conceptual framework regarding intervention effectiveness
Although the primary theoretical foundation for the intervention involves use of PNF and MI principles described in Neff et al. (2013), from a broader perspective, we view effectiveness of alcohol SBI in dental practice as an “organizational innovation” requiring a multi-level conceptual model (Frambach and Schillewaert, 2002). Thus, we posit that intervention effectiveness may be subject to a variety of influences at both the patient and practice levels. At the patient level, patient demographics found to be related to drinking (such as age, gender, and income; cf. Grant et al., 2004) and baseline drinking patterns may influence intervention effectiveness. For example, intervention patients with higher levels of baseline drinking who are given normative feedback showing their substantially higher risk of oral cancer might be expected to show greater decreases in alcohol use relative to those who report lower baseline alcohol use. Furthermore, as discussed by Room (2004), smoking and drinking are consistently correlated empirically and, as both are dependence-producing substances, smoking may complicate efforts to reduce alcohol consumption.
At the practice level, the internal structure of an organization may influence the adoption of innovations; thus, practices with more extensive staff resources may be better able to implement SBI effectively (Barney et al., 2011). Similarly, as organization size has been found positively associated with innovation adoption (Damanpour, 1992), larger practices with more staff and dental chairs may have more resources to facilitate successful implementation of SBI. Relatedly, while greater numbers of dentists and hygienists may positively impact SBI implementation, the ratio of hygienists per dentist may also represent an important resource, as hygienists deliver the intervention. Furthermore, prior experience in the practice with other preventive interventions (such as fluoride and dental sealants or tobacco cessation) may facilitate effective SBI implementation (Chapko, 1991). Finally, we posit that those practices in which practitioners maintain active professional contacts (conferences, journals, continuing education) will deliver SBI more effectively (Chapko, 1991).
Overall, we hypothesize that patients in dental practices receiving the SBI will report significantly greater reduction in alcohol consumption from baseline to 3-month follow-up and baseline to 6-month follow-up as compared to control patients. Furthermore, we hypothesize that patient-level and practice-level variables represent potentially important predictors of intervention effectiveness.
Method
Trial design
We conducted a cluster-randomized trial (CRT) using patients screened for heavy drinking from 13 participating dental practices in the Hampton Roads area of southeast Virginia, randomly assigned to intervention (7 practices; n = 50) and control (6 practices; n = 53) practices. Practice staff mailed out study invitations to patients scheduled for routine dental visits (dental emergencies were excluded) within the next 30–60 days. Patients returning reply cards in response to the mailed inquiry were screened via brief 5–7 minute telephone interviews conducted by trained research staff. English-speaking drinkers aged 21 to 55 years meeting drinking eligibility criteria defined below were invited to participate. Intervention patients received the 3- to 5-minute hygienist-delivered intervention during a scheduled dental hygiene visit; control patients received standard dental care. The average length of time between screening and intervention was 29.17 days (standard deviation (SD) = 11.80 days). Patients recruited within both intervention and control practices completed 20-minute telephone interviews conducted by trained research staff at baseline and at 3- and 6-months post-intervention. All patients were mailed US$25, US$35, and US$45 gift cards for completing the baseline, 3-, and 6-month interviews, respectively. All study procedures were approved by the University’s Institutional Review Board.
Participants
Dental practice recruitment
Predominantly urban community dental practices were recruited between May 2010 and February 2011 from listings of practices in the Hampton Roads area compiled from state Dental Association membership lists, dental insurance provider lists, as well as local phonebook listings. All listed dentists were mailed an invitation to participate in a university-sponsored oral cancer prevention study, which included a letter of endorsement from the state Dental Association and a reply card if they desired more information. Of the initial 387 mailings (see Figure 1), reply cards were returned by 83 dentists, a 21 percent response rate. Among those replying, 35 practices (42%) received luncheon presentations with dentists and staff to explain the study and invite participation. Of these, 15 practices initially agreed to participate. Two practices withdrew before participating; thus, 3 percent of practices contacted (13 of 387) agreed to participate in the CRT. As practices entered the trial, they were sequentially randomized to intervention (7) or control (6) groups following a simple software-generated random sequence. Practices were not blinded to their assignment.

Flow chart showing practice and patient enrollment, practice randomization, and study follow-up.
Patient recruitment
Patients were recruited within randomized practices beginning in December 2010 with final follow-up data collection ending in January 2012. The “Oral Health Project” was described as involving a brief discussion with a dental hygienist regarding “ways to improve your oral health and reduce oral cancer risk.” The study was not described as an alcohol intervention, though patients were told that discussions may include smoking and drinking. Patients were not explicitly blinded; they were advised that they would receive either intervention or control treatments.
Results of the patient recruitment process are summarized in Figure 1. Of 10,941 patient invitations mailed, 1154 (10%) patients expressed interest in the study. Of these, 1039 were screened (90% of replies), yielding 174 age-eligible drinkers meeting inclusion criteria (20%). Study eligible drinkers were those exceeding National Institute on Alcohol Abuse and Alcoholism (NIAAA) (2005b) recommended limits for either (1) total drinks per week (>14 drinks per week for males or >7 drinks per week for females) or (2) one or more binge drinking episode (5+ drinks for males or 4+ drinks for females) in the past 30 days. Ineligible drinkers included 152 age ineligible, 232 non-drinkers, and 481 drinkers not meeting drinking criteria. Of eligible drinkers, 67 patients assigned to intervention practices were excluded who did not receive the intervention during scheduled hygiene appointments, mainly in cases where intervention materials did not arrive at practices prior to appointments. Four other patients were excluded for missing data or other reasons. The resulting study sample consisted of 53 control and 50 intervention patients at baseline, with 42 control and 39 intervention patients at 6 months (completion rates of 78%–79% compared to baseline). Patients (N = 103) were predominantly female (64%), White (91.3%), college-educated (68%), and employed (85%). Mean age was 39.7 years (SD = 9.8 years); mean years of education was 15.52 (SD = 2.45). Average household income was in the range of US$60,000 to US$70,000.
Interventions
Alcohol SBI intervention
Key to the intervention was a computer-generated 1-page personalized feedback report (sample form available in Neff et al., 2013). The feedback report was generated from information provided by the patient in a brief telephone screening prior to the dental visit, which addressed alcohol use, smoking, and other oral health-related behaviors.
The first section of the feedback report summarized the patient’s reported preventive oral health behaviors (brushing, flossing, and dental visits), followed by an estimate of the associated reduction in risk of later tooth loss as derived from data in the Veterans Affairs Dental Longitudinal Study (Kressin et al., 2003). This section served to build rapport with the patient and provided an opportunity for the dental hygienist to reinforce preventive oral health behaviors and thus build patient self-efficacy.
The second section of the feedback report provided a summary of the individual’s reported smoking and drinking behaviors, as well as a colorful graphic comparing self-reported drinking to gender- and age-matched national drinking norms derived from the 2001 National Epidemiologic Survey of Alcohol Related Conditions (Chan et al., 2007) As explained in our earlier paper (Neff et al., 2013) PNF (Moreira et al., 2009) brings the patient’s drinking to their attention and helps to initiate consideration of possibilities for change. Hygienists were trained to use MI techniques like asking open-ended questions and responding to patient comments and questions in ways that encourage the patient to think and talk about possibilities for behavior change (Miller and Rollnick, 2012).
The final section of the report graphically illustrated the individual’s risk of developing oral cancer based upon their combination of smoking and drinking behaviors, compared to a gender-matched non-drinker/non-smoker (Kabat et al., 1994) for different scenarios: (1) at their current level of drinking/smoking, (2) if they drank no more than three drinks per day, and (3) if they neither smoked nor drank. The information provided here was designed to capitalize on patient interest in minimizing oral cancer risk. This section was intended to encourage the patient to weigh the pros and cons of their current drinking, and to begin thinking about change. Hygienists were trained to encourage discussion with open questions such as “What do you think of that?” and “Where does this leave you in thinking about your risk?”
Assessment only control condition
Control patients received routine care, typically involving medical history update, oral examination, periodontal examination, dental prophylaxis (cleaning), and polishing, as well as general oral health education. Dental hygienists were blinded as to the drinking status of their patients.
Study outcome measures
Data were gathered via approximately 20-minute telephone interviews at baseline, 3, and 6 months on the following measures.
Alcohol consumption
Our primary drinking outcomes included total drinks per week, the product of drinking frequency (typical drinking occasions per week) and drinking quantity (typical drinks per occasion) over the past 30 days. Quantity and frequency were included to allow comparison of changes in alcohol consumption with regard to each component of total drinks per week.
Patient-level covariates
To control for patient characteristics that might influence response to the intervention, patient’s age, total family income (coded in US$10,000 intervals ranging from 1 = under US$10,000 to 11 = over US$100,000), and smoking status (0 = non-smoker; 1 = smoker) were assessed. Smoking was assessed with the rationale that many heavy alcohol users also smoke and the combination of alcohol use and smoking may hinder treatment effects Room, 2004).
Practice-level covariates
To control for practice characteristics that might influence intervention effectiveness, participating practices provided information on practice size measured by the number of dental chairs in the practice, and the number of full- or part-time dental hygienists and dentists. In addition, we assessed three measures of practice resources: (1) ratio of hygienists per dentist, (2) current use of dental preventive practices—the sum of three items adapted from Fiset and Grembowski (1997) that assessed preventive measures in dental practices: (a) use of chlorhexidine rinses for cavity prevention, (b) chlorhexidine rinses for gingivitis control, and (c) salivary flow tests (α = .589) —and (3) composite average of use of tobacco cessation practices—the mean of 14 items that asked staff to estimate the proportion of patients who smoke with which they utilize different tobacco cessation practices specified in the American Dental Association (ADA) 5As (ask, advise, assess, assist, and arrange) tobacco cessation initiative (α = .959).
Overview of the analysis plan
We began by examining the data for distributional assumptions followed by comparisons between intervention and control groups on model variables to evaluate baseline equivalence. Comparisons utilized Pearson chi-square statistics for categorical variables and independent sample t-tests for continuous variables.
The principal analyses of interest involved comparison of changes between baseline and both 3- and 6-month follow-up between intervention and control groups. Models were fitted with two levels, practice and patients, with patients clustered under practices. A mixed-model analysis of covariance (ANCOVA) approach was used to analyze the data with practice included as a random factor to account for the positive intra-class correlation (ICC) between patients within practices. Estimation and significance testing were carried out by the MIXED procedure of the SAS software (version 9.3; SAS Institute Inc., 2011), using the restricted maximum likelihood (REML) estimation method with related F-tests. All practice-level covariates were centered at their group means. The estimates from the final models were used to calculate confidence intervals and significance tests for contrasts of interest. Specific contrasts were conducted on adjusted means using Tukey corrections for multiple comparisons. In addition to standard t-tests for significant differences, we also present additional measures of the magnitude of observed changes: (1) estimates of effect size and (2) percent decrease from baseline.
Sample size for the study was calculated taking into account the clustering of patients within practices assuming a weak ICC of 0.01. To achieve a power of 80 percent to detect a 20 percent difference at follow-up in total drinks per week between intervention and control groups at alpha = 0.05, calculations indicated a minimum sample size of 640 patients from 32 practices (20 patients per practice).
Given these a priori calculations, the observed number of practices (13) and cases at the 6-month follow-up (42 control and 39 intervention) provide limited power to detect main effects and critical higher order interactions of interest (e.g. Intervention × Wave × Baseline Drinking Level). Given that the key hypotheses involve differences between intervention and control groups in drinking changes from baseline across waves, our analyses focused specifically on tests of simple main effects comparing total weekly consumption (the primary outcome of interest) across waves (baseline vs 3 months; baseline vs 6 months) within intervention/control and baseline total weekly consumption (“light” (≤ 6 total drinks per week), “moderate” (7–12 total drinks per week), and “heavy” (7–12 total drinks per week)) groups, adjusting for individual- and practice-level covariates. The rationale for grouping patients by baseline drinking was that the severity of oral cancer risk conveyed to patients in the intervention depended on baseline drinks per week, with the heaviest drinkers informed of the greatest risk. Cutoffs were established by dividing baseline total drinks per week roughly into thirds.
Results
Baseline equivalence
To test for baseline equivalence, intervention and control groups were compared on patient-level and practice-level variables.
Patient-level demographics
There were no demographic differences between intervention and control groups with regard to gender (64% female), race/ethnicity (91% White), employment status (85% employed), education (68% college educated), age (approximately 40 years), or income (approximately US$60,000–US$70,000). However, intervention patients were more likely to be current smokers (38%) than were control group patients (15%; χ2(1) = 6.98, p < .05). Also, comparing demographics of our study patients to data on patient characteristics provided by the practices, our study patients were significantly (p < .05) more likely than the practices they were drawn from to be female (64% vs 46%) and White (91% vs 66%).
Alcohol consumption outcomes
No baseline differences were found between the intervention and control groups on drinking measures. Both groups averaged around 10.08 total drinks per week (SD = 6.86) with a typical drinking frequency of 3.19 days per week (SD = 1.73) and typical drinking quantity of 3.23 drinks per occasion (SD = 1.57).
Practice-level covariates
Significant baseline differences were found on several practice-level variables. Specifically, control practices reported significantly fewer dentists (2.43 control vs 3.16 intervention; t(101) = −2.21, p < .05), though more hygienists (3.57 control vs 2.38 intervention; t(101) = 4.66, p < .01), and fewer dental chairs (6.17 control vs 7.88 intervention; t(101) = −3.18, p < .05). Furthermore, there was a higher ratio of hygienists to dentists (1.49) in control than in intervention (1.05) practices (t(101) = 4.62, p < .01), suggesting the possibility of greater staff resources to effectively adopt SBI in control practices.
Additionally, significant baseline differences were found on measures of current preventive practices. Control practices had significantly higher scores than intervention practices on current use of preventive practices (rinses for caries and gingivitis control, salivary flow; 4.20 vs 3.31; t(101) = 4.60, p < .01) as well as on a composite average use of tobacco cessation practices (50.7 vs 39.5; t(101) = 3.61, p < .01). Overall, greater staff resources and greater involvement in preventive practices at baseline among control practices suggest the need to adjust for these practice-level covariates.
Drinking outcomes by intervention group, wave, and baseline drinking level
Analyses were conducted for the primary drinking outcome total drinks per week. In addition, to elucidate changes in drinking outcomes, further analyses were conducted for secondary outcomes drinking frequency and in drinking quantity. All analyses were conducted with controls for covariates specified above to control for possible baseline differences.
Total drinks per week
Results for total drinks per week are shown in Table 1 and graphically presented in Figure 2.
Mean differences, effect sizes, and percent change between waves for consumption outcomes.
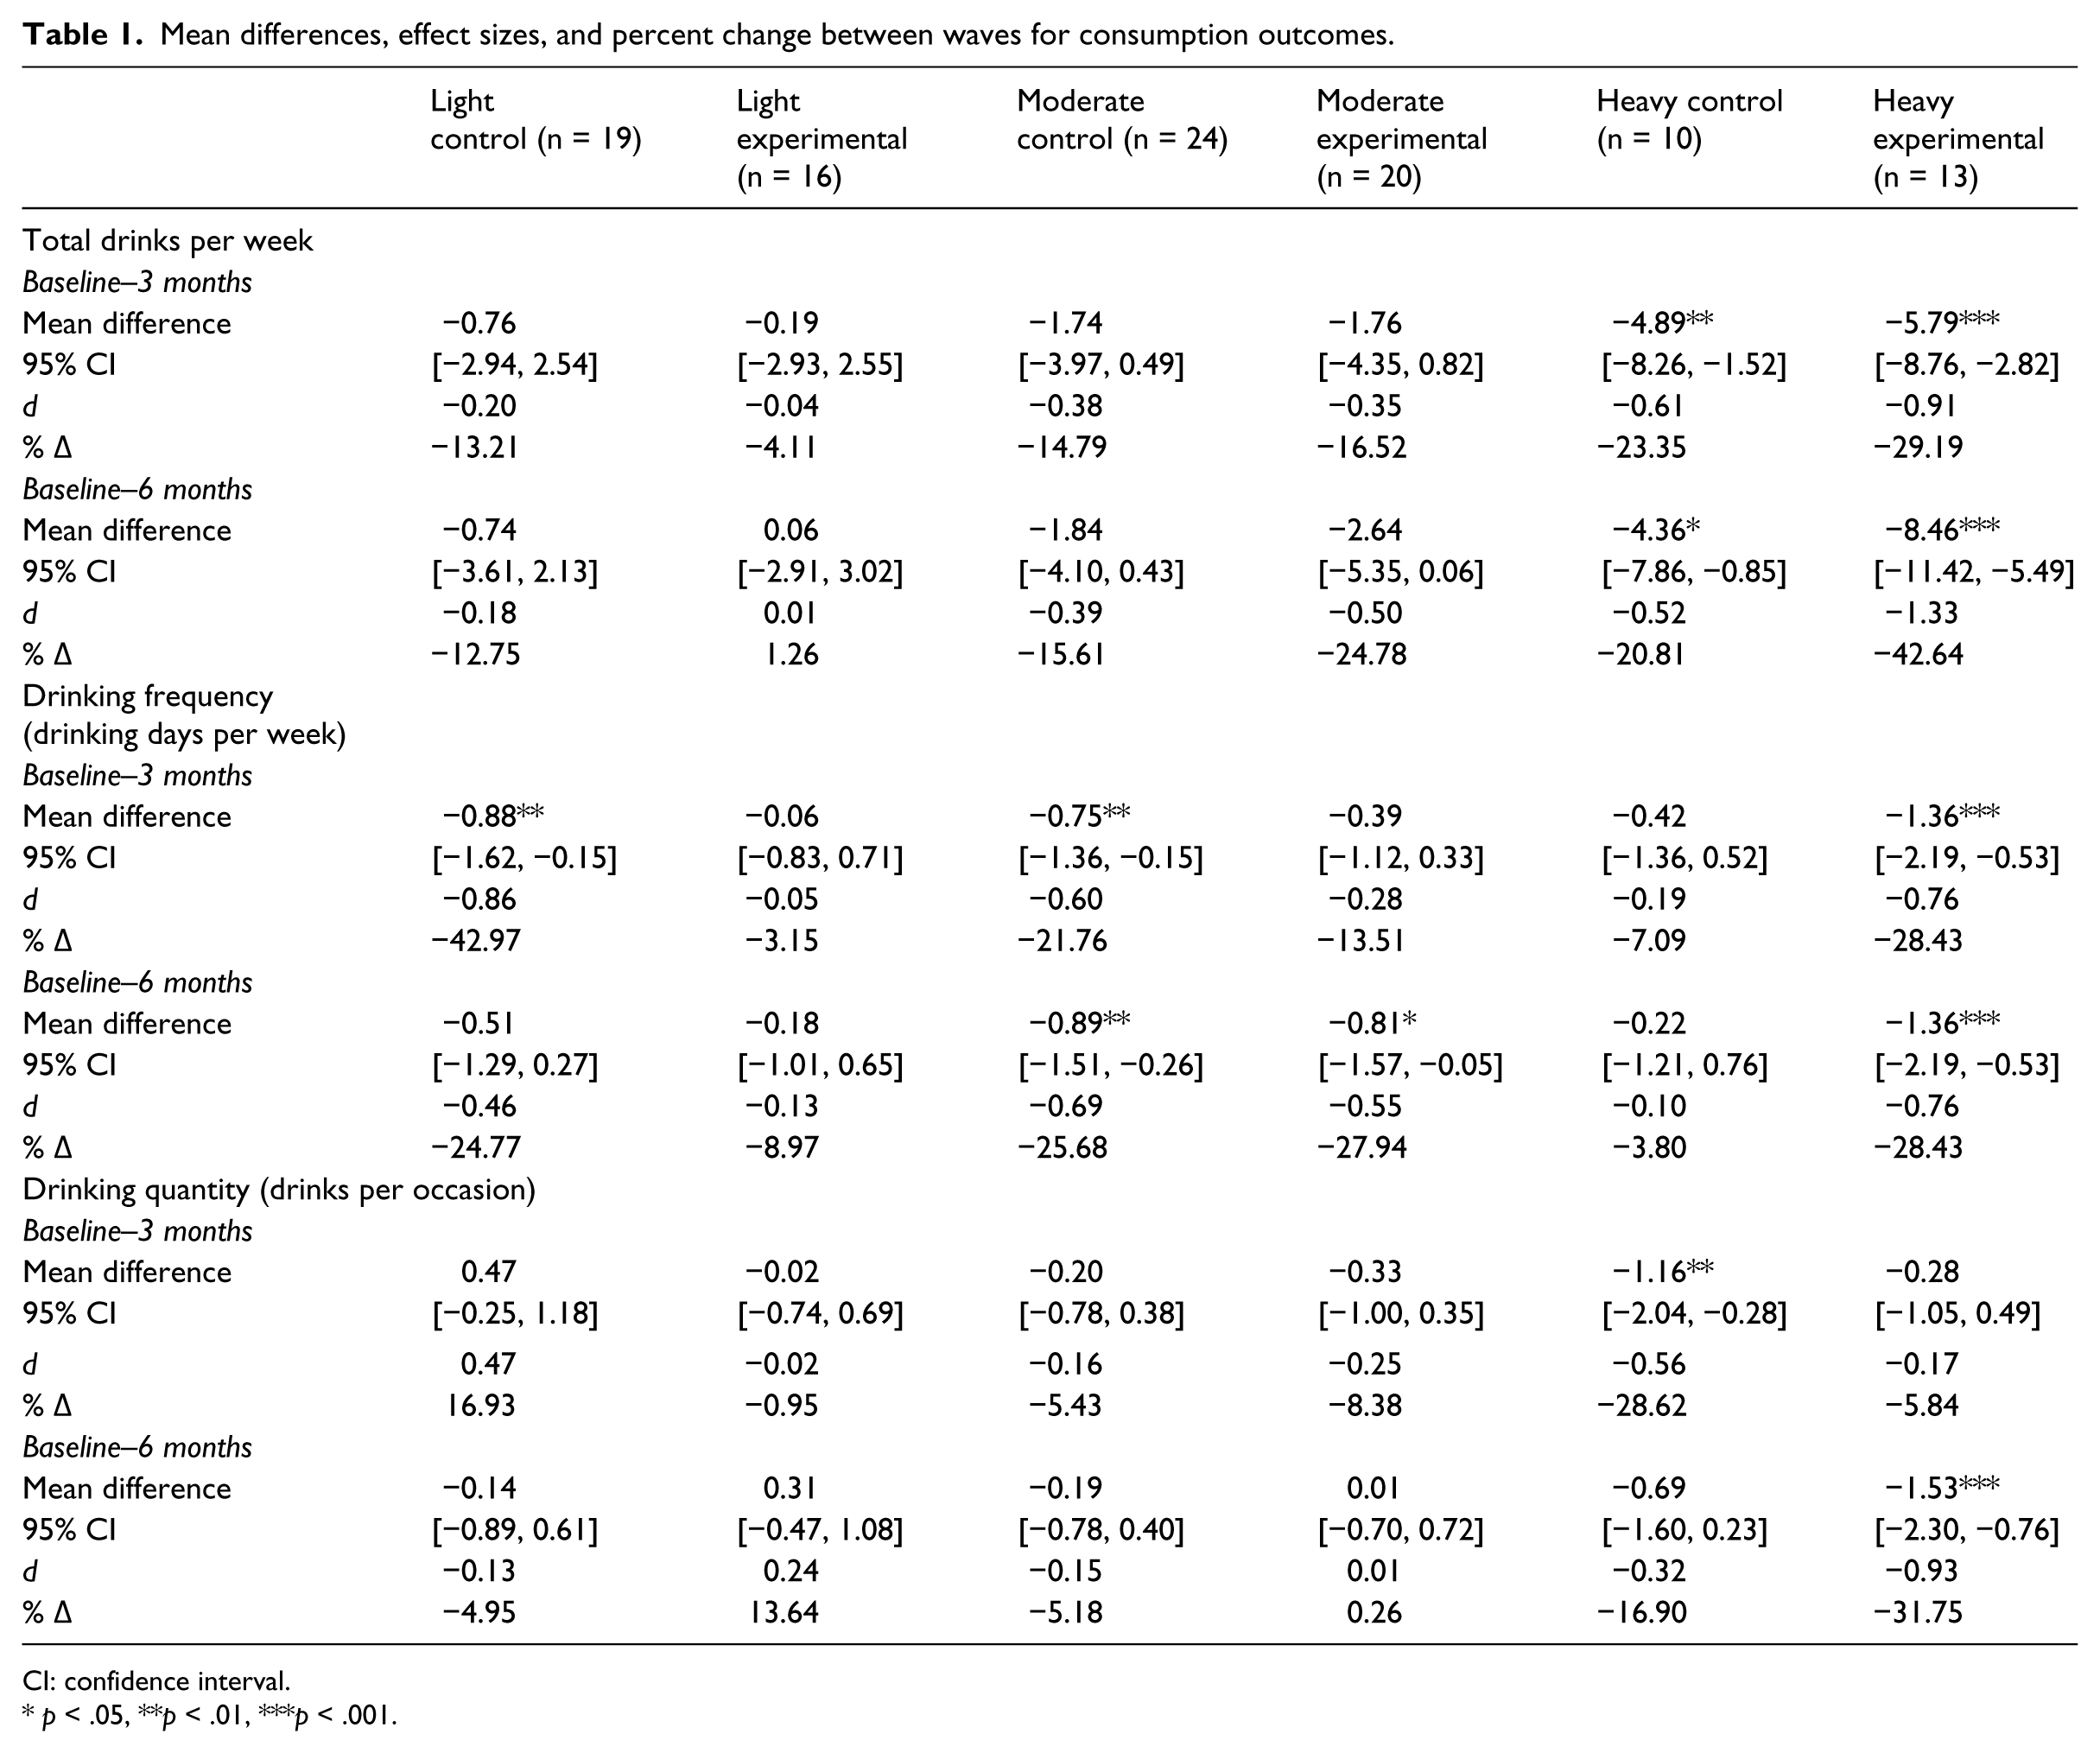
CI: confidence interval.
p < .05, **p < .01, ***p < .001.
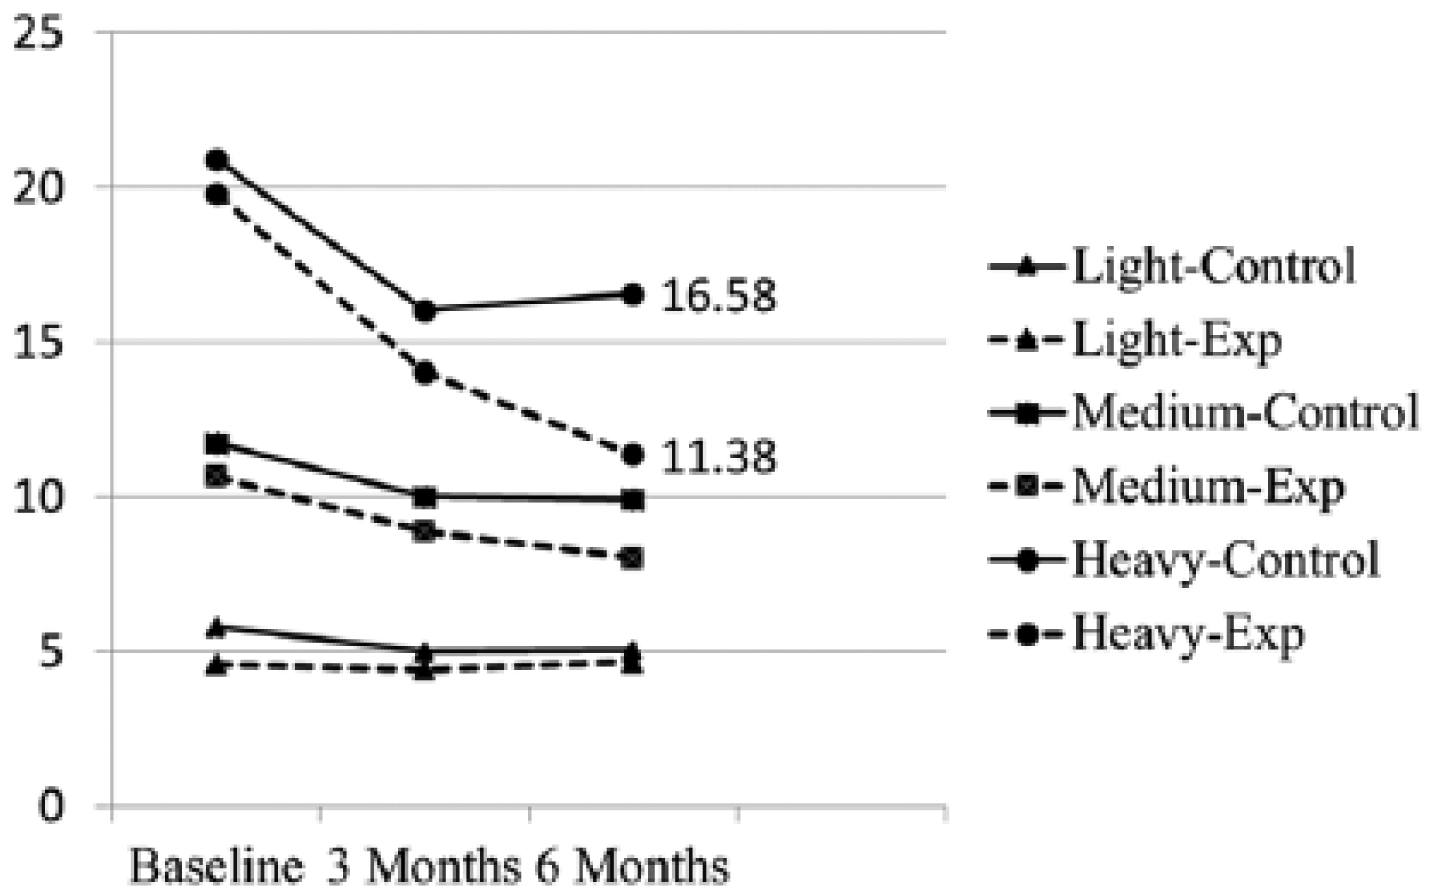
Adjusted mean total drinks per week by intervention, baseline weekly drinking, and wave.
None of the patient or practice-level covariates were significantly related to total drinks per week. While the Intervention × Wave × Baseline Drinking Level interaction was not significant (F(4,170) = 0.75, p > .05), mixed-model ANCOVA results indicated a substantial Wave effect (F(2,170) = 17.63, p < .05), reflecting significant decreases from baseline to 3 months in both intervention and control groups. Specific contrasts within groups (see Table 1) indicated that particularly among heavier drinkers (13+ drinks per week), both intervention and control groups showed significant (p < .05) decreases in weekly consumption from baseline to 3 months. However, the intervention group showed continued decreases at 6 months (42.6% decrease from baseline; ~ 8.5 drinks per week; d = 1.33), whereas control group drinking leveled off (20.8% decrease from baseline; ~4.4 drinks per week; d = 0.52). Despite significant decreases in total drinks per week in both groups by 3 months, by 6 months, the decreases in the intervention group exceeded decreases in the control group by approximately 4 drinks per week (reduction of 8.5 vs 4.4 drinks per week).
Drinking frequency and drinking quantity
Results for drinking frequency and drinking quantity are shown in Table 1. Mixed-model ANCOVA results for drinking frequency (drinking occasions per week) indicated no significant Intervention × Wave × Baseline Drinking Level interaction (F(4,172) = 1.56, p > .05), with specific contrasts indicating significant decreases by 3 months in drinking frequency among heavier drinkers (13+ drinks per week) only in the intervention group (28% decrease in drinking frequency; ~1.4 occasions per week; d = 0.76). This was compared with negligible decreases among heavy control drinkers (~7.1% decrease; 0.42 occasions per week; d = 0.19). These initial decreases remained unchanged by 6 months for both groups, leaving the intervention group with an overall decrease at 6 months of 1.4 drinking occasions per week (see Figure 2). Interestingly, decreases in drinking frequency at 3 months were also obtained among light and moderate drinkers only in the control group. The specificity of these decreases to control group drinkers has no obvious explanation, though these differences involve less than a 1 occasion per week decrease. Similar decreases were found at 6 months among both Moderate drinkers in both intervention and control groups, though again these decreases amounted to less than 1 drinking occasions per week, compared to larger decreases among heavy drinking intervention group patients (~1.4 occasions per week).
For drinking quantity (drinks per occasion), a significant Intervention × Wave × Baseline Drinking Level interaction was obtained (F(4,165) = 3.22, p < .05). In contrast to early decreases by 3 months in drinking frequency, for drinking quantity, significant decreases at 3 months were found only among heavy control group drinkers (decrease of ~28.6%; 1.16 drinks per occasion; d = 0.56). No significant differences were observed at 3 months among heavy intervention group drinkers. In contrast, by 6 months, heavy drinkers in the intervention group showed a significant decrease from baseline (net decrease of ~31.8%; 1.5 drinks per occasion; d = 0.93) as compared to control patients (net decrease by 6 months ~ 16.9%; 0.32 drinks per occasion; d = 0.32). There were no other significant differences in drinking quantity from baseline to 3- or 6-month follow-ups among either light or moderate drinkers.
Conclusion
Discussion
This article has examined the effectiveness of a newly developed brief intervention for heavy drinkers, designed for dental practice settings (Neff et al., 2013). The intervention is designed to capitalize on the teachable moment of the dental visit and possible patient concerns about oral cancer risk to promote reduction of heavy drinking. Data regarding drinking changes from baseline to both 3- and 6-month follow-up interviews from 39 intervention and 42 control patients who completed all three waves of interviews provided preliminary support for intervention effectiveness. Before reviewing study findings, we acknowledge that recruitment difficulties resulted in smaller than projected numbers of practices and patients, and that the statistical power of the study has been limited. However, even with reduced statistical power, results indicated that decreases in total drinks per week by 6 months were twice as large for heavy drinkers in intervention (an 8 drink per week decrease) versus control groups (a 4 drink per week decrease)—a 4 drink per week greater decrease among heavy-drinking intervention patients. This translates to a 6-month decrease of 42.6 percent for intervention versus 20.8 percent for control groups. Again acknowledging limited power for statistical comparisons, we note that the observed effect size (d) estimates for heavy drinking intervention patients (d = 1.33) corresponds to a large effect in Cohen’s terms (1988), while the effect size for heavy drinking control patients (d = 0.52) would be classified as a medium effect. Results for drinking frequency and drinking quantity were roughly consistent with total drinks per week in showing greater decreases among heavy drinkers from baseline to 6 months in intervention than control groups, though timing of decreases varied (as discussed below).
These results raise several issues. First, decreases in control group drinking were not anticipated, such control group reductions are common in the SBI literature, ranging from 11 percent to 46 percent (Jenkins et al., 2009) and from 10 percent to 84 percent (M = 32%; Bernstein et al., 2010). Despite decreases in control groups, studies generally conclude greater reductions in alcohol consumption in SBI than in control conditions. Thus, Kaner et al. (2009), in their Cochrane review, report a mean difference at follow-up compared to controls of −38 g per week, or approximately 4 drinks.
Several explanations have been proposed for decreases in control groups (Bernstein et al., 2010; Jenkins et al., 2009; Kaner et al., 2009). Regression to the mean could be operative, as significant decreases by 3 months in total drinks per week were specific to intervention and control group heavy drinkers (those consuming over 12 drinks per week at baseline). Assessment reactivity (Kaner et al., 2009) may also be operative, as our baseline assessment contained extensive drinking content. A third possible explanation might be response bias, as the assessment may have led respondents to tell us what we wanted to hear (i.e. that they were drinking less at 3 months). In the absence of data to validate our self-report findings, we cannot rule out this possibility.
Although regression, reactivity, and response bias may have contributed to initial decreases in both groups by 3 months, we have no way to empirically test those possibilities here. However, even if operative in our study, these factors would not account for continuing intervention group decreases among heavy drinkers beyond 3 months, while control group heavy drinker decreases leveled off. Thus, we argue that overall decreases in weekly consumption obtained here—8 drinks per week at 6 months in the intervention group, compared to 4 drinks in the control group—represent a substantial reduction in alcohol use. This difference between groups at 6 months—4 drinks—is equal to that observed by Kaner et al. (2009) for SBI studies conducted in primary care and emergency settings involving much more intensive interventions. As ours was an “effectiveness” study conducted in a real-world setting rather than an “efficacy” study, we would hope that a subsequent more highly controlled study would yield even stronger results.
Second, observed differences in changes in drinking frequency and drinking quantity merit note, as decreases in frequency appeared to take place by 3 months, followed by decreases in quantity by 6 months. We know of no mechanism, psychological or otherwise, to explain this. Speculating from a Stage of Change perspective, nothing particularly points to a change in frequency as opposed to quantity as a starting point. Intuitively, a contemplator might start by cutting back a drink per day (quantity), rather than cutting back on drinking days per week. Lacking a compelling conceptual explanation, and as our results are based on a limited number of cases, we leave this question for further investigation.
Limitations
Study limitations include the following. First, statistical power was limited by recruitment difficulties resulting in smaller than anticipated numbers of practices and patients. Specifically, given low power to detect higher order interactions, primary study hypotheses were examined by comparing baseline drinking means against means at 3 and 6 months within different intervention and control and baseline consumption level conditions. Despite power limitations, this approach indicated significant and consistent decreases from baseline only for heavier (>12 drinks per week) drinkers at 3 months for both groups and at 6 months only for the intervention group. The specificity of intervention effects suggests that the intervention may be most appropriate for heavier drinkers, as the heaviest drinkers received evidence of the highest levels of oral cancer risk as part of the intervention.
Second, our dental practice sample was limited, with only 13 out of 387 practices participating. Practice recruitment difficulties suggests that we were essentially promoting adoption of a new innovation—brief alcohol interventions—to practitioners not ready or willing to accept it. Admittedly, tobacco cessation is not common in dental practice (Cruz et al., 2005) and alcohol SBI has only recently been suggested (McRee, 2012). Promoting adoption of alcohol SBI may require more intensive efforts than mailed invitations.
Similarly, only 103 age-eligible drinkers were available for analysis out of nearly 11,000 patients initially contacted. To avoid disrupting practice routines and threatening patient privacy, patient recruitment involved invitations mailed to patients in advance of scheduled visits followed by telephone screenings for those replying. This approach likely increased selection biases and subject loss in the screening process (due to difficulties contacting patients for screening or baseline telephone interviews). Incorporation of screening into the dental visit could improve participation if that can be done with minimal staff burden.
A related study limitation was our sample composition of middle-class Caucasian females. While selection biases may account for part of this as women may be more likely to participate in cancer screening activities (cf. Davis et al., 2012), our practices reported a predominantly middle-class patient composition: 66 percent non-Hispanic White, 47 percent female, 47 percent aged 21–55 years, and 70 percent covered by private dental insurance. Thus, our sample composition may be reflective of patients served by our community dental practices, though generalizability to other types of practices and populations requires further study.
Third, we note analytic limitations. Our analyses did not support the proposed multi-level model of patient- and practitioner-level influences upon intervention effectiveness. While baseline differences existed on practice-level variables, none of these covariates were significantly related to drinking outcomes. Furthermore, controls for both patient- and practice-level covariates produced little or no change in the results. Hopefully, larger studies in the future with greater power may allow for more favorable tests of these substantive issues. Finally, 67 patients originally scheduled as intervention subjects, but who did not receive the intended intervention, were excluded from the analysis. These included cases where patients canceled their appointments, or dental staff did not receive intervention materials in time for appointments, or hygienists failed to deliver the intervention. Post hoc tests comparing these 67 patients with the rest of study patients indicated no significant differences on baseline drinking quantity, frequency, or total drinks per week, arguing against systematic bias, though loss of these patients is unfortunate.
A further limitation stemming from the reduced sample size was the inability to examine possible mediators of intervention effects—that is, our intervention approach posits that feedback regarding oral cancer risk will impact oral cancer risk perceptions, leading to decreases in drinking. Similar mechanisms posited in SBI and PNF interventions are rarely tested empirically and have inconsistent support (Carey et al., 2010). Empirical support for mediation would be especially important for our intervention given evidence limited public awareness of the role of alcohol in oral cancer (Warnakulasuriya et al., 1999) and limited perception of oral cancer risk even among heavy (14 or more drinks per week) drinkers (Hay et al., 2002). Support for our approach is found in a recent intervention (Hendershot et al., 2010) involving provision of PNF regarding alcohol use and future esophageal cancer risk. Here, the PNF intervention yielded significant reductions in drinking quantity and frequency over a 30-day period as well as producing increases in oral cancer risk perceptions, decreased positive alcohol expectancies, and increases in intentions to change drinking behaviors. Although formal mediation analyses were not conducted, their results provide some support for the mediation mechanisms posited here.
Finally, we acknowledge that heavy drinkers in our data were disproportionately male (41% male vs 12% female), χ2 (2) = 11.44, p < .01), yielding cell sizes ((heavy drinking males (9 intervention; 6 control); heavy drinking females (4 intervention; 4 control)) too small for subgroup analyses. As the literature on gender differences shows mixed results (Hettema et al., 2005; Kaner et al., 2007), such analyses could be valuable, though they were not possible here.
Acknowledging these limitations, study strengths are noted. First, a product of the study is a theory-based 3- to 5-minute hygienist-delivered intervention yielding differences in drinking at 6 months as large as observed in more intensive interventions (Kaner et al., 2009). Second, these differences were obtained in a real-world setting, rather than in a more highly controlled efficacy trial. Third, our intervention approach has targeted alcohol outcomes, though the intervention approach could readily be adapted to target both alcohol and tobacco use outcomes. Fourth, our results provide support for a future study of heavy drinkers to replicate and extend our current findings. Based upon our current results, we estimate that an adequately powered study would require between 49 and 88 patients per group to obtain power of 80 percent to detect a difference as large as 5 drinks (16.6 vs 11.4) at 6 months after adjusting for clustering effects and allowing for 20 percent attrition. Finally, the intervention study was fairly well received, with study completion rates of 79 percent for Intervention patients at 6 months showing remarkable acceptance of SBI (cf. Miller et al., 2006).
Conclusion
Despite study limitations, our results show that heavy drinking dental patients that received a brief (3–5 minute) hygienist-delivered SBI reduced their use of alcohol by as much as 8 drinks per week as compared to 4 drinks among control patients. Although replication is needed in larger samples and in a more highly controlled efficacy trial, this study is the first to demonstrate the effectiveness of a hygienist-delivered SBI for use in dental practice settings.
Footnotes
Acknowledgements
We thank Gabrielle D’Lima, Erin Waugh, Jen Dozier, Dr Tancy Vandecar Burdin and the Social Science Research Center staff for their assistance.
Declaration of conflicting interests
The content is solely the responsibility of the authors and does not necessarily represent the official views of the National Institute of Dental & Craniofacial Research or the National Institutes of Health.
Funding
The project described was supported by Award Number RC1DE020563 from the National Institute of Dental & Craniofacial Research.