



Abstract
This study evaluated the body image perception in children with type 1 diabetes in order to identify symptoms of disordered eating behaviours early. Children with type 1 diabetes and controls showed underestimation and dissatisfaction with body size. The patients, especially girls, were more accurate in their perception of body size than the control group. The study sheds light on some of the underlying factors that may contribute to the development of disordered eating behaviours in adolescence. The causes of the differences of perception of body size are discussed.
Introduction
Apart from a physical disadvantage due to the illness, children with type 1 diabetes often suffer psychological distress due to the lifestyle limitations that the illness itself entails. The commitment and the limitations necessary in the treatment of type 1 diabetes may have negative repercussions on the well-being of the patient and favour the development of psychological disturbances (Dantzer et al., 2003; Reynolds and Helgeson, 2011). There is recent evidence describing individuals with diabetes characterised by low resilience, positively associated with maladaptive coping strategies and diabetes-related distress (Yi-Frazier et al., 2013), and by high health anxiety, negatively associated with quality of life and adherence to diabetes self-care activities (Janzen Claude et al., 2014).
Some studies pointed out that the specific factors connected to the illness and its treatment (dietary restrictions, real weight variation with possible changes in the perception of body size, the notion of living in an unhealthy body and need for injections) may contribute considerably towards the development and persistence of a negative body image in individuals with type 1 diabetes (Colton et al., 1999; Shaban, 2010). A great deal of literature confirms that body image is clearly associated with psychological functioning and that negative body image can entail negative psychosocial consequences. Much empirical evidence supports the link between attitudes of body image and quality of life, self-esteem, sexual functioning and social anxiety (Cash and Fleming, 2002; Cash and Pruzinsky, 2002). Some authors argue that negative body image also has a negative effect on mood (Noles et al., 1985). Recently, the link negative body image and eating behaviour has received increasing empirical and clinical attention. Longitudinal studies on the general population have identified the influence of body dissatisfaction in the development of disordered eating behaviours (DEBs) in adolescents (Ohring et al., 2002; Wertheim et al., 2001), both at a clinical and a subclinical level (Cash and Deagle, 1997; Cattarin and Thompson, 1994), and in children (Davison et al., 2003). Body dissatisfaction predicts the onset of restricted eating (Cattarin and Thompson, 1994), binge eating (Stice et al., 1999) and purging (Stice and Shaw, 1994).
Besides, there is a certain agreement in sustaining that there is a greater incidence and persistence of DEBs in subjects with type 1 diabetes with respect to their healthy age peers (Iafusco et al., 2004), especially in female adolescents and young women (Colton et al., 2007; Peveler et al., 2005). The incidence of both full-syndrome and subthreshold eating disorders among adolescent girls and young women with type 1 diabetes is described as being twice as high as in their healthy age peers (Rodin et al., 2002). Eating disorders not otherwise specified and subthreshold eating disorders seem to be the most prevalent types of eating disorder seen in females with type 1 diabetes (Austin et al., 2011; Nash and Skinner, 2005; Nielsen, 2002). The coexistence of DEBs and diabetes leads to poor metabolic control and may increase the risk of long-term complications (Affenito et al., 1997; Nielsen, 2002; Peveler et al., 2005).
Many investigations have examined the link between type 1 diabetes and DEBs, but the factors involved in this association are still anything but clear. Different studies sustain that the greater prevalence of DEBs is due to a strong association between type 1 diabetes and some of the factors which also contribute to the incidence of DEBs in the general population (Goebel-Fabbri, 2009; Striegel-Moore and Bulik, 2007). In particular, specific aspects of dietary control (e.g. attention to diet and weight, moderation in eating, weight oscillation and adherence to a predetermined meal plan rather than eating in response to internal signals of hunger) are described as factors which could favour the development of DEBs in subjects with type 1 diabetes (Goebel-Fabbri, 2009; Larrañaga et al., 2011; Rodin and Daneman, 1992).
While the predictive power of body image dissatisfaction for DEBs has been studied in adolescents with chronic disease (Neumark-Sztainer et al., 2002) and in adolescent girls and young women with type 1 diabetes (Colton et al., 1999; Kichler et al., 2008), there is still little in the literature regarding body image in children with type 1 diabetes. The evaluation of body image in children with type 1 diabetes could increase understanding of the factors involved in adopting DEBs by this group during adolescence.
This study aims, therefore, at evaluating the self-perception of body image and the presence of emotional difficulties in children with type 1 diabetes. It is hypothesised that in light of the abovementioned factors connected to diabetes and its treatment, children with type 1 diabetes may show differences in body image and psychological distress levels when compared with healthy subjects.
Research design and methods
Participants
The study was carried out on the consecutive patients attending the G. Stoppoloni paediatric diabetology service of the Department of Pediatrics of Second University of Naples in the period from November 2011 to mid-March 2012. To be included in the study, patients had to satisfy the following criteria: aged 5–10 years, diagnosis of type 1 diabetes and absence of other illnesses. Consent was sought from the parents of a total of 152 patients. While 29 refused because the child was not disposed to do the tests or because they did not have time or because the parent did not agree with the procedure as explained by staff, 42 evaluated subjects were excluded from the sample since, following a second analysis, as they did not meet the inclusion criteria. The final sample comprised 81 children.
Control subjects were matched to the clinical group for age and gender and were recruited at an elementary school in the province of Naples. All children with known physical or psychological handicaps, referred by their teachers, were excluded. Of the 527 requests, 219 students’ parents gave consent. Reasons for refusing to take part were mainly linked to the fear and perplexity by parents regarding the possibility of their children undergoing psychological evaluation and loss of the consent form on the part of the child at the time of evaluation.
Measures
The children’s body image scale (CBIS) (Truby and Paxton, 2002) consists of seven gender-specific images for evaluating the perception and satisfaction of body size in children. The images are modifications of single photograph of a pre-adolescent boy and girl. The modifications of the body size of the figure give seven images corresponding to known body mass index (BMI) values, taken from the percentile curves of the US National Center for Health Statistics for children of 10 years of age. The figures of CBIS were rated from 1 to 7 according to increasing size and the final range of BMIs represented for boys was 14.0–14.6, 14.7–15.5, 15.6–16.5, 16.6–18.5, 18.6–24.9, 25.0–28.4 and 28.5–29.0, whereas for girls, it was 13.0–13.5, 13.6–14.9, 15.0–16.6, 16.7–17.7, 17.8–19.4, 19.5–24.6 and 24.7–28.5. For evaluation of perceived body size, children were asked which of the images was of a size most similar to themselves. A score for their perceived body size was calculated by subtracting the BMI category of the image chosen from the subject’s actual BMI category. The discrepancy between actual and perceived BMI is a measure of the subject’s accuracy in perceiving his or her own body size. Positive discrepancies (the child chooses a BMI category smaller than his or her actual category) indicate underestimation, zero is accurate perception and negative discrepancies indicate overestimation of body size. For evaluation of body size dissatisfaction, children were asked to indicate which of the images was the size they would like to be. The discrepancy between perceived and ideal BMI is a measure of the subject’s dissatisfaction with their body size. Positive discrepancies (the child chooses an ideal BMI category smaller than their perceived category) indicate that the child would like to have a smaller body size, zero indicates satisfaction with body size and negative scores indicate that the child would like to have a larger body size. CBIS has two specific characteristics which increase its validity as a measure of body image: the use of different figures representing different BMI, categorised by defined percentile bands for males and females, and the use of modified photographs to make the identification process simpler for young participants. The validation sample reports data supporting the use of the scale as a measure of body size perception and as a measure of body size dissatisfaction (Truby and Paxton, 2002). The authors suggest caution in the use of the scale as an estimate of body size in males, especially if they are younger than 8 years. Good test–retest reliability for perceived body size has been reported (Truby and Paxton, 2008).
The Draw a Person: Screening Procedure for Emotional Disturbances (DAP:SPED) (Naglieri et al., 1991) is a projective technique used as clinical screening tool for assessment of children who are thought to suffer from emotional problems. The administration of DAP:SPED requires each child to draw a man, a woman and himself or herself on three separate sheets. The evaluation system uses a multiple sign approach: each drawing is evaluated on the basis of 55 items which receive a value of 1 or 0 according to whether the item criterion is satisfied or not. The standard score (55) may be used as a cut-off to determine whether further evaluation is not indicated (scores < 55), is indicated (scores = 55–65) or is strongly indicated (scores > 65). The DAP:SPED was standardised on a sample of 2355 individuals between 6 and 17 years of age, representing the US school age population (Naglieri et al., 1991). It is a system with defensible psychometric properties both in terms of reliability and validity (Matto, 2002; Matto et al., 2005; Naglieri and Pfeiffer, 1992).
Calculation of actual BMI was made using the standard formula weight (kg)/height (m2). The measured BMI of each subject was categorised 1–7 according to the same percentile categories used for the CBIS body figures. This measure was considered as actual BMI category.
Procedure
Evaluations of children with type 1 diabetes were made individually in an anonymous form in a quiet and comfortable room made available by the service, while the patients were waiting to see the diabetologist. Demographic data and data regarding the illness and metabolic control were taken from the clinical files. The evaluations of the control group were carried out during the school day in the absence of a teacher in a room made available by the school. Four children were evaluated at a time. To avoid reciprocal influence in the replies to the test, the children were seated at a distance which did not permit consultation or copying. The DAP:SPED was administered first so as to avoid any influence from having seen the images used in the CBIS test. For the administration of the CBIS, the associated procedural problems typical of measuring self-image were taken into account (Gardner and Brown, 2010). To avoid the sequential display of the CBIS figures by increasing BMI, the seven images were presented in different randomised sequences for each subject. At the end of the test, measurements of the real height and weight of the subjects were made.
Data treatment and statistical analyses
Although the body image measures produce ordinal data, they were treated as an interval, in line with previous research using the CBIS (Truby and Paxton, 2002, 2008). The demographic homogeneity of the two groups was evaluated by χ2 test. Variables between groups were compared using t-test and factorial analysis of variance (ANOVA). Statistical significance was chosen at p ≤ 0.05. Effect sizes were calculated by means of Cohen’s d. All analyses were performed using SPSS version 21.0 for Macintosh. All studies were approved by local ethics committees and were performed according to the principles of the Helsinki Declaration II. Written informed consent was obtained from all participants.
Results
Sample characteristics
Study participants were 81 subjects (42 males and 39 females) with type 1 diabetes and 219 healthy control subjects (111 males and 109 females). The patients’ mean age was 8.11 (standard deviation (SD) = 1.55), with an average type 1 diabetes mellitus duration of 2.75 years (SD = 2.46). Their average glycosylated haemoglobin (HBA1C) level was 8.2 per cent (SD = 1.01) and the mean BMI value was 17.82 (SD = 2.53).
No statistically significant differences were found between the children with type 1 diabetes and the control group, regarding sex (χ2(1, 300) = 0.032, p = NS) and age (t(298) = −1.312, p = NS). The actual BMI of children with type 1 diabetes was significantly lower than the actual BMI in the control group (t(298) = −4.813, p < .001, d = 0.57).
Body size perception
Since the authors suggest caution in the use of the CBIS in males younger than 8 years as a measure of body size perception, an initial 2 (age) by 2 (gender) ANOVA on the actual–perceived discrepancy was conducted. This analysis did not indicate a significant effect due to age (F(1, 300) = 1.057, p = NS) or gender (F(1, 300) = 0.361, p = NS), or interaction effects (F(1, 300) = 0.359, p = NS), indicating that in our sample there were no differences between children aged ≤8 and >8 years in either males or females in CBIS.
In all, 72.8 per cent (n = 59) of children with type 1 diabetes and 78.1 per cent (n = 171) of controls chose images for perceived BMI from a lower category than their actual BMI. Analysis of means of actual and perceived BMI categories confirmed that both children with type 1 diabetes and controls underestimate their CBIS body size category. In both groups, the mean category values for perceived BMI were significantly lower than the category values of actual BMI even when the subjects were divided by gender and weight (except for the patients with the lowest BMI) (Table 1).
Means (SD) for actual BMI category and perceived BMI category for type 1 diabetes children and healthy control children and for groups divided by gender and weight.

BMI: body mass index; SD: standard deviation.
A comparison between the two groups for actual–perceived discrepancy showed that the children with type 1 diabetes underestimate their CBIS body size category less than the controls (Table 2). A 2 (gender) by 2 (disease) ANOVA conducted on the actual–perceived discrepancy confirmed the significant effect of the disease, but not of gender. An interaction effect between disease and gender emerged, indicating that the size of the discrepancy values between subjects becomes more marked in the case of girls with type 1 diabetes, who reported the lowest average actual–perceived discrepancy values of all the subgroups of children (Table 2).
Means (SD) for actual–perceived discrepancy and perceived–ideal discrepancy for type 1 diabetes children and healthy control children and for groups divided by gender and weight.

BMI: body mass index; SD: standard deviation.
In order to find differences in body size perception between children with type 1 diabetes and the control group, on the basis of the individual’s weight, a distinction was made categorising subjects for their actual BMI. Each group was divided into children with BMI greater than and lesser than the group median (patients’ 50th centile BMI = 17.5; control subjects’ 50th centile BMI = 18.9). This division was used because the sample had very few overweight or obese children. A 2 (disease) by 2 (weight) ANOVA conducted on the actual–perceived discrepancy showed, in addition to the effect of the disease, a significant effect of weight, so that children with BMI higher than the group medians tended to underestimate their body size more than children with BMI lower than the group medians categories. But no interaction effects were found (Table 2).
To investigate differences in perceived body size among children with type 1 diabetes on the basis of the duration of the illness, a distinction was made between those with a duration of illness less than 2 years and those with a duration of illness greater than 2 years. The 2-year cut-off was used because it is the end of the so-called honeymoon phase or partial remission in all patients. Comparing mean values of actual–perceived discrepancy, no significant differences were found between the two groups (t(79) = 0.690, p = NS).
To evaluate the possible influence of metabolic control on perceived body size, children with type 1 diabetes were divided into two groups on the basis of their HbA1C being higher or lower than the median value (50th centile HbA1C = 8.3%, 67 mmol/mol).
Given the significant weight effect previously determined, a 2 (metabolic control) by 2 (weight) ANOVA conducted on the actual–perceived discrepancy confirmed the main effect of weight in children with type 1 diabetes, but did not reveal any effect on metabolic control (F(1, 81) = 3.838, p = NS) or interaction effects (F(1, 81) = 0.283, p = NS).
Body size satisfaction
In the study, 51.8 per cent (n = 42) of children with type 1 diabetes and 56.1 per cent (n = 123) of controls chose ideal body size images with a BMI category lower than their perceived BMI. Analysis of means of perceived BMI and ideal categories showed that both children with type 1 diabetes and controls had a mean ideal BMI category significantly lower than their mean perceived BMI category, even when they are divided by gender and weight (except for the subjects with the lowest BMI) (Table 3).
Means (SD) for ideal BMI category and perceived BMI category for type 1 diabetes children and healthy control children and for groups divided by gender and weight.
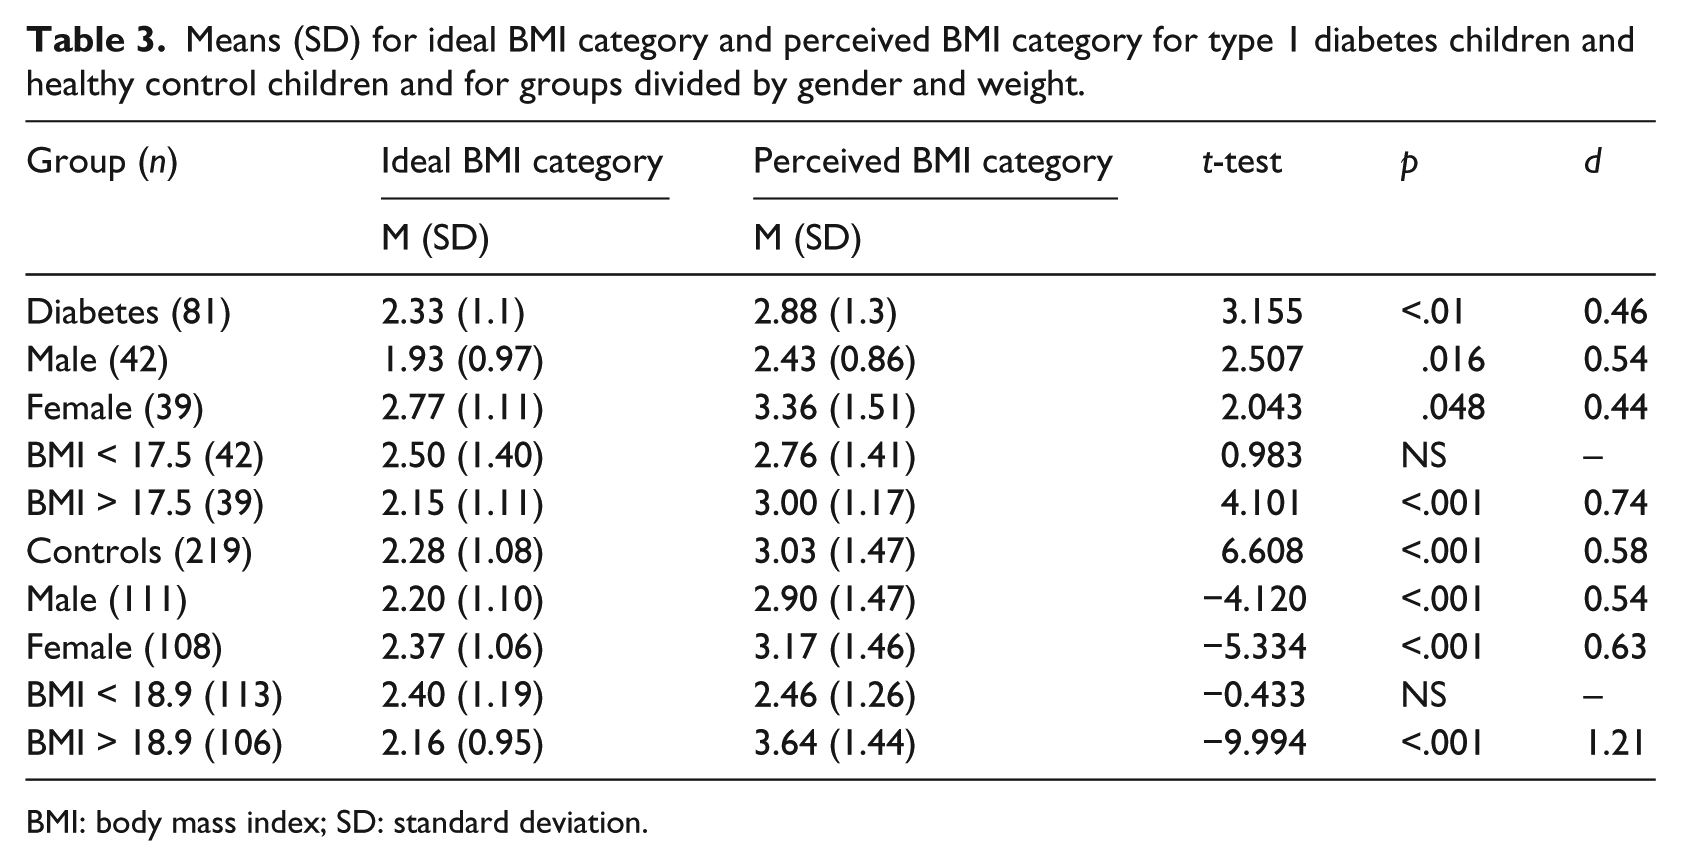
BMI: body mass index; SD: standard deviation.
However, a comparison of perceived–ideal discrepancy means showed that there were no differences in body satisfaction between children with type 1 diabetes and controls (Table 2). A 2 (gender) by 2 (disease) ANOVA conducted on the perceived–ideal discrepancy confirmed no main effect of disease and did not show significant effect of gender or interaction effects. A 2 (weight) by 2 (disease) ANOVA conducted on the perceived–ideal discrepancy indicated that there was a significant effect of weight, but again not of disease so that subjects (in both groups) with BMI higher than the group medians tended to have significantly greater discrepancy values than subjects with BMI lower than the group medians. No interaction effects were found (Table 2). Furthermore, there were no differences between the levels of dissatisfaction when comparing the children with type 1 diabetes on the basis of metabolic control (t(79) = −0.951, p = NS) or on the basis of the duration of the illness (t(79) = −0.921, p = NS).
Psychological difficulties and human figure drawings
The standardised mean values for the drawings of children with type 1 diabetes and controls are both lower than the cut-off of 55 suggested as the threshold above which emotional problems have to be considered (Naglieri et al., 1991). A comparison of means shows there are no significant differences between the two groups in the drawing scores for any of the drawing types (man: t(298) = 1.550, p = NS; woman: t(298) = 1.907, p = NS; self: t(298) = 0.699, p = NS; and total standard score: t(298) = 1.298, p = NS). In the same way, no significant differences in DAP:SPED total scores emerge from an ANOVA between children with type 1 diabetes and controls, differentiating by gender (F(1, 300) = 1.893, p = NS) or by weight (F(1, 300) = 0.796, p = NS).
Supplementary analysis
An item-by-item comparison between the drawings of the children with type 1 diabetes and the controls was made. In all three drawings, significant differences in scores between the drawings of children with type 1 diabetes and the controls were seen for three items: small figure (man: t(298) = 2.987, p = .003, d = 0.37; woman: t(298) = 4.040, p ≤ .001, d = 0.53; and self: t(298) = 2.068, p = .040, d = 0.28), talons (man: t(298) = 3.838, p ≤ .001, d = 0.45; woman: t(298) = 3.761, p ≤ .001, d = 0.44; and self: t(298) = 7.068, p ≤ .001, d = 0.8), nude figure (man t(298) = 2.328, p = .021, d = 0.26; woman: t(298) = 2.703, p = .007, d = 0.27; and self: t(298) = 2.347, p = .020, d = 0.18). In particular, it was seen that the children with type 1 diabetes drew smaller figures for height and width than the controls, and the presence of pointed fingers and the absence of clothes were both more frequent.
Discussion
On the basis of the literature available to us, this study is the first to evaluate the body image in children with type 1 diabetes mellitus. Our findings suggest that both children with type 1 diabetes and those without the illness usually underestimate their body size and are dissatisfied with themselves. For levels of underestimation and dissatisfaction, a key role appears to be played by the weight of the subject: in both groups, those with higher BMI underestimate their body size more and are more dissatisfied than those with BMI lower than the group median. The greater discrepancies in the high BMI subgroup may be considered a manifestation of the difficulty of perception of body size frequently described in overweight subjects, both adults (Duncan et al., 2011) and children (Zeller et al., 2010). The levels of dissatisfaction common to both children with type 1 diabetes and healthy subjects, especially in the overweight, are most probably expressions of the general cultural preference for slimness, typical of modern times and of the ideal image stereotypes presented by the media. This perception, already present in the pre-adolescent stage, tends to be independent of both the presence of illness and the perception of body size. In the developed world, a positive value is attributed to slimness and to being fit. Hence, being overweight is perceived negatively and provokes dissatisfaction (Derenne and Beresin, 2006; Shaban, 2010). In agreement with our data, previous studies on adolescents with type 1 diabetes described an increase in levels of body size dissatisfaction with increasing BMI, even when the levels of dissatisfaction seen in such samples were lower than the healthy controls (Ackard et al., 2008; Meltzer et al., 2001). Within a general tendency towards body size underestimation and dissatisfaction, a difference is seen when comparing subjects with type 1 diabetes and controls: children with type 1 diabetes, especially girls, have significantly lower levels of underestimation than healthy controls, showing, therefore, a more accurate evaluation of body size. Moreover, it was seen that in children with type 1 diabetes the perception of body size and satisfaction do not substantially change on the basis of duration of the illness and metabolic control evaluated by the value of HbA1C. This greater accuracy shown by children with type 1 diabetes in the task of evaluating their body size is, in our opinion, probably the product of greater attention that such children give to their own body, to its functioning and to its size (weight loss/gain) both because of direct effects of the illness on the body and because of the reactions and interest of the adults around them (parents, doctors etc.). The presence of distinct aspects in the functioning of children with type 1 diabetes is also seen in the evaluations of the drawings, which, even though they are not indicative of psychological difficulties, show consistent differences compared to the drawings of healthy controls. Although both patients and healthy children tend towards underestimation of their body size in CBIS, only the first group tends to draw human figures of limited dimensions. In agreement with similar evidence in the literature (Machover, 1949; Paine et al., 1985), it could be hypothesised that the smaller dimension of the figures drawn by children with type 1 diabetes could be indicative of anxiety and low self-esteem. In the same way, the greater presence of pointed fingers and nude figures in drawings by children with type 1 diabetes would appear to represent further elements directly connected to the condition of the illness and to specific aspects of it (like the daily use of syringes and the exposure of parts of the body, also in public, in order to administer insulin). Although these hypotheses are to be considered with caution, given the notable limitations of the analysis of drawings on the basis of single items (Flanagan and Motta, 2007), they are in line with the studies which show that drawings by children with type 1 diabetes or other chronic illnesses have the presence of distinctive aspects linked to the illnesses. The drawings of children with type 1 diabetes are described as being characterised by elements which testify differences in awareness and perception of the body when compared to controls (Eiser et al., 1984), as showing problems of adaptation and a sense of difference (Nuvoli et al., 1989) or as a sign of general emotional difficulty (Kortesluoma et al., 2008). Our data, in other words, indicating greater accuracy in body size perception and the presence of distinctive elements in human figure drawings, suggest the existence of aspects of body image which characterise children with type 1 diabetes and distinguish them from healthy children. In particular, excessive attention to body size, and therefore to weight, which in our sample seemed primarily relate to girls with type 1 diabetes, is, in fact, one of the factors believed responsible for the development of DEBs in adolescent girls and women with type 1 diabetes (Colton et al., 1999; Goebel-Fabbri, 2009). Such aspects could, in time, favour the onset of DEBs especially if they are associated with other factors described in literature as contributing to their development in adolescents with type 1 diabetes, such as depression (Olmsted et al., 2008), adolescent self-concept and impaired mother–daughter relationships (Maharaj et al., 2003) and lack of (or low) family cohesion (Neumark-Sztainer et al., 2002). Our data represent a contribution to the existing literature aimed at understanding the factors involved in the occurrence of DEBs in adolescents with type 1 diabetes. The general dissatisfaction towards one’s own body and the differences in body size perception which characterise children with type 1 diabetes shed light on the need to consider the role of body image in the occurrence of DEBs, starting from childhood. Specificity in the evaluation of body size in children with type 1 diabetes suggests a need for monitoring the characteristics of body image during the course of the development in order to increase the efficacy of early action to prevent the onset of DEBs. Using the test as routine for an initial evaluation of the self-perception of body size in children could provide an early indication of patients predisposed to DEBs in future ages and predispose a specific educational programme (Serlachius et al., 2012). All the professional figures that deal with children with diabetes are, therefore, recommended to refrain from stressing the influence of the therapy on body size, especially in patients who underestimate their CBIS body size category. On the other hand, it should be noted that having examined all subjects coming from the same region may limit the generalisability of our results. To verify the aforementioned hypotheses, it would be necessary to extend the sample and to enlarge the study to subjects from different geographical areas so as to better control the possible influence of cultural variables. Besides, longitudinal observations shall allow us to ascertain the hypothesised association between accuracy in body size perception and risk of occurrence of DEBs.
Footnotes
Acknowledgements
The authors thank the staff of the outpatients clinics at the paediatric diabetes unit G. Stoppoloni of the Second University of Naples, in particular Dr Ida Nocerino, Dr Alessia Piscopo, Dr Alessandra Cocca, Dr Lisa Caredda, Dr Stefania Picariello, Dr Emilia Frongione, Dr Serena Rollato and Dr Fortunato Cotugno; the Director and the Teachers of the school Giancarlo Siani and all the patients, parents and children who agreed to take part in the investigation.
Declaration of conflicting interests
The author(s) declared no potential conflicts of interest with respect to the research, authorship, and/or publication of this article.
Funding
The author(s) received no financial support for the research, authorship, and/or publication of this article.