




Abstract
This study examines the associations between symptoms of mental disorders and diabetes and hypertension in a nationally representative sample of South Africans. We examined unadjusted and adjusted associations of socio-demographic characteristics, alcohol use and psychological distress with diabetes and hypertension. Multivariate logistic regression revealed that hypertension is significantly associated with age, while diabetes is significantly associated with age, population group and psychological distress. The association between psychological distress and diabetes found here suggests the usefulness of additional research using more detailed measures of psychiatric disorders in local studies and reinforces clinical calls for attention to psychiatric screening in patients with diabetes.
Keywords
Introduction
Non-communicable chronic diseases (NCDs), encompassing both physical diseases and mental health, each constitute a large portion of the global burden of disease. The leading NCDs such as cardiovascular disease, cancer, chronic respiratory disease and diabetes resulted in 29 million deaths worldwide, with approximately 80 per cent of these deaths occurring in low- and middle-income countries, such as South Africa (Mayosi et al., 2009). On the other hand, mental disorders (including substance use disorders) were directly responsible for 17.3 million years lived with disability (YLDs) and 8.6 million years of life lost (YLLs) equivalent to 232,000 deaths (Whiteford et al., 2015). Mental disorders account for 17 per cent of all YLDs in middle-income countries and 9 per cent in low-income countries (Mayosi et al., 2009). However, such approximations may be underestimated due to a combination of factors including poor diagnosis of mental health disorders as well as the relationship between mental health and other NCDs.
Poor mental health and associated behavioural risk factors are known to mediate individual physical health outcomes. First, common risk factors for NCDs, such as poor diet and nutrition (Quirk et al., 2013), lack of physical activity (Callaghan, 2004) and hazardous tobacco and alcohol use (Sullivan et al., 2005), are exacerbated by poor mental health. Second, undiagnosed and untreated mental disorders among people living with a co-occurring NCD can increase the risk of sub-optimal adherence to NCD treatment and lifestyle behaviour change (DiMatteo et al., 2000), treatment failure and more rapid disease progression (Katerndahl et al., 2012; Moussavi et al., 2007). Finally, mental disorders such as depression and severe alcohol use disorders have been associated with other NCDs (Moussavi et al., 2007; Parry et al., 2011). Furthermore, many people living with a chronic NCD who may not meet diagnostic criteria for a specific mental disorder may still be experiencing a significant degree of psychological distress (Kagee, 2010).
Given these relationships, it is not surprising that previous research has revealed associations between symptoms of common mental disorders (CMDs) with other NCDs, such as hypertension and diabetes. For example, a number of studies have found an association between symptoms of CMDs, including depression, anxiety, psychological distress and hypertension (Footman et al., 2013; Kaplan and Nunes, 2003; Rutledge and Hogan, 2002; Stein et al., 2014). Although not all studies have reported this association (Rutledge and Hogan, 2002), these inconsistent findings may be due to differences in study design and sampling or how the constructs of symptoms of CMDs and hypertension were measured. Furthermore, a number of studies suggest that among both men and women of all ages from varying population groups, heavy alcohol use is strongly associated with an increase in hypertension (Briasoulis et al., 2012; Sesso et al., 2008; Taylor et al., 2009). However, the association between non-hazardous alcohol use (low to moderate alcohol use) and hypertension has resulted in mixed findings, with some evidence that women who drink at low and moderate levels have a reduced risk of hypertension (Sesso et al., 2008; Taylor et al., 2009).
The association between alcohol use and diabetes has been investigated in a number of systematic reviews (Baliunas et al., 2009; Koppes et al., 2005), with most findings suggesting a U-shaped relationship indicating a protective effect of moderate consumption on risk of diabetes, while high consumption results in an increased risk of diabetes in both genders (Ali et al., 2006; Anderson et al., 2001; Carlsson et al., 2003; Katon, 2008).
Yet most of the studies investigating the relationship between symptoms of CMDs and diabetes and hypertension have been conducted in high-income countries. It is unclear whether these findings extend to low- and middle-income countries where the prevalence of NCDs is increasing. For example, we are not aware of any studies that have investigated the relationship between symptoms of CMDs and diabetes in the South African context, and we are aware of only two studies that have investigated the association between symptoms of CMDs and hypertension. In a nationally representative study examining the relationship between mental health and the presence of hypertension in adults, results found that self-reported hypertension was associated with 12-month prevalence of anxiety disorders but not 12-month prevalence of depressive disorders (Grimsrud et al., 2009). A longitudinal study investigating the relationship between psychological distress, alcohol use and the onset of measured hypertension over a 5-year period among adult Black South Africans found that alcohol intake is associated with the onset of objectively measured hypertension, as did psychological distress independent of alcohol intake (Schutte et al., 2015).
To add to this emerging evidence on the association between symptoms of CMDs and hypertension and to initially explore the association between symptoms of CMDs and diabetes, we analysed data from a large nationally representative dataset on health and health-related behaviours that includes objective assessments of hypertension and diabetes. Given that preventing hypertension and diabetes is a major public health problem, this article aims to examine associations between both psychological distress and risky alcohol use and objective measures of diabetes and hypertension in a nationally representative sample of adults aged 15 years and older in South Africa.
Method
The first South African National Health and Nutrition Examination Survey (SANHANES-1) is a population-based household health survey established to assess the changing health needs in the country and to provide baseline data for studying trends in the health status of the nation. This baseline survey (SANHANES-1) was conducted by the Human Sciences Research Council (HSRC) and partners between April 2012 and November 2012. The rationale and survey methods have been detailed previously (Shisana et al., 2013) and are briefly summarised here. Ethical approval was provided by the research ethics committee (REC) of the HSRC (REC 6/16/11/11).
Sample selection
SANHANES-1 is a national cross-sectional population survey that applied a multi-stage disproportionate, stratified cluster sampling approach. The study sample included individuals of all ages living in South Africa in occupied households, excluding individuals staying in education institutions, old-age homes, hospitals, homeless people and uniformed-service barracks. Questionnaire-based data were obtained through interviews in combination with health measurements through clinical examination, a selection of clinical tests as well as the collection of blood samples. Based on the 2007 HSRC Master Sample, 500 enumerator areas (EAs) representative of the socio-demographic profile of South Africa were identified and a random sample of 20 valid, occupied households were selected from each EA, yielding an overall sample of 10,000 household visiting points (VPs). Of the 8166 valid VPs, the VP response rate was 77.2 per cent (6305). All household members at each VP were eligible to participate in the survey. The overall individual survey response rate was 92.6 per cent, yielding a final sample of 25,532 persons. Individuals who completed the survey questionnaire were invited to complete the physical and clinical examination. Of those who were eligible, 43.6 per cent (12,025 participants) consented to physical examination and 29.3 per cent (8078) consented to providing a blood sample.
Measures
In addition to the participant demographic characteristics of sex, age, population group, employment, marital status and highest educational qualification attained, the measures described below were also included. The inclusion of population group in our analyses is not intended to maintain apartheid era classifications, but rather to shed light on ongoing health disparities across groups.
Kessler 10
The K10 (Kessler et al., 2002) was developed for use in epidemiological studies to screen for psychological distress in the general population. The 10-item scale asks about symptoms experienced in the previous month, with responses ranging from one (never) to five (all of the time) and the total score is a summation of the responses. Composite scores range from 10 to 50, with higher scores indicating more symptoms of current nonspecific psychological distress. Individuals scoring under 20 are likely to be well while scores of 20–24, 25–29 and over 29 are likely to indicate a mild, moderate or severe mental disorder, respectively (Kessler et al., 2002). The K10 has been validated for use in the South African context (Andersen et al., 2011). For this study, K10 scores were categorised into two groups, so that scores below 20 indicated low psychological distress and scores of 20 or more indicated some level of psychological distress.
Alcohol Use Disorders Identification Test–Consumption
This tool is a 3-item alcohol screener that can help identify persons who are hazardous drinkers or have active alcohol use disorders. Responses range from 0 to 4 and the total score is a summation of the responses. Composite scores range from 0 to 12, with a score of 5 or more indicating hazardous drinking or active alcohol use disorders (Bush et al., 1998). The Alcohol Use Disorders Identification Test–Consumption (AUDIT-C) is a modified version of the 10-question Alcohol Use Disorders Identification Test (AUDIT) instrument that focuses only on assessing level of alcohol consumption. This scale has not been validated in the South African context and in practice is often used as a pre-screener for more in-depth assessment.
The two primary outcome or dependent measures were the presence of hypertension and diabetes.
Hypertension
Hypertension (systolic blood pressure (SBP) ⩾ 140, diastolic blood pressure (DBP) ⩾ 90) was treated as a binary outcome defined by 1 = the clinically detected presence of high blood pressure or hypertension defined as having SBP ⩾ 140 mmHg and DBP ⩾ 90 mmHg and 0 = no hypertension detected, that is, SBP < 140 mmHg or DBP < 90 mmHg (US Department of Health and Human Services, 2004).
Diabetes
The clinically detected presence of diabetes was treated as a binary outcome defined by 1 = elevated blood glucose levels; HbA1c ⩾ 6.5 and 0 = HbA1c < 6.5.
Data management and analysis
Sampling weights were computed to account for unequal sampling probabilities and benchmarking to South African 2012 mid-year population estimates. Sample weights were applied at the EA and household levels and at the individual levels to adjust for non-response at the interview, physical examination and clinical examination. EA level weights accounted for the varying sizes of the EAs. As the survey was designed to be generalisable to the South African population, sampling weights were then benchmarked to the 2012 mid-year population estimates provided by Statistics South Africa for age, race group and province. Weighted data were analysed using STATA version 11 (Stata Corp., College Station, TX, USA). This article analyses a sub-sample of participants aged 15 years and older who completed the questionnaire and the clinical examination and blood testing. All analyses were conducted using the survey (svy) procedures in Stata, which account for the weights and clustering effects of the complex sample design. Univariate logistic regressions examined the association of participant demographic characteristics (sex, age, population group, employment, marital status and highest educational qualification), risky alcohol use and mental health status on each of the dependent variables: a clinical diagnosis of (1) hypertension and (2) diabetes. The independent variables found to have significant associations with each of hypertension and diabetes in the univariate models were used in multivariate logistic regression models. A statistical significance level of 0.05 was used. There was no multicollinearity between any of the independent variables used in the models, as pairwise correlations were all below 0.5. Use of logistic regression relies on the assumption that each outcome variable follows a binomial distribution, that is, each replication of the process results in one of two possible outcomes (success or failure – clinical hypertension or no hypertension, clinical diabetes or no diabetes). A further assumption of the binomial distribution is that the replications are independent, meaning here that a success in one patient does not influence the probability of success in another, which holds in this study. The binomial assumption is robust regardless of whether the sample is random.
Results
Of the 4271 participants, the average age of respondents was 39 years (95% confidence interval (95% CI) = 37.9–39.9), with the majority being single (56%), of Black African race (79%), unemployed (70%) and had not completed high school (73%). Female respondents were more likely to be single (p < 0.001) and unemployed (p < 0.001) at the time of the interview. The Kessler 10 items were strongly correlated: Cronbach’s alpha = 0.98. Overall, 17.8 per cent of respondents scored above the K10 cut-off for psychological distress. There were low rates of hazardous drinking in this sample, with the average score on the AUDIT-C was 1.3 (95% CI = 1.1–1.4). Three quarters (75.8%) reported no alcohol intake in the 12 months preceding the survey. Among those who did consume alcohol in the preceding year, 25.4 per cent engaged in heavy episodic drinking (five or more (for men) and four or more (for women) drinks on one occasion) on a weekly or daily basis. Five percent of the participants scored above 7 for the AUDIT-C, indicating high quantity and frequency of alcohol consumption. Additionally, the average AUDIT-C score was significantly higher among men (2.1, 95% CI = 1.8–2.4) than women (0.6, 95% CI = 0.5–0.8) (p < 0.001) (see Table 1).
Socio-demographic, psychological and alcohol use risk characteristics of the adults aged 15 years and older by gender, SANHANES, 2012. a

CI: confidence interval.
Table presents weighted percentages and unweighted counts. Results are of the adults aged 15 years and older who had a valid measured glucose level and measured blood pressure.
Statistically significant difference between male and female proportions or means, p < 0.05.
Overall, the presence of hypertension was detected in 12.0 per cent of the participants and diabetes in 9.2 per cent of participants. Having hypertension was significantly higher among those with psychological distress (15.7%) than those without (11.5%) (p = 0.04). The prevalence of hypertension was similar for participants scoring below and above 5 on the AUDIT-C (12.1% and 12.7%, respectively) (p = 0.78). The prevalence of diabetes was significantly higher in participants with psychological distress (15.0%) than those without (8.1%) (p = 0.005). The prevalence of diabetes was similar for participants scoring below and above 5 on the AUDIT-C (9.3% and 6.2%, respectively) (p = 0.20) (see Table 2).
Socio-demographic, psychological and alcohol use risk characteristics of the adults aged 15 years and older by hypertension and diabetes a .
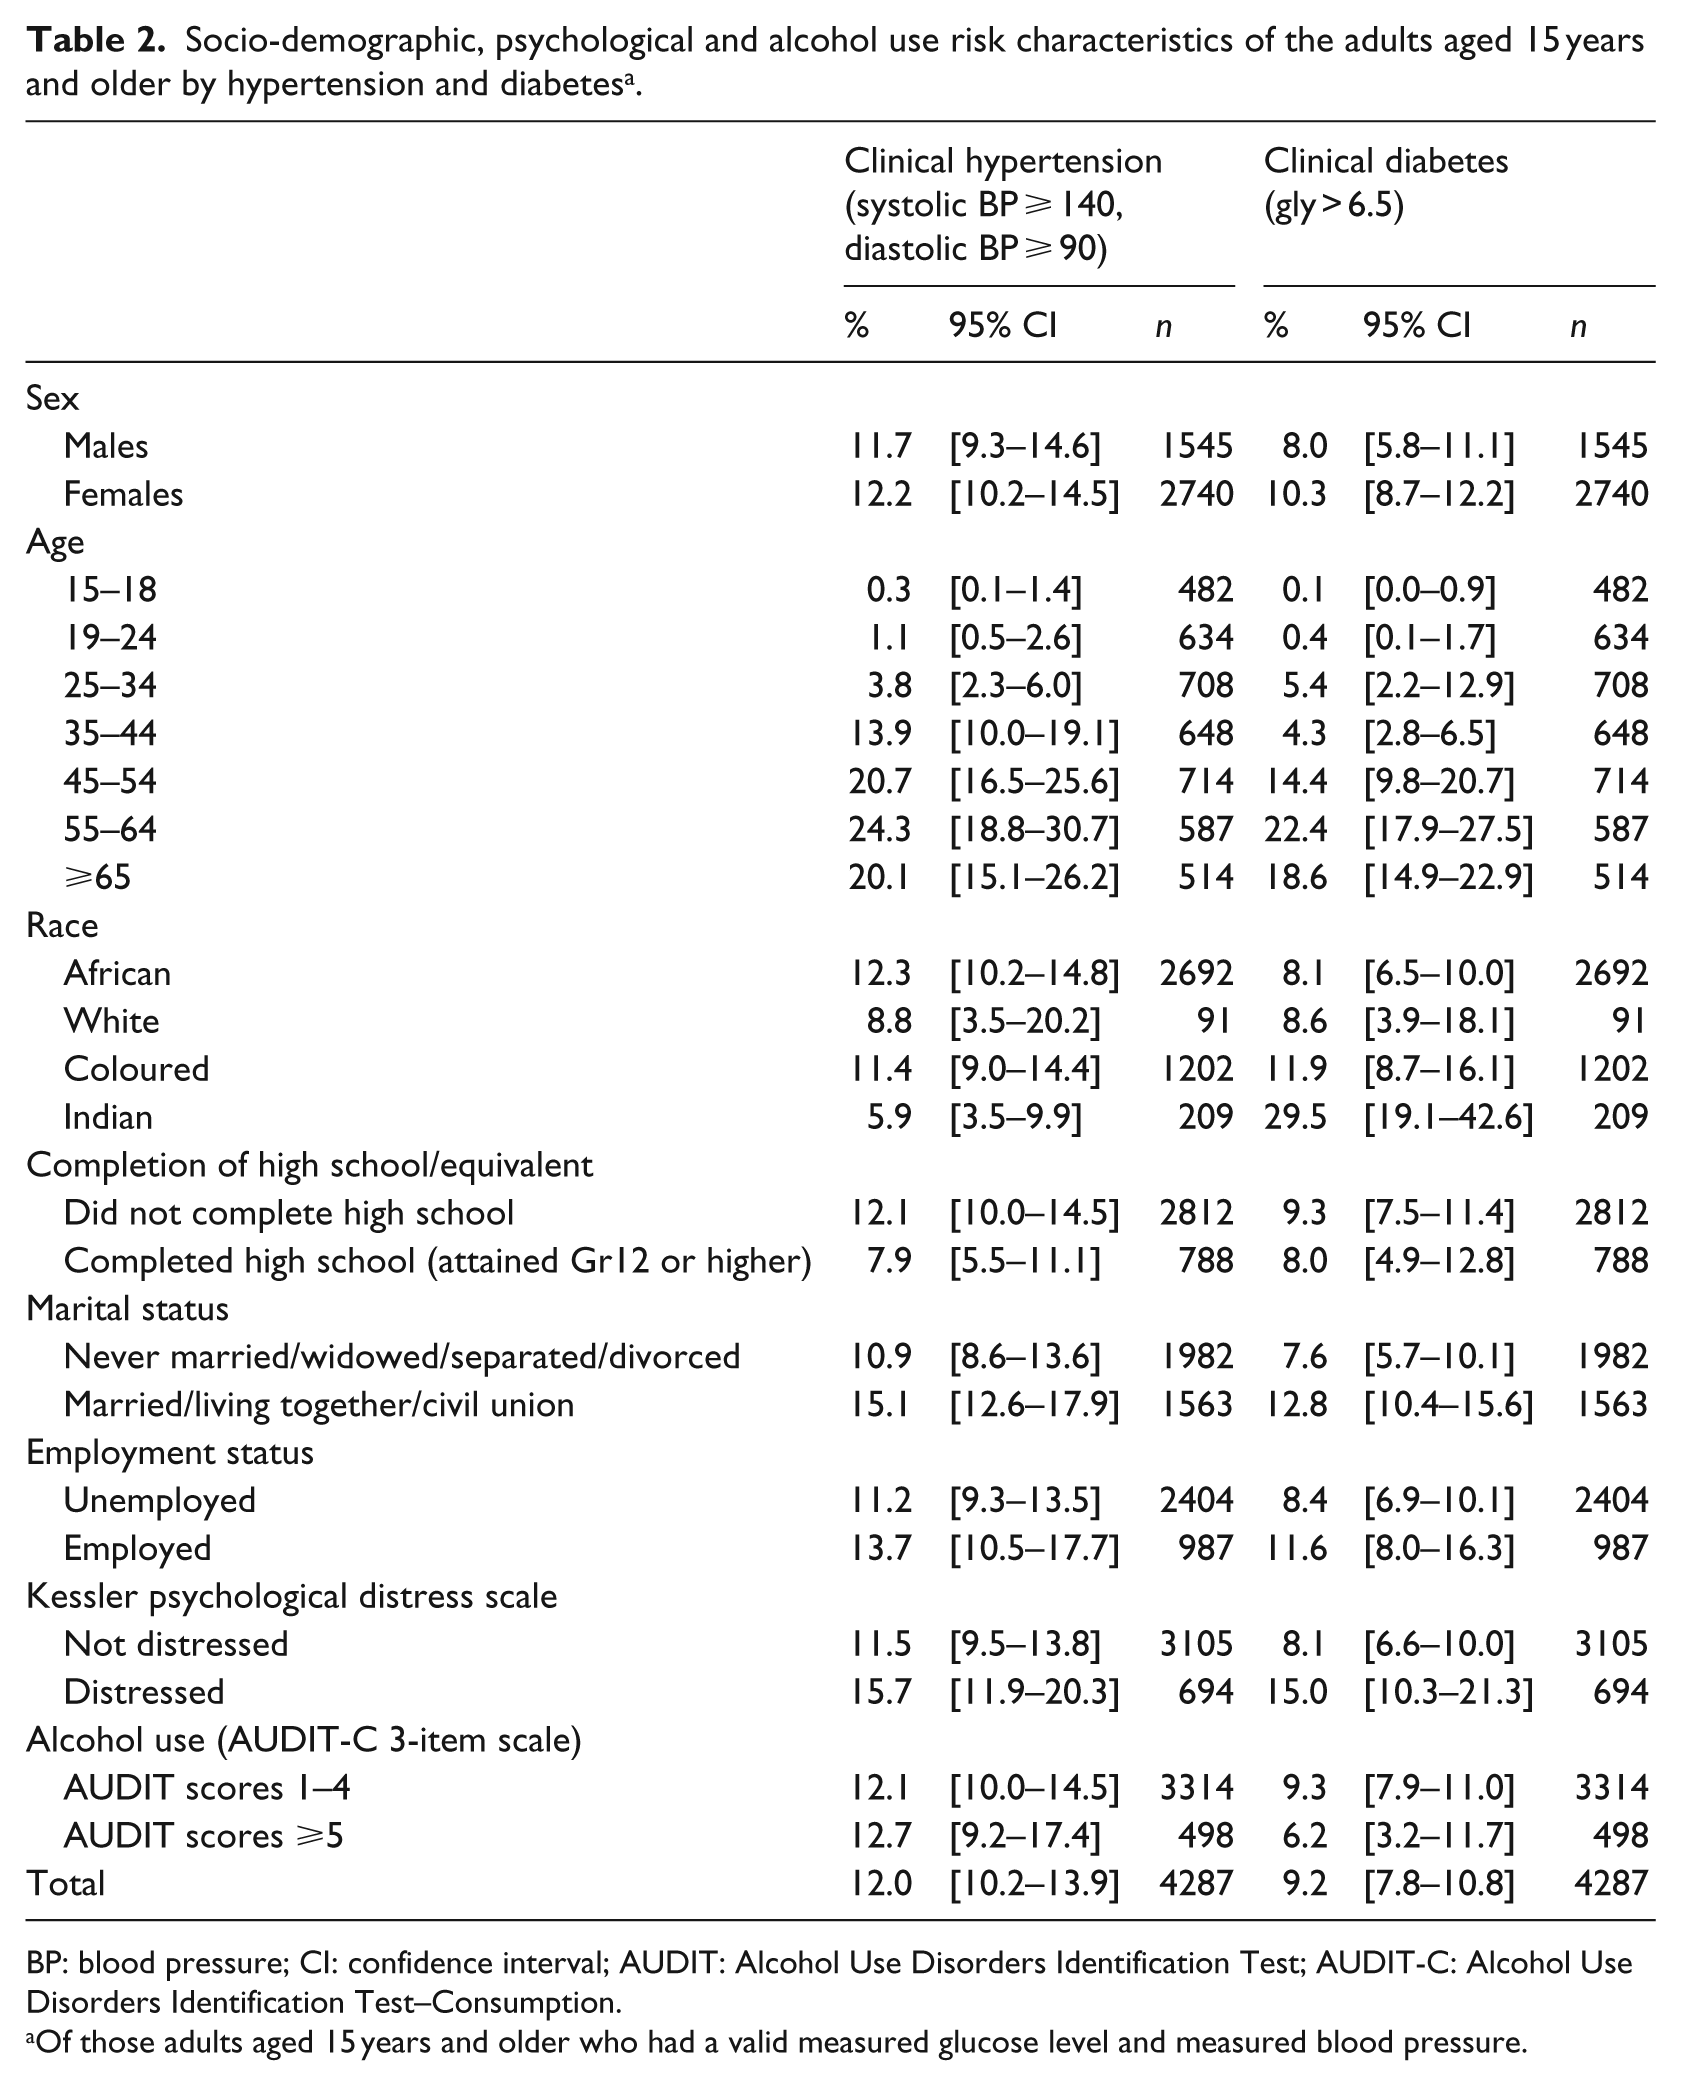
BP: blood pressure; CI: confidence interval; AUDIT: Alcohol Use Disorders Identification Test; AUDIT-C: Alcohol Use Disorders Identification Test–Consumption.
Of those adults aged 15 years and older who had a valid measured glucose level and measured blood pressure.
Univariate logistic regression revealed that having hypertension was significantly associated with being older (odds ratio (OR) = 1.05, 95% CI = 1.04–1.05), having psychological distress (OR = 1.43, 95% CI = 1.02–2.02) and in relationship compared to those who are single (OR = 1.45, 95% CI = 1.12–1.89). Hypertension was less likely to occur among Indian participants compared to Black African participants (OR = 0.45, 95% CI = 0.25–0.82), among those who had completed high school compared to those who had not (OR = 0.62, 95% CI = 0.40–0.97). Multivariate logistic regression revealed that clinical hypertension was significantly associated with age (OR = 1.04, 95% CI = 1.03–1.05). The overall multivariate model was statistically significant (F(4, 322) = 23.66, p < 0.001) (Table 3).
Univariate and multivariate logistic regression results of the association of socio-demographic, psychological and alcohol use risk characteristics with the presence of clinical diabetes and clinical hypertension, in adults 15 years and older, SANHANES, 2012.

BP: blood pressure; CI: confidence interval; OR: odds ratio; AOR: adjusted odds ratio; AUDIT-C: Alcohol Use Disorders Identification Test–Consumption.
p < 0.05; **p < 0.01; ***p < 0.001.
Univariate logistic regression revealed that having diabetes was significantly and positively associated with being older (OR = 1.05, 95% CI = 1.04–1.06), in a relationship (OR = 1.79, 95% CI = 1.24–2.57), coloured (OR = 1.53, 95% CI = 1.01–2.33) or Indian (OR = 4.76, 95% CI = 2.56–8.85) compared to Black African descent and having psychological distress (OR = 1.99, 95% CI = 1.23–3.24). The overall multivariate logistic regression model, which was statistically significant (F(6, 323) = 17.52, p < 0.001), revealed that having clinical diabetes is significantly and positively associated with age (OR = 1.04, 95% CI = 1.03–1.05), being coloured (OR = 1.71, 95% CI = 1.03–2.82) or Indian (OR = 4.61, 95% CI = 2.01–10.58) compared to Black African and being psychologically distressed (OR = 1.84, 95% CI = 1.003–3.39).
Discussion
This study resulted in a number of important findings. First, the prevalence of hypertension and diabetes is relatively high among people with psychological distress. Second, clinical hypertension was significantly associated with a number of variables in the unadjusted model including psychological distress, yet the only significant finding after adjustment was age. Third, clinical diabetes was significantly associated with age, being coloured or Indian compared to Black African and being psychologically distressed. Finally, hazardous alcohol use was not significantly associated with either hypertension or diabetes.
A similar prevalence of hypertension (15.7%) and diabetes (15.0%) was found among those who had psychological distress. These rates coincide with previous findings in a study conducted by Kagee (2010) who found that the psychological distress experienced by South Africans living with hypertension and diabetes were similar. These findings were much lower than those reported in the South African nationally representative sample using a clinical interview for a diagnosis of a specific mental disorder, where 24.0 per cent of those individuals living with hypertension were found to have a mental disorder (Grimsrud et al., 2009) and in the study conducted with Black Africans where 23 per cent of respondents who developed hypertension reported psychological distress (Schutte et al., 2015). The prevalence of hypertension was similar among those who scored five or above on the AUDIT-C (indicating high risk alcohol use) and those who scored below five (low risk use).
Although hypertension was significantly associated with a number of variables in the unadjusted model, including age, population group, education, marital status and psychological distress, the only significant finding after adjustment was age. This study did not find a significant association between psychological distress and hypertension. Indeed, research on the relationship between depression, anxiety and hypertension has resulted in mixed findings. While some studies have found a positive association between hypertension and anxiety, depression or psychological distress in both crude and multivariate analyses, other studies found that these associations did not persist after adjustments were made (Footman et al., 2013; Kaplan and Nunes, 2003; Rutledge and Hogan, 2002; Stein et al., 2014). The nationally representative study from South Africa revealed that having hypertension was significantly associated with 12-month anxiety disorders, but not 12-month depressive disorders after multivariate adjustment (Grimsrud et al., 2009). Although a detailed examination of anxiety disorders is not possible in a health and nutrition survey, consideration should perhaps be given to additional psychological measures in such studies.
Diabetes was significantly associated with age, being coloured or Indian compared to Black African and being psychologically distressed. Although these differences in diabetes among population groups are consistent with a range of earlier literature from South Africa (Jackson, 1972), further work is needed to understand the relevant causal factors. Additionally, the results of this study provide further evidence of the association between psychological distress and diabetes in a middle-income country (Mendenhall et al., 2013). A number of reasons for this increased psychological distress have been investigated in high-income countries, including the stigma associated with living with diabetes, concerns about the day to management of the disease, struggles with the healthcare systems and uncertainty about the future (Balfe et al., 2013).
Finally, alcohol use was not found to be significantly associated with either hypertension or diabetes. This was a surprising finding given previous literature on the role of hazardous drinking on hypertension and diabetes (Briasoulis et al., 2012; Taylor et al., 2009). This could be a result of the instrument used to measure alcohol use. The AUDIT-C may not be sensitive enough to distinguish low-, moderate- and high-risk users, nor does it allow obtaining information on patterns and type of alcohol use. Furthermore, there is some evidence that particular types of alcoholic beverages (Zilkens et al., 2005) and the timing of alcohol consumption relative to meals may also play a role in the development of NCDs (Klatsky, 2004). Unfortunately, the AUDIT-C does not assess this. Future studies may benefit from using the AUDIT-10 in conjunction with a time line follow back procedure to better understand patterns, timing and types of alcohol use. This study’s findings could also be a result of the nature of the sample, as we included adolescents. Given that the legal age for drinking in South Africa is 18, underage participants may have underreported or reported less drinking, impacting on our ability to find an association between alcohol use and NCDs. Additionally, people with diabetes and hypertension are also advised to avoid alcohol, possibly resulting in further under-reporting.
Several limitations of this study must be considered when interpreting its findings. First, these data assessing psychological distress and alcohol use are based on self-report and are therefore subject to the limitations of self-report bias. Second, the cross-sectional nature of the study does not allow us to address causal relationships. Third, as mentioned previously, the instrument used to measure alcohol use (AUDIT-C) may not be capable of distinguishing low-, moderate- and high-risk users, nor does it allow obtaining information on patterns and type of alcohol use.
Yet, despite these limitations, this study provides valuable insight into the associations between mental health, specifically psychological distress and alcohol use and NCDs in a low- and middle-income setting. The association between diabetes and psychological distress is consistent with a range of literature, suggests the need for more detailed psychometric measures in future health and nutrition surveys and emphasises the need for the assessment of psychiatric disorders in clinical populations of diabetes. Further investigation into other psychiatric disorders such as depression, anxiety and substance use disorders may prove beneficial. It is particularly important to include a more detailed assessment of alcohol use in these studies to provide more accurate information on the patterns of type of alcohol use.
Footnotes
Acknowledgements
This paper is an original in-depth analysis of findings related to mental health first presented in the overall study report (Shisana et al., 2013). The authors would like to acknowledge the contributors to the study report, as well as the study participants.
Declaration of Conflicting Interests
The author(s) declared no potential conflicts of interest with respect to the research, authorship and/or publication of this article.
Funding
The author(s) disclosed receipt of the following financial support for the research, authorship, and/or publication of this article: This work was supported by The Department of Health in South Africa and DFID (Department forInternational Development, UK).