
Abstract
The Dietary Guidelines for Americans recommend a 20–35 percent daily intake of fat. Resisting the temptation to eat high-fat foods, in conjunction with stage of readiness to avoid these foods, has been shown to influence healthy behavior change. Data (N = 6516) from three randomized controlled trials were pooled to examine the relationships among direct intervention effects on temptations and stage of change for limiting high-fat foods. Findings demonstrate separate simultaneous growth processes in which baseline level of temptations, but not the rate of change in temptations, was significantly related to the change in readiness to avoid high-fat foods.
Introduction
The Dietary Guidelines for Americans (US Department of Agriculture and US Department of Health and Human Services, 2010) emphasize a diet with balanced caloric intake and physical exercise, higher intake of nutrient-dense food like fruits and vegetables, and a lower consumption of sodium, saturated fats, added sugars, cholesterol, refined grains, and trans fats. Although the Dietary Guidelines recommend a daily limit of fat intake between 20 and 35 percent for adults 19 years old and older, the mean total fat intake in the United States for both men and women falls in the higher end at an estimated daily intake of 33.2 percent (National Center for Health Statistics, 2014). High-fat food intake including saturated and trans fats has been associated with numerous prevalent health risks including diabetes, obesity, several cancers, and cardiovascular diseases (Astrup et al., 2000; Barnard et al., 2005; Beresford et al., 2006; Jones et al., 2003; Mozaffarian et al., 2006).
A rich body of research has been devoted to helping people initiate and maintain behavior changes, consisting of numerous theories of health behavior including the Health Belief Model, Social Cognitive Theory, Theory of Planned Action, and the Transtheoretical Model (TTM; Riekert et al., 2013). Many of these theories integrate the concept of self-efficacy based on the work of Bandura (1977). Self-efficacy has been found to play an important role in behavior change as it reflects individuals’ beliefs about how well they can engage in the desired behavior during a specific situation (Velicer et al., 1990). A similar, but converse, construct is situation-specific temptation, which represents how tempted a person feels toward engaging in the non-desired behavior (Prochaska and Velicer, 1997). Research supports a negative relationship between self-efficacy and temptations such that temptations tend to monotonically decrease across the five stages of change and self-efficacy tend to monotonically increase (DiClemente et al., 1991; Prochaska et al., 1991). An individual’s beliefs surrounding self-efficacy/temptations may play a direct, intermediary, or minimal role in influencing a person’s readiness to engage in behavior change or their ability to maintain a specific behavior. For example, a recent study by Mosher et al. (2013) concluded that changes in self-efficacy mediated the relationship between intervention effects on daily servings of fruits and vegetables and on percentage of kilocalories from fat in a sample of cancer survivors. Furthermore, recent studies have supported self-efficacy for resisting temptation as a predictor of weight loss (Armitage et al., 2014) and a meta-analysis suggested that self-efficacy might be a mediator between behavior change techniques implemented by dietary interventions and behavior change (Prestwich et al., 2013). Thus, it is worthwhile to examine the extent of the role self-efficacy/temptations play in the process of dietary behavior change.
In the context of eating behavior, the TTM of behavior change has operationalized Bandura’s (1977) concept of self-efficacy as less situational temptations for a high-fat diet (Rossi et al., 2001; Velicer et al., 1990). Due to this inverse relationship, a person who has more situational temptations would demonstrate less self-efficacy. Briefly, the TTM is a widely used model of planned behavior change that consists of three core constructs representing different aspects of change: stage of change (i.e. the change in motivation for specific behaviors through time; Prochaska and DiClemente, 1983), decisional balance (i.e. how an individual weighs the pros and cons of behavior change; Velicer et al., 1985), and self-efficacy, operationalized as confidence and/or conversely as temptation (Velicer et al., 1990).
The temptations scale for a high-fat diet characterizes three dimensions of an individual’s temptation to eat high-fat foods in positive social situations (PS; e.g. while eating at a restaurant with friends), negative affect situation (NA; e.g. when you feel depressed about something), and difficult situations (DS; e.g. when craving a high-fat food) and has been empirically validated in previous research (Greene et al., 2013; Rossi et al., 2001; Velicer et al., 1990). Due to its hierarchical nature, temptations can be considered a global tendency or can be broken down into the three specific subscales. Rossi et al. (2001) suggest that the global temptations measure may be useful as an intermediate outcome measure or as a general screening tool, while the subscales may provide helpful monitoring effectiveness during an intervention.
Recently, Greene et al. (2013) pooled data from three randomized controlled efficacy trials of multiple health behavior interventions to examine baseline predictors of dietary fat moderation. The study used a series of analyses, including logistic regression to evaluate relationships between baseline TTM measures of decisional balance and temptations for a high-fat diet, among other constructs, to predict reaching outcome, defined as being in the action or maintenance stage at 24 months. Greene et al. (2013) confirmed the positive effect of TTM-tailored intervention on dietary outcomes, consistent with prior primary outcome reports (Prochaska et al., 2004, 2005; Velicer et al., 2004). Small baseline differences in both intervention and control conditions between outcome groups were observed for the NA temptations subscale at the 12-month time point, and at 24-months, small differences were found in the intervention group only for NA and PS subscales.
Similarly, Yusufov et al. (2015) examined patterns of change in TTM constructs using the same pooled sample as Greene et al. (2013) to predict relapse and successful outcomes within the intervention group. Analyses utilized repeated-measures multivariate analysis of variance to assess group differences among dynatypes of behavior changers (e.g. maintainers, relapsers, and stable non-changers) using key TTM constructs, including temptations for a high-fat diet. At 12 months, relapsers and stable non-changers reported significantly higher total temptations compared to maintainers. By Month 24, relapsers reported the highest total temptations, followed by stable non-changers, indicating that individuals who relapse may particularly struggle with temptations for high-fat foods. Overall, implications from this study suggest that the cognitive and behavioral constructs integral to TTM theory may contribute differentially to intervention outcomes, although these effects were only examined for individuals in the intervention group.
Although both Greene et al. (2013) and Yusufov et al. (2015) examined longitudinal effects of TTM constructs on diet behavior outcomes, highlighting a relationship between stage of change and temptations for high-fat foods neither assessed the potential mediators nor mechanisms of change and instead focused on constructs’ prediction of 24-month study outcomes. The current study was designed to expand previous research using latent growth curve modeling (LGCM) to characterize longitudinal changes in global temptations and stage of change for dietary fat (Cheong et al., 2003; Muthén and Curran, 1997; Preacher et al., 2008). Specifically, longitudinal change in temptations for a high-fat diet with respect to longitudinal change in stage of change was explored using a parallel process growth model.
Direct and indirect effects in latent growth curve models
As part of the practice for determining an intervention’s longitudinal effect on behavior change, a mediational relationship (i.e. direct and indirect effects) can be examined for intermediate variables believed to affect the relationship between intervention condition and a specific behavior change outcome (Cheong et al., 2003). In this context, mediation is supported when the effects of an intervention induce change in the trajectory of a mediating variable, which in turn induces a change in the trajectory of the outcome. This can be modeled as a parallel growth process in which two distinctive latent growth curves are examined. In this study, the mediated effect consists of an indirect path from the intervention group to the slope factor of temptations for a high-fat diet (α) that in turn affects the slope factor of stage of change (β). If the hypothesized mediator, temptations, does not exclusively mediate the relationship, such that there is also a direct relationship between the intervention and stage, there would be greater evidence for direct prediction or partial mediation, rather than a pure mediational model. See Figure 1 for a visual depiction and refer to Cheong et al. (2003) for a description of the method for testing mediated and direct effects.
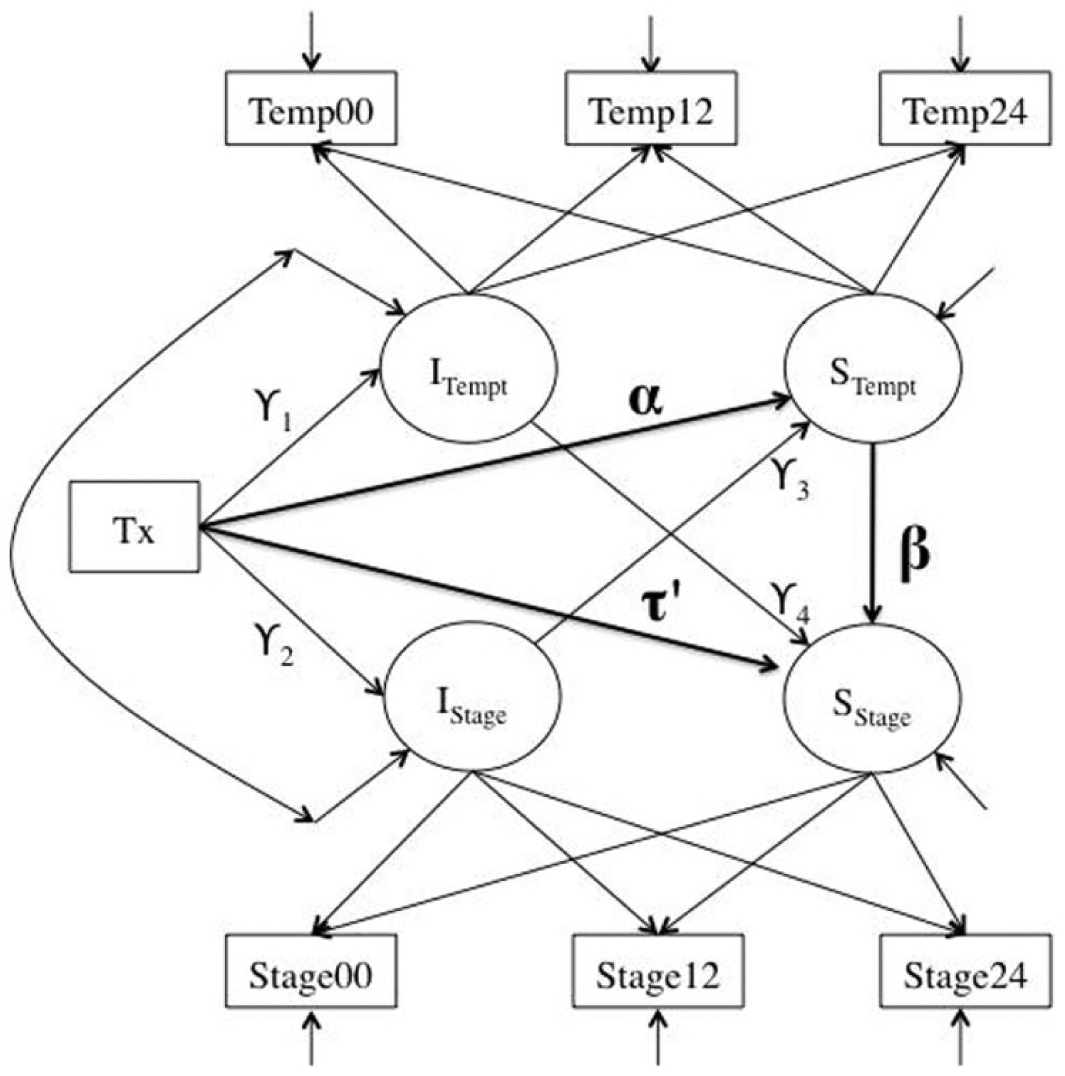
A parallel process latent growth mediation model with indirect (α, β) and direct (τ′) effects.
Thus, this study aims to assess the direct and indirect effects of temptations for dietary fat on the relationship between intervention group and stage of change. The parallel process latent growth curve framework allows us to determine how the intercepts and slopes of each process are influenced by the intervention and how the intercepts and slopes across process may covary. We hypothesize that the intervention will significantly affect the growth rate of each process and that the growth rates of temptations will be significantly related to the growth of stage.
Method
Sample
Consistent with previous literature, and to maximize power for longitudinal modeling, secondary data (N = 6620) from three multiple risk behavior trials were pooled together (Greene, et al., 2013; Yusufov et al., 2015). The pooled sample was 63 percent female, 91 percent White, 2 percent Black, 2 percent Hispanic, ranged in age from 18 to 76 (mean = 43.75, standard deviation = 1.77), and all were at risk for high-fat diet (i.e. estimated >30% fat). Within each study, participants were randomized to an intervention or assessment-only control group and a TTM-tailored expert system intervention was applied to improve diet in the intervention group. Intervention was delivered after baseline measurement and at 6 and 12 months post-baseline. Assessments were conducted at baseline, 12 months, and 24 months. Greene et al. (2013) described the pooled sample in detail.
Briefly, participants from Study 1 were ascertained via a school-based study in Rhode Island. One parent from each eligible household was assessed, with 71.5 percent of parents at risk for a high-fat diet (N = 1760). See Prochaska et al. (2004) for additional details about recruitment and study outcomes. Participants from Study 2 were ascertained through an insurance provider for primary care patients at risk for one of multiple risk behaviors (smoking, sun exposure, diet, mammography screening). One patient from each eligible household was assessed, with 65.8 percent at risk for high-fat diet (N = 3558). See Prochaska et al. (2005) for additional details about recruitment and study outcomes. Participants from Study 3 were ascertained from a large multiple risk behavior study across 22 worksites. In all, 63.8 percent of participants were at risk for high-fat diet (N = 1302). See Linnan et al. (2002) and Velicer et al. (2004) for additional details about recruitment and study outcomes. Across the three studies, 74 percent of the at-risk participants completed the 12-month assessment and 69 percent completed the 24-month assessment. Each study had slightly different 24-month attrition (27.2% in the patient-based study, 31.6% in the parent-based study, 40.7% in the worksite-based study). Despite differences in attrition between studies, Greene et al. (2013) found small demographic and behavioral effects on retention, but no stage effect on retention and no site-specific interaction with study outcome. This study comprised the combined sample of 6620 participants at baseline risk for a high-fat diet.
Dietary intervention
The TTM-based interventions targeted four dietary changes: (1) moderating intake of high-fat foods, (2) substituting lower fat foods for higher fat foods, (3) modifying cooking techniques to reduce fried foods, and (4) increasing consumption of healthful foods like fruits, vegetables, and whole grains. Participants assigned to the intervention group received TTM-tailored materials in the mail consisting of an integrated stage-matched multiple risk behavior self-help manual (at baseline only) and expert system feedback report generated by participant responses to a phone survey. Phone surveys were conducted at 6 and 12 months. Expert system progress reports generated from each phone survey consisted of individualized information on stage of change, feedback on four target dietary behaviors, pros of reducing dietary behavior, participants’ use of up to six change processes relevant to their stage of change, situation-specific temptation to eat high-fat foods, and strategies for taking small steps to progress. Participants were given normative (comparing their response to other participants in their stage) and ipsative (comparing their present response to previous responses) feedback. For more information on TTM-tailored intervention protocols, see Redding et al. (1999) and Velicer and Prochaska (1999).
Measures
Stage of change for dietary fat
Stage was determined using three steps. First, participants were asked, “Do you consistently avoid eating high-fat foods?” to determine their current behavior. Subjects who responded “No” were then assessed regarding their intention to change and assigned to one of three groups, with lower values indicating lower levels of readiness: precontemplation (PC; “No, and I do not intend to in the next 6 months”) coded as 1; contemplation (C; “No, but I intend to in the next 6 months”) coded as 2; or preparation (PR; “No, but I intend to in the next 30 days”) coded as 3. Next, participants who responded “Yes” and who met the criteria for <30 percent dietary fat based on the Dietary Behavior Questionnaire were categorized into action (A; “Yes, but for less than six months”) coded as 4 or maintenance (M; “Yes, for more than six months”) coded as 5. Finally, those who reported that they consistently avoided high-fat foods, but failed to meet the behavioral criteria (see section “Dietary Behavior Questionnaire”), were classified into PC, C, or PR depending on their intention to change specific eating habits (Greene et al., 1994, 1999, 2013).
Dietary Behavior Questionnaire
This scale consists of 22 items that assess a participant’s food consumption over the past month. The assessment used a 5-point Likert-type scale from 1 (“never”) to 5 (“almost always”). The questionnaire comprises four subscales that assess whether an individual substitutes lower fat food for higher fat foods, modifies cooking techniques to reduce fried foods, moderates fat intake by avoiding high-fat foods, and/or increases intake of whole grains, fruits, and vegetables. This scale demonstrated good internal and external validity in Greene et al. (2013). For more information, see Greene et al. (1996) and Greene et al. (2013).
Temptations for dietary fat
The temptations scale assessed a participant’s situation-specific temptation to eat high-fat foods and has been found to be reliable across studies of adults (Greene et al., 1999, 2013; Prochaska et al., 1994; Rossi et al., 1994) as well as adolescents (Rossi et al., 2001). For this study, the three subscales (i.e. negative affect, positive social, difficult situations) were combined as a global indicator of temptations and the 9-item scale had good internal consistency with coefficient alpha = 0.83 (Greene et al., 2013). Participants rated each item on a 5-point Likert-type scale ranging from 1 (“not at all tempted”) to 5 (“extremely tempted”).
Analyses
It is expected that when a behavioral intervention is effective, the growth rate of the process will be different across intervention and control conditions. Intervention effects were estimated using a structural equation modeling (SEM) framework by dummy coding the intervention group and modeling it as a time-invariant covariate. This study followed a series of steps to characterize intervention effects and to test statistical mediation and prediction. First, the trajectories of temptations (mediator process) and stage (outcome process) were modeled separately for control and intervention conditions in two-group models. This step was conducted to determine the adequacy of the model for each group in order to justify combination of groups and using intervention condition as a causal variable for growth (Cheong et al., 2003). Second, an intermediate model was tested in which the temptations and stage processes were modeled simultaneously with no relations among the growth factors. Third, a parallel process that posited relations among the intervention condition and the growth rate of temptations and stage was modeled, as outlined in Figure 1. Mediation was tested by computing the point estimate of the mediated effect (αβ), its standard error (σαβ) and determining whether the bias-corrected bootstrapped 95 percent confidence intervals (CIs) contained zero (MacKinnon et al., 2004). If the direct effect (τ′, in Figure 1) as well as the mediation effect are both significant, there is more evidence for a prediction or partial mediation process, rather than a pure mediation. That is, it may be that the intervention is related to both the mediator and the outcome demonstrating that a direct prediction effect from the intervention to stage is also needed.
All analyses were conducted in Mplus version 7 using full information maximum likelihood (FIML) estimation to account for missing data and bootstrapping for standard errors (2000 draws). Significance tests of indirect effects used bias-corrected bootstrap CIs to determine the empirical standard errors (SEs) and account for asymmetry (MacKinnon et al., 2004). Model fit was evaluated using the chi-square (χ2) statistic, comparative fit index (CFI; >0.9 indicate good fit), and root mean square error of approximation (RMSEA; <0.08 indicate good fit) (Browne and Cudeck, 1993; Kline, 2015).
Results
Analyses were restricted to a set of 6516 (Nintervention = 3164; Ncontrol = 3352) individuals who had at least one measurement on the temptations scale across the three measurement occasions (all participants had data for stage). Sample sizes varied due to missing data at each time point but were imputed during analysis using FIML. See Table 1 for a summary of temptations means and stage distributions by intervention group across time of the data.
Descriptive statistics for temptations and stage of change for dietary fat over time by group.
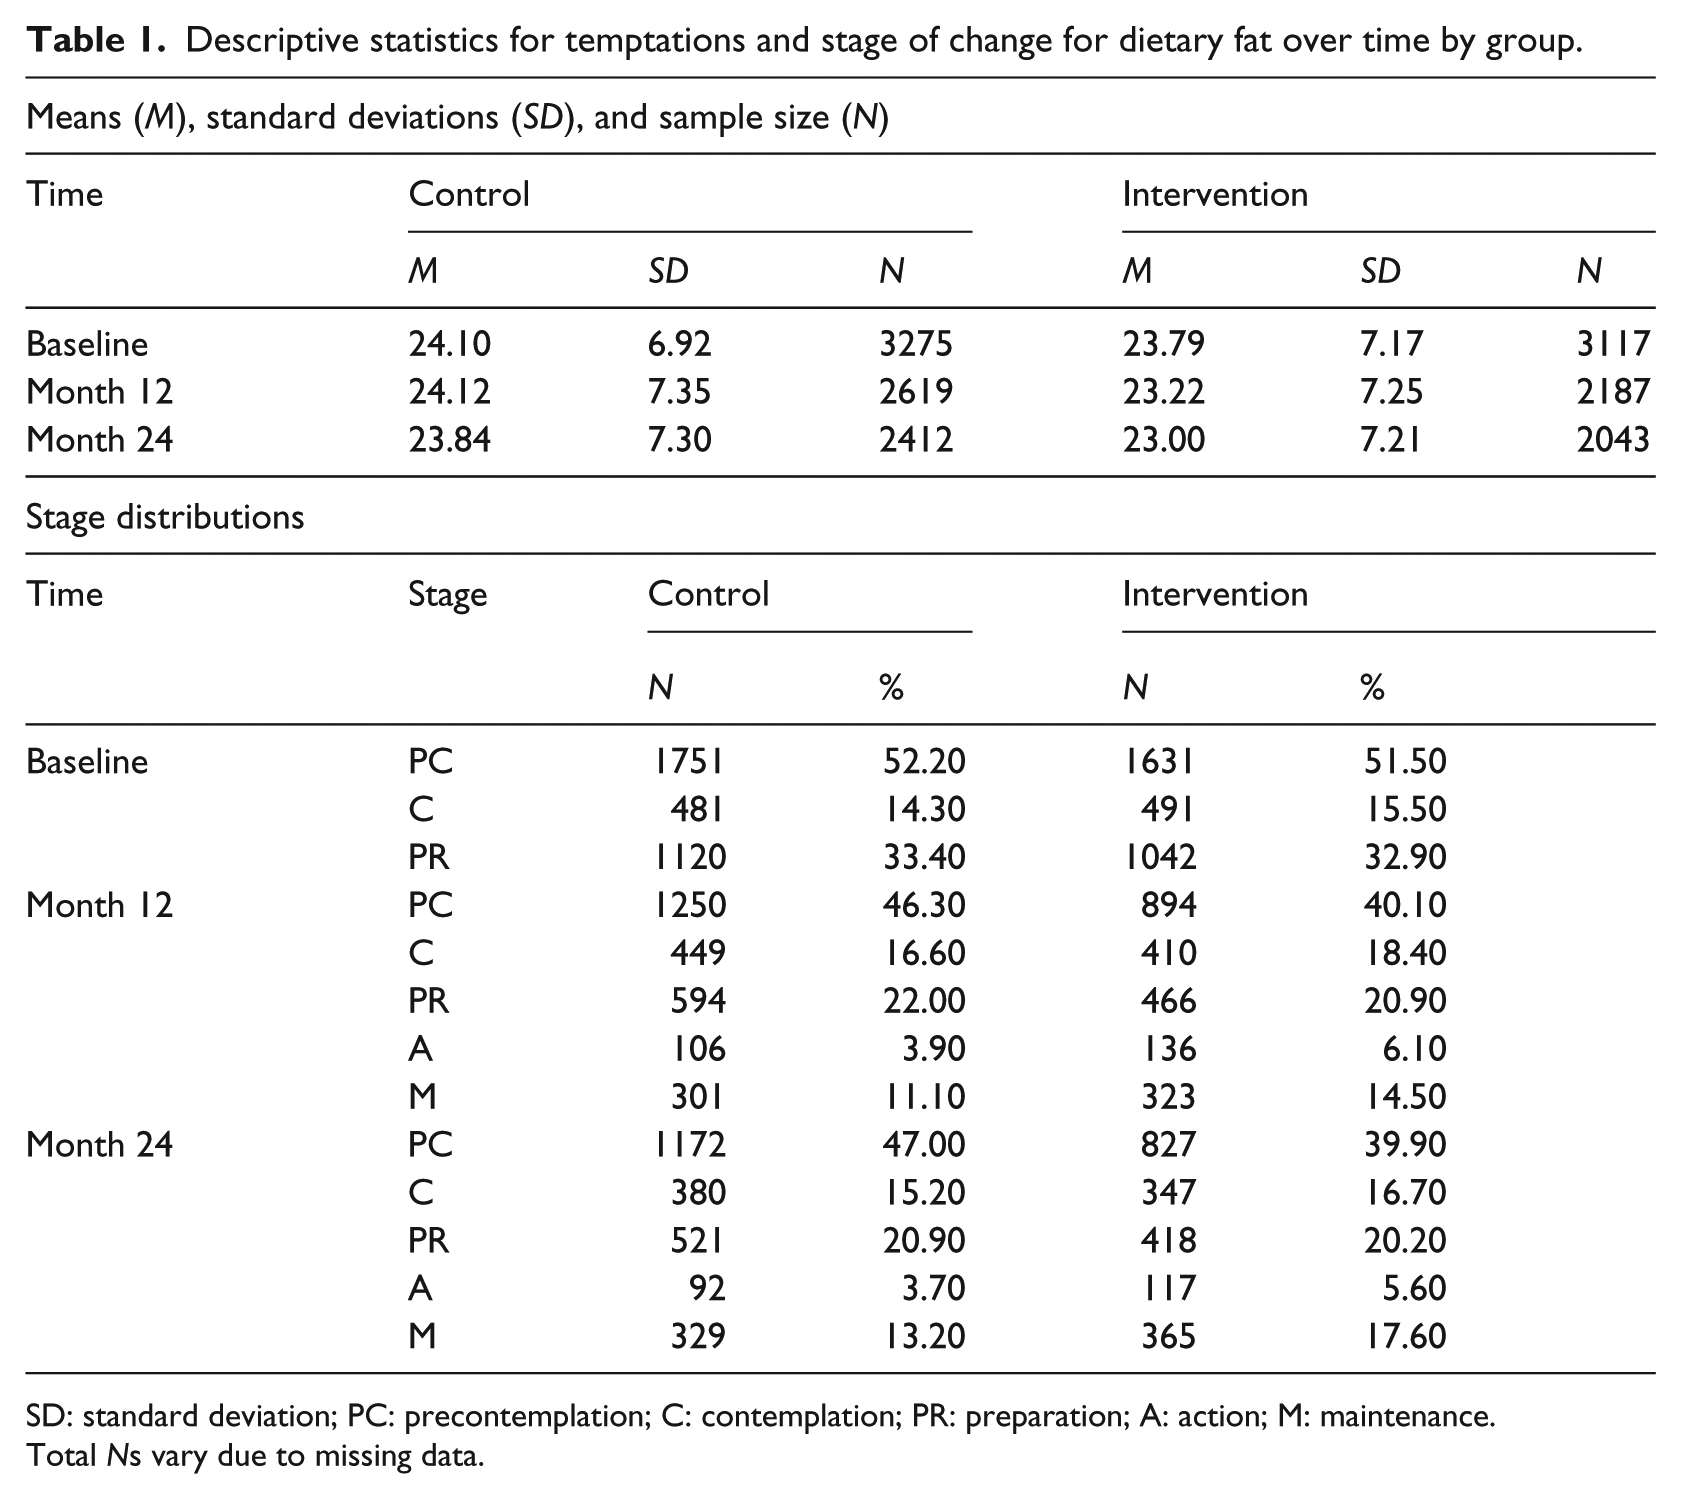
SD: standard deviation; PC: precontemplation; C: contemplation; PR: preparation; A: action; M: maintenance.
Total Ns vary due to missing data.
Trajectories of temptations and stage of change for dietary fat
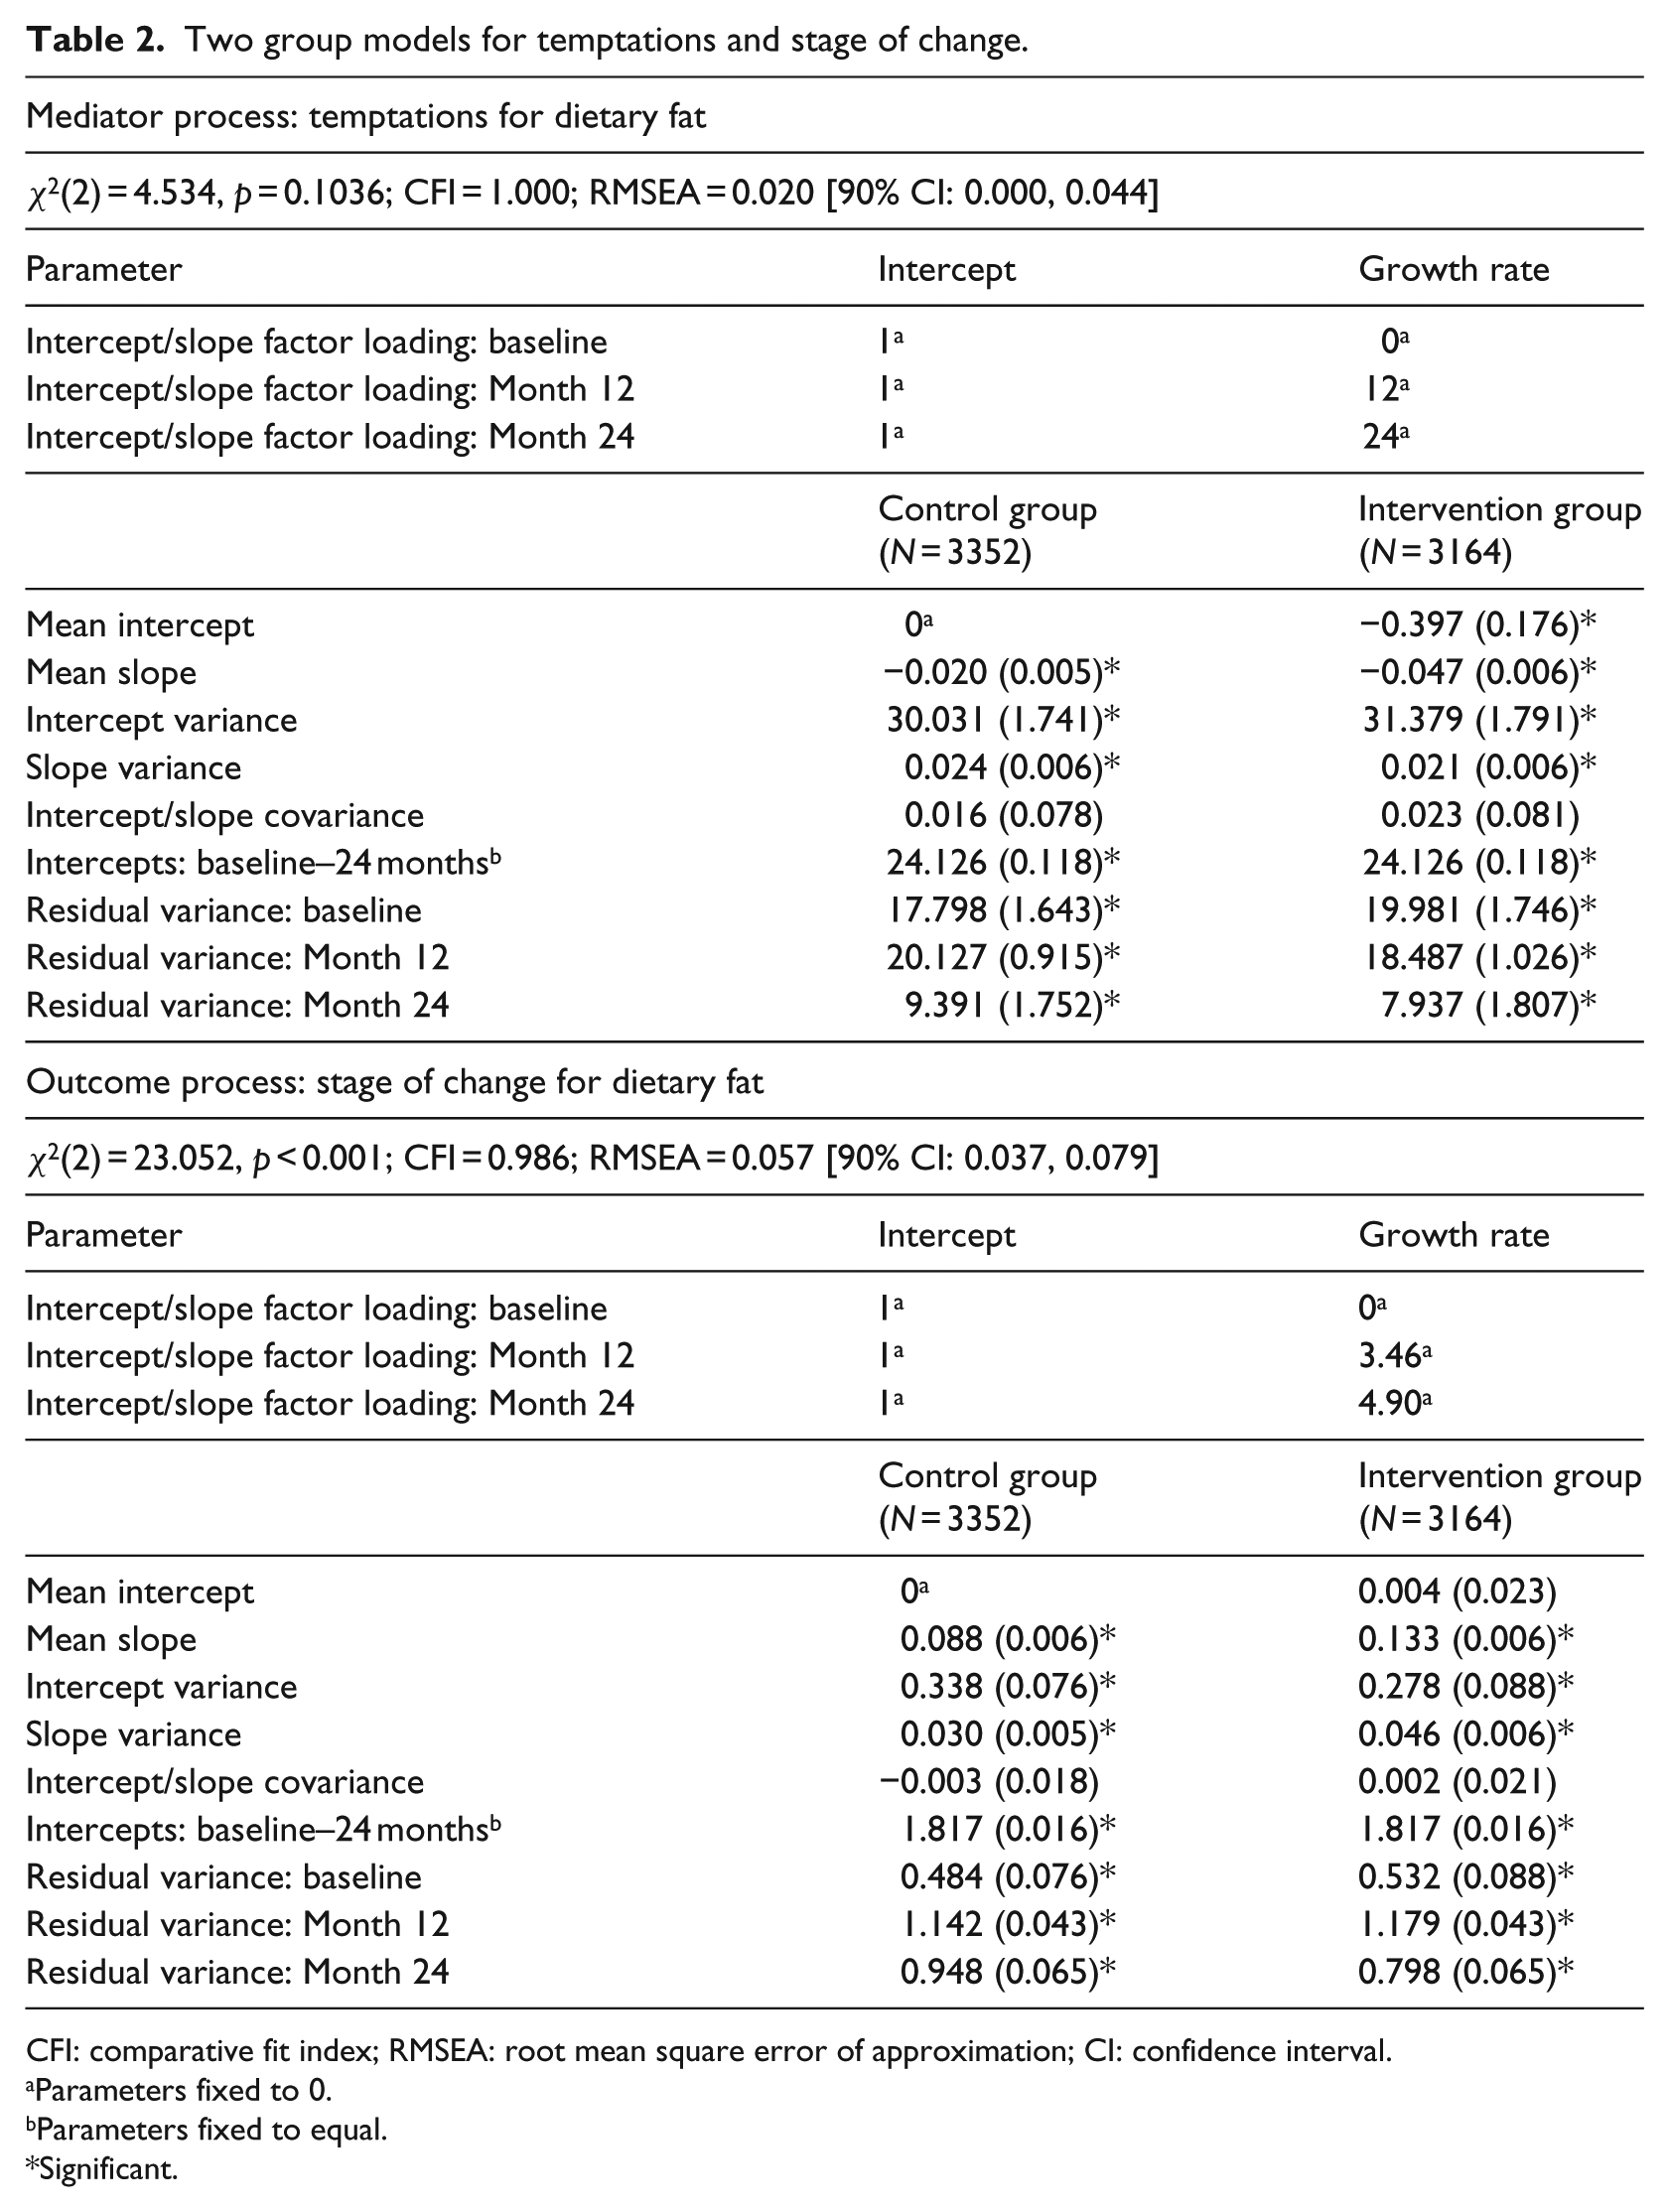
In Step 1, two separate two-group models investigated process of change for temptations and stage (see Table 2). In each model, the factor loadings and residual variances of the repeated measure were specified to be equal across groups. To capture the mean difference in the intercept between groups, the intercept factor mean of the control group was fixed to 0 (this difference value is thereby reflected in the intercept of the intervention group). To determine intervention effects on the growth process for each model, the means of the growth rates for intervention and control conditions are compared. To characterize growth differences between intervention groups, the growth rate of the control group can be fixed to 0; however, in the current model, both processes included significant slopes for the control groups. This indicates normative growth (i.e. growth not due to intervention) and thus slopes for both groups were freely estimated.
Two group models for temptations and stage of change.
CFI: comparative fit index; RMSEA: root mean square error of approximation; CI: confidence interval.
Parameters fixed to 0.
Parameters fixed to equal.
Significant.
For temptations, a linear growth model fit the data very well (χ2(2) = 4.534, p = 0.1036; CFI = 1.000; RMSEA = 0.020 (90% CI: 0.000, 0.044)) and the growth rates shown in the slopes (S) for the two groups were both negative and significant (Scontrol = −0.020, SEcontrol = 0.005, Sintervention = −0.047, SEintervention = 0.006). This finding demonstrates that both groups experienced a significant downward trend in temptations over time, with the intervention group experiencing a steeper decrease. Furthermore, groups exhibited significant variances for both the intercept and the slope, suggesting significant individual differences in where people start out in their temptations for dietary fat as well as in their rates of change. The difference in mean intercepts (I) between intervention and control groups is reflected in the parameter estimate for the intervention group (Iintervention = −0.397, SEintervention = 0.169), indicating that the intervention group had significantly lower temptations than the control group (Icontrol fixed to 0). Since the randomization procedure for each study was designed to randomize participants based on demographics and stage, but not other measures in the study, this finding is not surprising. The significant intercept for the intervention group indicates that the baseline distribution of temptations among participants was unequal across intervention conditions. However, the covariance between the intercept and growth rate of the temptations measure was not significant, demonstrating that there was no significant interaction between intervention group and initial status. If significant, an interaction between intervention and slope would result in participants at varying levels of temptations having higher or lower growth rates.
For stage of change, a square root growth model (e.g. time was scaled by taking of the square root of the corresponding number of months past baseline for each interval; Hancock and Mueller, 2006), demonstrated a good fit to the data (χ2(2) = 23.052, p < 0.001; CFI = 0.986; RMSEA = 0.057 (90% CI: 0.037, 0.079)). The growth rates for the two groups were both positive and significant (Scontrol = 0.088, SEcontrol = 0.006; Sintervention = 0.133, SEintervention = 0.006), demonstrating an increase in stage for both groups, but a steeper increase in the intervention group. The difference in mean intercepts and the covariance between the intercept and growth rate were not significant, demonstrating no evidence for a difference in initial status for stage across intervention and control groups and no evidence for an interaction between intervention group and initial status.
Parallel process model
Next, the above models were combined into a single parallel process growth model in which the change in temptations and the change in stage are modeled simultaneously. Since differences were observed in growth rates across intervention and control groups, intervention condition is included as a time-invariant covariate to account for differences in trajectories. An intermediate step examined model fit for the conditional parallel process without estimating the relations among growth factors and was used for comparison of the final model. This intermediate model showed good fit to the data, χ2(15) = 351.779, p < 0.001; CFI = 0.954; RMSEA = 0.059 (90% CI: 0.053, 0.064).
Assessment of direct and indirect effects
The final parallel process growth curve mediation model containing the relations among growth factors fit the data well, χ2(11) = 32.977, p < 0.001; CFI = 0.997; RMSEA = 0.018 (90% CI: 0.011, 0.025), and significantly better than the intermediate model, Δχ2(4) = 318.802, p < 0.001. Table 3 displays model parameters for the processes and the relations among factors. The effect of intervention group on the growth rate of temptations was significant, α = −0.027 (SEα = 0.007), indicating that the intervention significantly reduced overall temptations for a high-fat diet. However, the growth of temptations was not significantly related to the growth in stage, β = −0.037 (SEβ = 0.041) and consequently, the indirect effect was not significant, αβ = 0.001 (bias-corrected 95% CI: −0.001, 0.003). The direct effect of the intervention group on growth in stage, τ′ = 0.043 (SEτ′ = 0.008), was significant and indicated that the intervention significantly increases the rate of change in readiness to avoid a high-fat diet, suggesting a prediction rather than a mediation model worked best.
Parallel process latent growth mediation model (N = 6516).
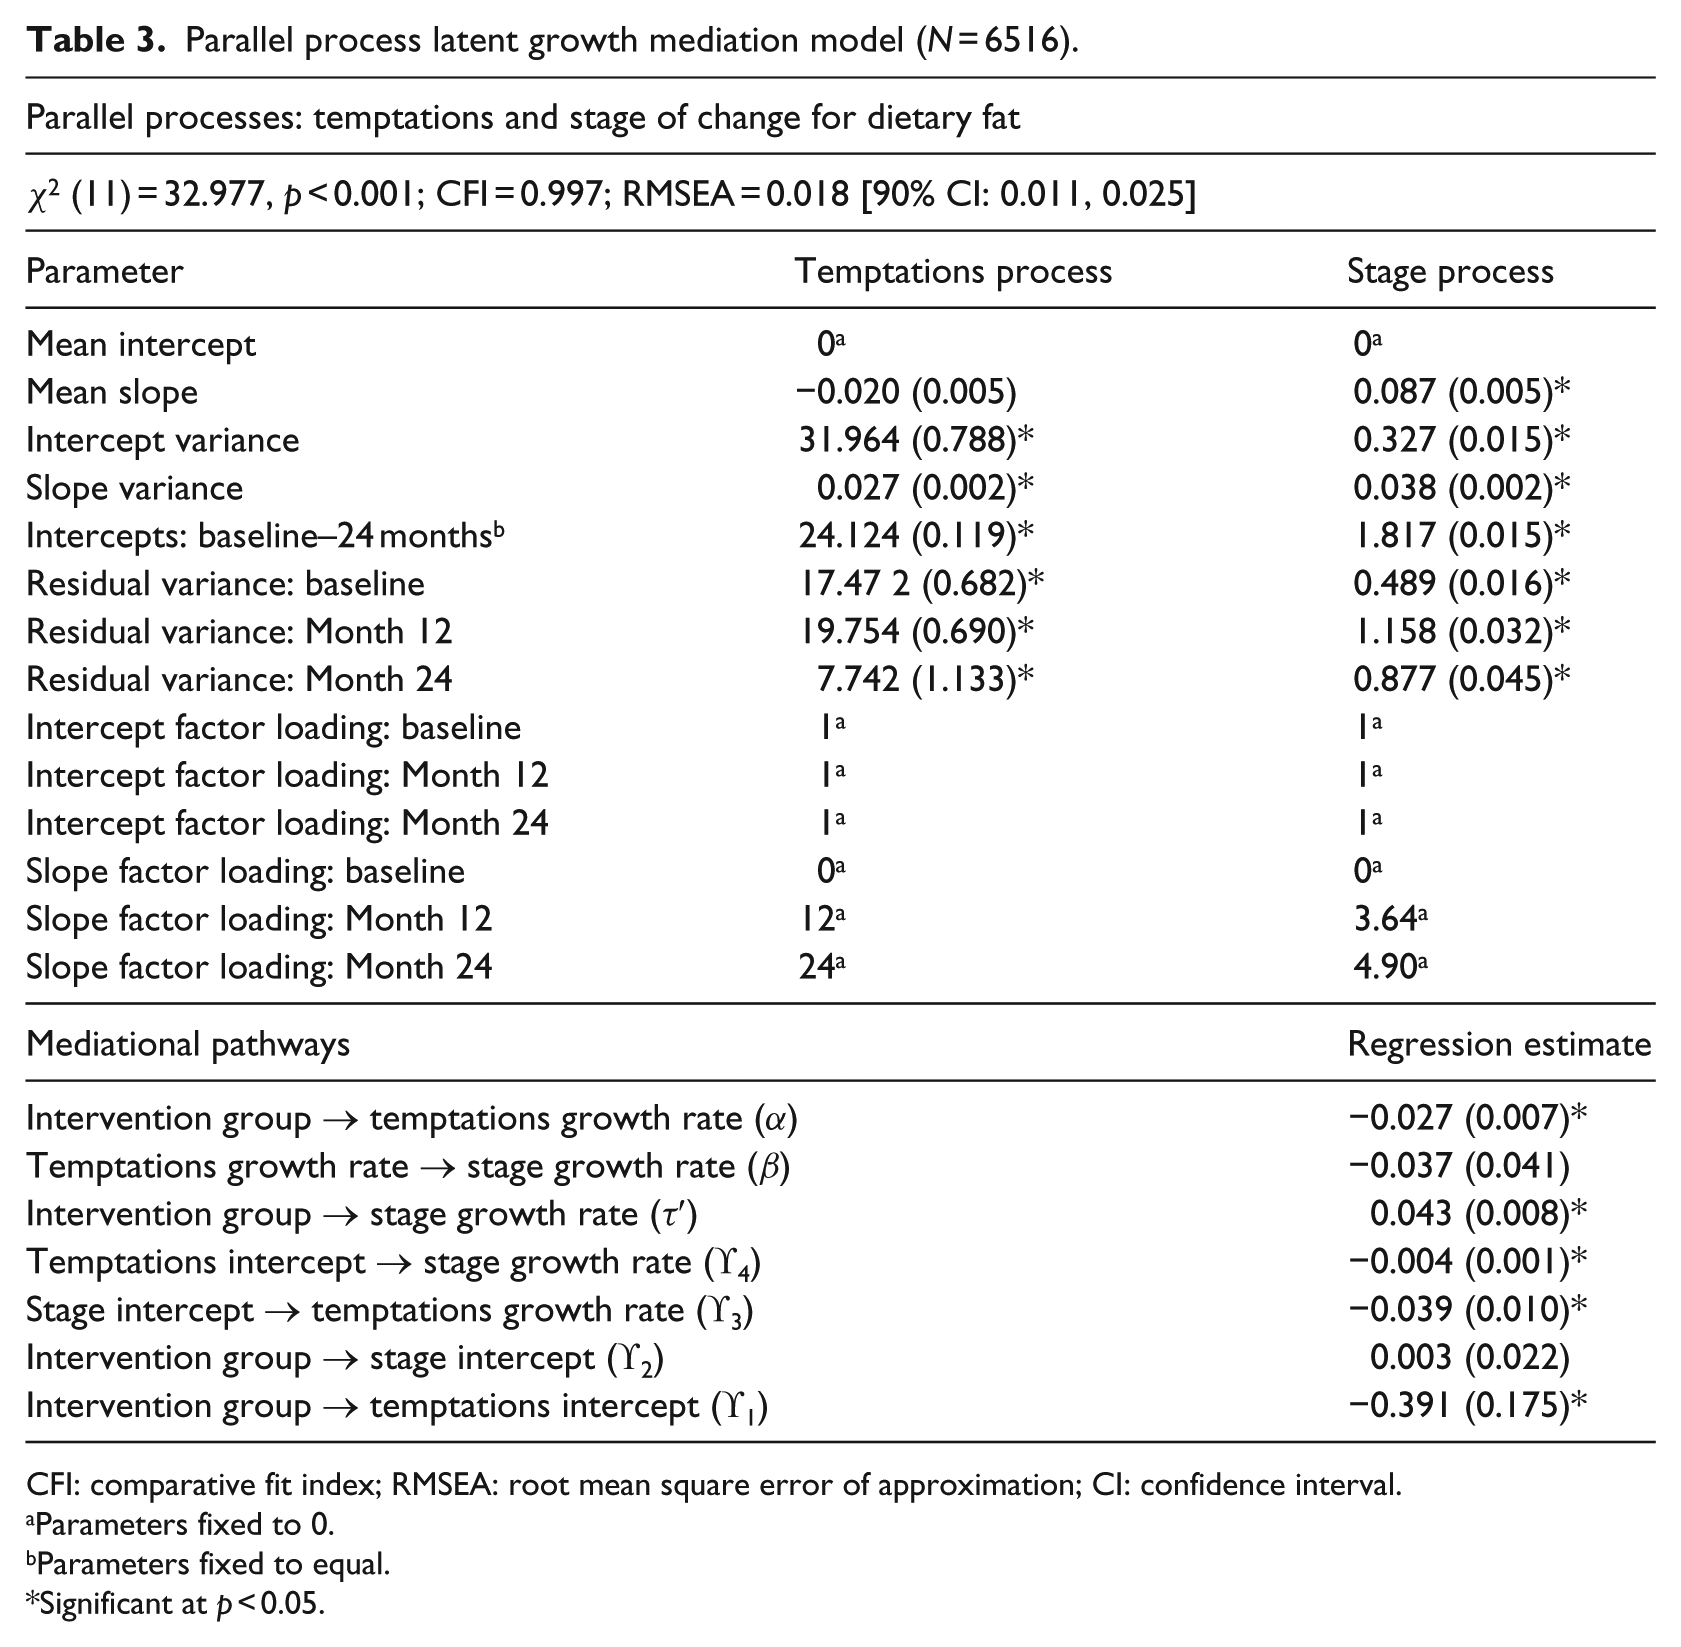
CFI: comparative fit index; RMSEA: root mean square error of approximation; CI: confidence interval.
Parameters fixed to 0.
Parameters fixed to equal.
Significant at p < 0.05.
In addition, the relationships between latent variables revealed that the initial status of stage was negatively associated with the growth rate for temptations, ϒ3 = −0.039 (SEϒ3 = 0.010), and that the initial status for temptations was negatively associated with the growth rate for stage, ϒ4 = −0.004 (SEϒ4 = 0.001).
Discussion
This study examined the mediational and predictive properties of change in temptations on the relationship between intervention condition and the change in stage for dietary fat. Measures from three time points (baseline, 12 months, and 24 months) were utilized in a latent growth curve model to characterize initial status and change over time. Separate two-group growth models for temptations and stage fit well and revealed different rates of change across intervention condition, demonstrating differential intervention effects for each measure. These models also revealed that the control group showed significant change over time, although not quite as much as that of the intervention group. The control group changes were not due to intervention effects, but instead reflected naturally occurring changes, perhaps due to a heightened awareness of one’s own health behavior stemming from involvement in the study and regular assessment of important health behavior change constructs (Greene et al., 2013).
Although the indirect, or mediational, effect of change in temptations was not statistically supported by this model, the model demonstrated two separate growth processes whose rates of change were significantly affected by the intervention condition such that the intervention successfully decreased the growth rate for temptations and increased the growth rate for stage. In addition, results demonstrate that the growth rates of each process were significantly related to initial status of the alternate process, consistent with previous findings (Greene et al., 2013). Participants who were higher in temptations at baseline demonstrated less growth in stage, perhaps in part because their struggle with avoiding high-fat foods prevented their progress toward healthy behavior change or maintenance. Consistent with this hypothesis, Yusufov et al. (2015) found that relapsers had the highest total temptations at each study time point, suggesting that this subgroup of individuals struggled with resisting temptations, which may be a leading reason for their relapse in stage of change. However, Yusufov and colleagues only looked at individuals in the intervention group. Future work should strive to identify and better understand the subgroup of individuals who struggle with temptations and consistently demonstrate difficulty in stage progression and/or relapse. Future interventions can develop and test tailored unique strategies, beyond what is offered the current intervention, to help these individuals manage their temptations and improve behavioral outcomes.
Likewise, participants who were initially higher in stage demonstrated less growth in temptations. This may be due, in part, to a ceiling effect, such that people who are already maintaining healthy behavior have less “room” to improve upon their temptations or that they already have steady skills in place such that their temptations do not change much over time. Hence, perhaps not surprisingly, this finding suggests that where people start out with respect to specific constructs significantly impacts their trajectory of change for important intervention outcomes, outlining the importance for interventions to focus on multiple aspects of behavior change and recognize that change may happen differently among different subgroups of individuals.
Overall, these findings are congruent with TTM theory. First, since the intervention itself was TTM-tailored, it was hypothesized and verified that the intervention improved an individual in the intervention group’s readiness to change (see significant link between intervention group and stage growth rate in Table 3), supporting a primary aim of the study and consistent with prior reports (Greene et al., 2013). Temptations were theorized to play a role in behavior change and therefore it was also expected that the rate of change in temptations would decrease more in the intervention condition compared to the control, which was the case here (see significant link from the intervention group to the temptations growth rate in Table 3). There were also many other key TTM variables shown to play a role in behavior change (Yusufov et al., 2015), such as decisional balance and the processes of change, which were not included here but certainly play roles in the change processes. The roles of such variables could be examined in this way in future studies.
Second, the significant negative covariance between each initial status with the slope of the alternate processes (see significant link between temptations intercept and stage growth rate as well as between stage intercept and temptations growth rate in Table 3) is consistent with the role of self-efficacy in TTM theory. For example, less tempted individuals (lower initial status on temptations) were shown to have higher rates of change (higher growth rate for stage). This replicates and extends previous work in smoking cessation that showed that temptations monotonically decreased across the five ordered stages (Prochaska et al., 1991) and that temptations predicted outcomes over time (Greene et al., 2013; Yusufov et al., 2015). As mentioned before, individuals with lower temptations to eat high-fat foods may more often or more easily change and maintain their behavior than those who enter the study with higher temptations. Future research could disentangle how intervention differentially influences the dietary behavior change of different subgroups of individuals (e.g. people who start out with high temptations and people who see no benefit in changing their behavior).
This study has some limitations. Since this study included pooled data from three TTM-tailored interventions, these results may not generalize to other intervention types. Although previous literature demonstrated no significant interaction between study location and intervention outcome across the three studies (Greene et al., 2013), combining data from different studies can lead to spurious results and these findings should be replicated in an independent sample. Another study limitation is that these data only included three yearly assessments and thus the underlying process of change may not have been optimally characterized. Specifically, this design may not have had a small enough time window to distinguish a possible indirect effect of temptations on the intervention condition and stage. Much change can happen during the course of a year, and this interval may not be adequately capturing the true relationship between timing of the change in temptations with the change in stage. If an indirect effect does indeed exist, future studies may need to incorporate smaller time intervals (i.e. 6 months) with more measured time points to determine whether a change in the temptations precedes a change in stage. On the other hand, this study also shows notable strengths, including the use of a strong theory of behavior change (TTM), a large sample of individuals at risk for high dietary fat using FIML for missing data to maximize information and generalizability of findings, as well as use of sophisticated longitudinal methodology for examining change over time.
Certainly, more longitudinal work needs to be done to characterize intervention effects and the change process among TTM constructs over time. Some research has examined the longitudinal growth in decisional balance (Kobayashi et al., 2014) and included stage as a moderator of behavior (Yin et al., 2014). Another alternative approach to determining intervention effects in LGCM was proposed by Muthén and Curran (1997). In this two-group approach, the intervention effect is examined by adding a second growth factor to characterize additional growth attributed to intervention. This approach also allows for an examination of intervention-status interactions in which an individual’s initial status (i.e. intercept factor) affects the trajectory of intervention (i.e. intervention growth factor). Thus, differential intervention effects among individuals can be directly tested. A future study might extend the two-group approach with a parallel process to better characterize the intercept–slope covariances seen in this study.
In addition, stage of change was treated as a quasi-continuous measure with a square root function of change to linearize patterns where there is early change (Hedeker and Gibbons, 1997). It may, in fact, be better represented as an ordinal variable with discontinuous change. Some studies have characterized stage using Latent Transition Analysis (Martin et al., 1996; Velicer et al., 1996). This approach identifies longitudinal change among discrete categories rather than a continuous function (as is used in LGCM) and may be a better representation of the change process.
In summary, findings demonstrate two simultaneous growth processes characterized by a reduction in rates of change for temptations and an increase in rates of stage for dietary fat. For both processes, change was observed for each intervention group but was characterized by steeper slope estimates, and therefore more improved rates of change, in the intervention condition. Covariances between initial status of one process and the growth rate of the alternate process indicate that the mean level of where participants begin the study for one process significantly influences the rate of change for the other process, suggesting that subgroups of individuals may change differently over time. This work helps to promote investigation of intervention effects on longitudinal change in temptations and how it relates to readiness to change behavior. Commitment to healthy eating is essential to the prevention of chronic diseases, like cardiovascular disease and cancer, but can be difficult for many people. A deeper understanding of how dietary temptations change over the course on an intervention can serve to inform future intervention research aimed at promoting healthy diets.
Footnotes
Declaration of Conflicting Interests
The author(s) declared no potential conflicts of interest with respect to the research, authorship, and/or publication of this article.
Funding
The author(s) disclosed receipt of the following financial support for the research, authorship, and/or publication of this article: Thanks extended to NIMH grant T32MH019927 for the first author and NIH grant G20RR030883 for the third author.