




Abstract
Comparing individuals of varying weight statuses on their identification and regulation of emotions may increase our understanding of mechanisms that drive excess weight gain and highlight more precise weight regulation targets. In Study I (N = 1333), adults with obesity had reduced self-reported attention to and repair of emotions compared to adults with overweight or normal weight. In Study II (N = 85), adults with obesity had deficits in assessor-administrated tasks of strategic emotional intelligence (i.e. understanding and using emotional information for self-management). Problems identifying and regulating emotions could impact emotion regulation processes that lead to problematic behaviors associated with eating and weight gain.
Introduction
Overweight and obesity are serious health problems affecting over two-thirds of US adults (Ogden et al., 2014). Obesity is associated with health complications like type 2 diabetes mellitus, cardiovascular disease, stroke, and cancer (Jensen et al., 2014), as well as increased risk of death (Flegal et al., 2013). Overweight and obesity are also associated with psychological problems like depression and binge eating disorder, which can lead to reduced quality of life and impairment, as well as exacerbate problematic eating behaviors that lead to excess weight gain over time (Fairburn et al., 2000; Goldbacher and Matthews, 2007; Guerdjikova et al., 2007; Tanofsky-Kraff et al., 2007; Wildes et al., 2010; Wilfley et al., 2011). Given that these psychological correlates can be driven or maintained by emotional/affective factors (Crockett et al., 2015; Gianini et al., 2013; Raman et al., 2013), gaining a better understanding of the relation between emotionality and overweight and obesity may lead to more precise targets for weight-related intervention.
Much attention has been given to understanding the relationship between emotion regulation and unhealthy eating behaviors that lead to excess weight gain (Davis, 2009; Konttinen et al., 2015; Marcus and Wildes, 2014; Shakory et al., 2015). Specifically, difficulties with emotion regulation have been associated with weight status and can lead to excess intake over time, such as through problematic coping behaviors like emotional eating (i.e. eating in response to emotions, even when not physically hungry) (Baldofski et al., 2016; French et al., 2012; Konttinen et al., 2015; Michopoulos et al., 2015; Taube-Schiff et al., 2015; Zijlstra et al., 2012). However, less is known about the relation between emotional intelligence and weight status. Whereas emotion regulation refers to the process by which individuals effectively regulate their emotions (“how”), emotional intelligence focuses on individual differences in the identification and appropriate use of emotions (“who”) (Peña-Sarrionandia et al., 2015). A meta-analysis examining the relation between emotional intelligence and emotion regulation found that individuals with high emotional intelligence regulate their emotions earlier (i.e. soon after experiencing precipitating factors that can lead to changes in emotional states) and more effectively (i.e. by using more strategies and flexibly employing strategies) than individuals with low emotional intelligence (Peña-Sarrionandia et al., 2015). The finding that higher emotional intelligence is associated with greater emotion regulation suggests that exploring the relation between emotional intelligence and weight status could be important for understanding weight gain processes.
In addition, higher emotional intelligence may be beneficial for overall health. Emotional intelligence has been positively correlated with physical, psychosomatic, and mental health (Martins et al., 2010; Zeidner et al., 2012)—which may be mediated by emotion regulation and health behaviors (Zeidner et al., 2012)—and suggests that emotional intelligence may be a possible predictor of health (Martins et al., 2010). Relevant to obesity-related diseases, a study of emotional intelligence among a sample of individuals with type 2 diabetes mellitus and who, on average, met criteria for obesity (mean body mass index (BMI) was 33.6) showed significant associations between emotional intelligence, affect intensity, and HbA1C levels, as well as between affect intensity and diabetes self-care (Coccaro et al., 2016); together, these relations have important implications for glycemic control and the regulation of diabetes. Given that obesity has been associated with poor emotion regulation and that increased weight status increases risk for serious health issues, gaining a better understanding of differences between individuals of varying weight statuses regarding their expression and regulation of emotions may help to identify subgroups at risk for emotion regulation problems, increase our understanding of mechanisms that drive excess weight gain, and in turn, highlight weight regulation targets.
Thus, the overarching aim of this article was to examine relations among weight status and emotional intelligence using measures that assess individuals’ ability to identify and appropriately regulate their emotions. Two studies were conducted to evaluate these constructs in adults with obesity, overweight, or normal weight. We evaluated individuals using weight status groups (as opposed to considering BMI as a continuous variable), given the relevance of weight status to clinical practice and to remain consistent with past use of weight status groups in research on emotion regulation. Given that many studies on emotional intelligence rely on self-report (Zeidner et al., 2012), this article includes both self-report and objective measures of emotional intelligence to strengthen study findings. We hypothesized that higher weight status would be associated with poorer identification and regulation of emotions.
Study I
Aim
The aim of Study I was to test the hypothesis that measures of emotional intelligence or emotional intensity would be altered as a function of weight status (i.e. that higher weight status would be associated with poorer emotional intelligence and higher emotional intensity).
Methods
Participants
Participants for this study included 1333 unrelated adults aged 18–55 years, comprised of 536 males and 797 females. Participants were selected randomly from the PennTwin Cohort, a population-based twin program with over 9400 individuals, including 2100 twin pairs and approximately 2900 singletons of both genders, who generally are representative of the population of Pennsylvania (Coccaro and Jacobson, 2006). Approximately 3100 individuals completed a mailed survey questionnaire containing current study measures. For the present analyses, data from only one member of any twin pair were randomly selected in instances when both members responded to the survey. Detailed analysis indicated that this subsample of individuals did not differ markedly from the general PennTwin Cohort on a variety of demographic variables (Coccaro and Jacobson, 2006). All participants completed consent-to-contact forms that were approved by an Institutional Review Board.
Procedure
A survey entitled the Behavioral Health Questionnaire was sent to all twin pairs in the PennTwin Cohort for whom zygosity had been ascertained. The survey was comprised of several personality and behavioral measures. Participants also reported demographic characteristics, height and weight (used to calculate BMI), and history of medical and psychiatric illness. The response rate to the Behavioral Health Questionnaire was 70–75 percent.
Measures
Trait Meta-Mood (TMM) emotional intelligence
The TMM Scale was used to assess emotional intelligence (Salovey et al., 1995). The TMM is a 30-item questionnaire scored on a 0–4 Likert scale (ranging from “strongly disagree” to “strongly agree”), with higher scores indicating greater emotional intelligence. The TMM conceptualizes emotional intelligence as the ability to perceive emotions, access and generate emotions so as to assist thought, understand emotions and emotional knowledge, and regulate emotions so as to promote emotional and intellectual growth (Mayer et al., 2001). The TMM yields a total score and three subscales relating to how an individual deals with his or her emotions. The “Attention to Emotions” subscale measures the degree to which a person attends to the experience of emotions (e.g. “I often think about my feelings”). The “Clarity of Emotions” subscale measures how clearly and distinctly a person feels his or her emotions are experienced (e.g. “I usually know my feelings about a matter”). The “Repair of Emotions” subscale measures a person’s effort to alter negative mood states as a means to maintain a positive outlook (e.g. “When I become upset I remind myself of all the pleasures in life”); thus, this subscale captures participants’ ability to regulate their emotions. Internal reliability ranges from α = .62 to .87 for the three factors. The TMM has been evaluated in independent samples and overall psychometrics are good (Salovey et al., 1995). In this sample, internal consistency was α = .86 for TMM total score, α = .86 for Attention to Emotions subscale, α = .85 for Clarity of Emotions subscale, and α = .77 for Repair of Emotions subscale.
Affect Intensity Measure (AIM) emotional intensity
The AIM was used to assess intensity of emotions (Larsen and Diener, 1987). The AIM is a 27-item self-report measure that assesses levels of emotional intensity that are felt in a variety of situations (e.g. “My emotions tend to be more intense than those of most people”). Responses are rated on a 1–6 scale, ranging from “never” to “almost always.” The AIM generates a total score and three subscale scores. Internal consistency is good (α = .90–.94), as is test-retest reliability at 1- to 3-month intervals (r = .80–.81) (Larsen and Diener, 1987). In this sample, internal consistency was α = .92 for AIM total score, α = .92 for Positive Intensity subscale, α = .76 for Negative Intensity subscale, and α = .73 for Negative Reactivity subscale.
Statistical analysis
Correlational analyses were conducted using Pearson’s correlation, and Table 1 presents correlations between the TMM and AIM by weight status group. Comparisons of between-group variables were performed by t-test (with correction for unequal variances where necessary), analysis of covariance (ANCOVA) or multiple analysis of covariance (MANCOVA, with age and sex as covariates), and by χ2 tests. Separate analyses were conducted with the independent variable as weight status group and the dependent variable(s) as TMM total score (analyzed using ANCOVA), TMM subscale scores (analyzed together using MANCOVA), AIM total score (analyzed using ANCOVA), and AIM subscale scores (analyzed together using MANCOVA). All analyses were conducted in SPSS 22. A two-tailed alpha value of .05 was used to denote statistical significance for all analyses.
Correlations between study measures by weight status group.

TMM: Trait Meta-Mood Scale; AIM: Affect Intensity Measure; MSCEIT: Mayer–Salovey–Caruso Emotional Intelligence Test; ALS: Affect Lability Scale; CI: cognitive intelligence.
p < .05; **p < .01; ***p < .001.
Individuals were grouped by weight status as follows: BMI from 18.50 to 24.99 was designated as normal weight; 25.00 to 29.99 was designated as overweight; and ≥30.00 was designated as obesity. Individuals with BMI less than 18.50 were excluded from the present analyses, as the small number of individuals meeting this underweight criterion precluded separate analyses.
Examination of data prior to analysis revealed that only age and sex, but not other demographic variables, were associated with TMM (e.g. age: r = −.14, p < .001; sex: Wilks λ = 0.891, F(3, 1329) = 54.05, p < .001) and AIM (e.g. age: r = −.05, p = .064; sex: Wilks λ = 0.877, F(3, 1329) = 62.25, p < .001) scores. Thus, age and sex were added to all subsequent analyses as relevant covariates.
Results
Characteristics of participants
Participants with normal weight, overweight, and obesity differed in age, sex, non-White race, and household income adjusted for size of household (Table 2). The weight status groups also differed in the proportion with a history of medical, but not psychiatric, illness.
Characteristics of Study I sample.
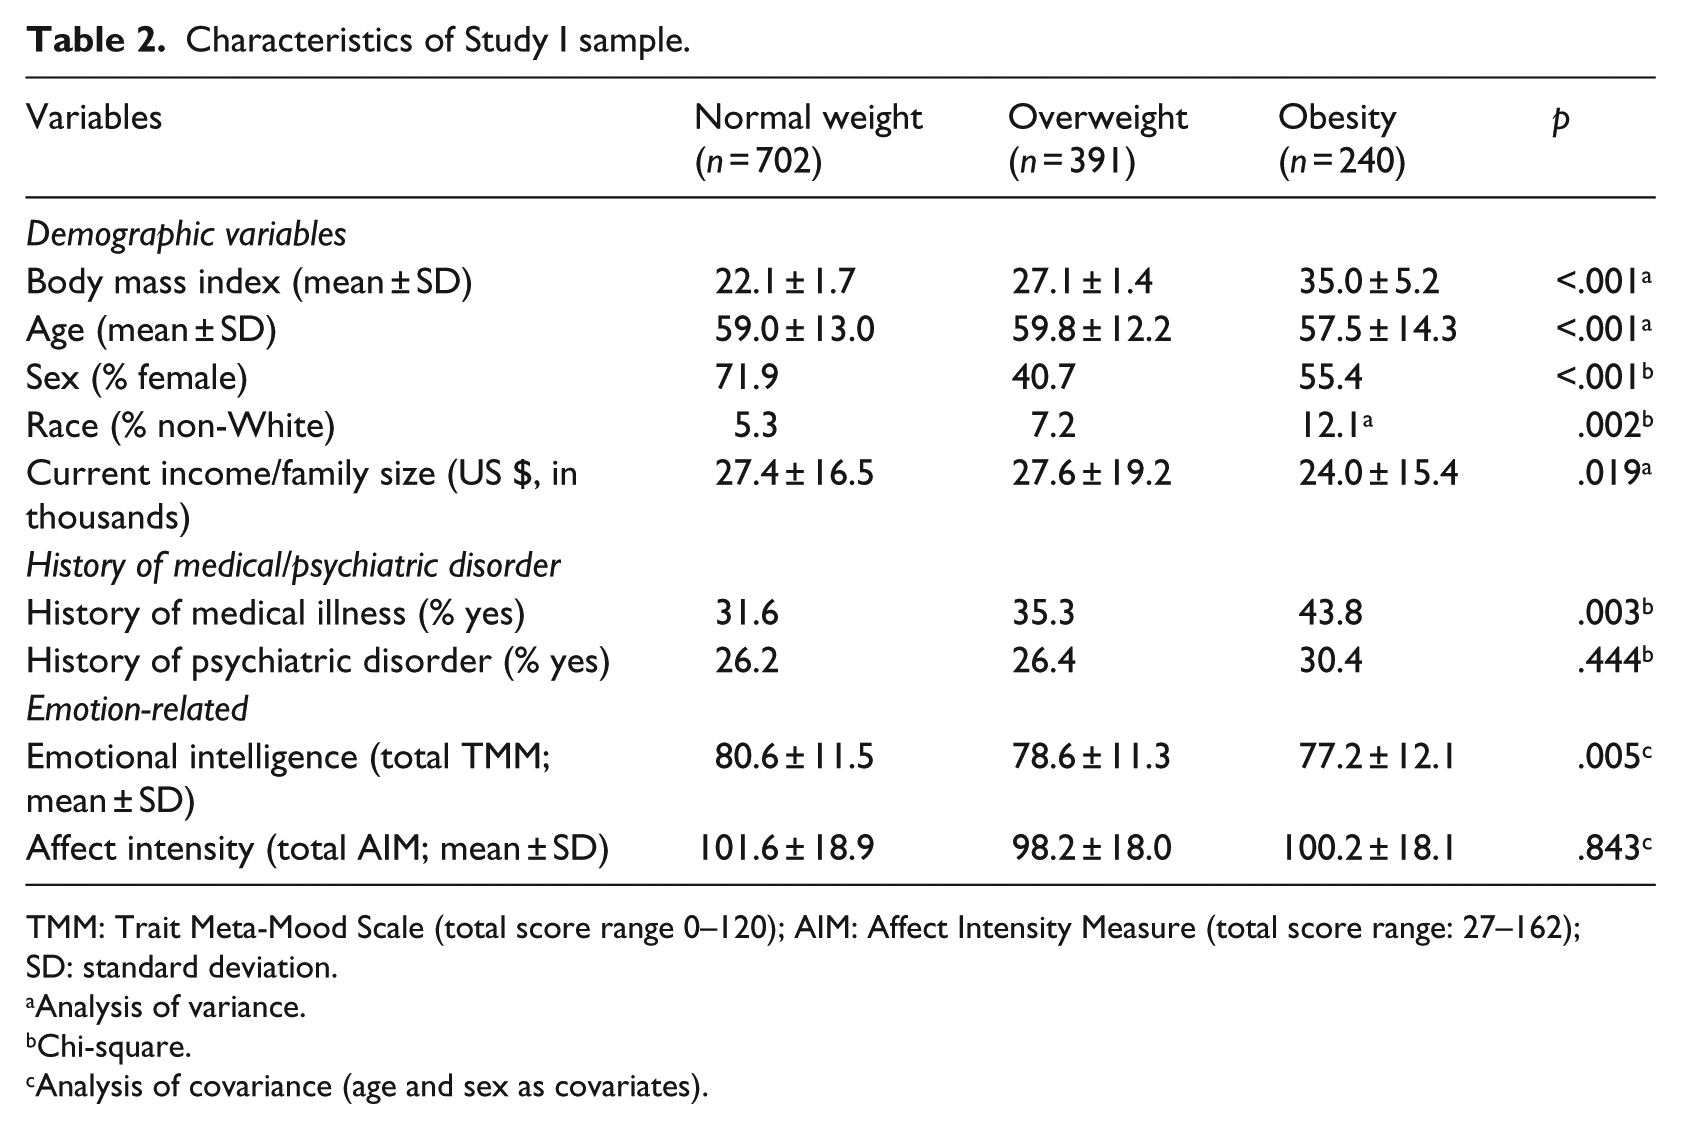
TMM: Trait Meta-Mood Scale (total score range 0–120); AIM: Affect Intensity Measure (total score range: 27–162); SD: standard deviation.
Analysis of variance.
Chi-square.
Analysis of covariance (age and sex as covariates).
TMM emotional intelligence as a function of weight status
ANCOVA revealed a significant difference by weight status in TMM total score (F(2, 1328) = 5.33, p = .005, partial η2 = 0.008, post hoc p < .05: normal weight = overweight > obesity). The difference between individuals with obesity and normal weight for the TMM total score was moderate in size (Cohen’s d = 0.30).
Follow-up MANCOVA of the three TMM subscales (i.e. Attention to Emotions, Clarity of Emotions, and Repair of Emotions) revealed a main effect of weight status (Pillai’s trace = 0.011, F(6, 2654) = 2.34, p = .029, partial η2 = 0.005) on TMM Attention to Emotions (F(2, 1328) = 3.90, p = .020, partial η2 = 0.006) and TMM Repair of Emotions (F(2, 1328) = 3.79, p = .023, partial η2 = 0.006), but not TMM Clarity of Emotions (F(2, 1328) = 1.47, p = .230, partial η2 = 0.002). Individuals with overweight and obesity had significantly lower Attention to Emotions scores compared to individuals with normal weight. In contrast, only individuals with obesity had significantly lower Repair of Emotions scores compared to individuals with overweight or normal weight. The difference between the obesity and normal weight groups for both Attention to Emotions (Cohen’s d = 0.20) and Repair of Emotions (Cohen’s d = 0.20) scores was small to moderate in size. Figure 1(a) shows marginal means plots of these results.
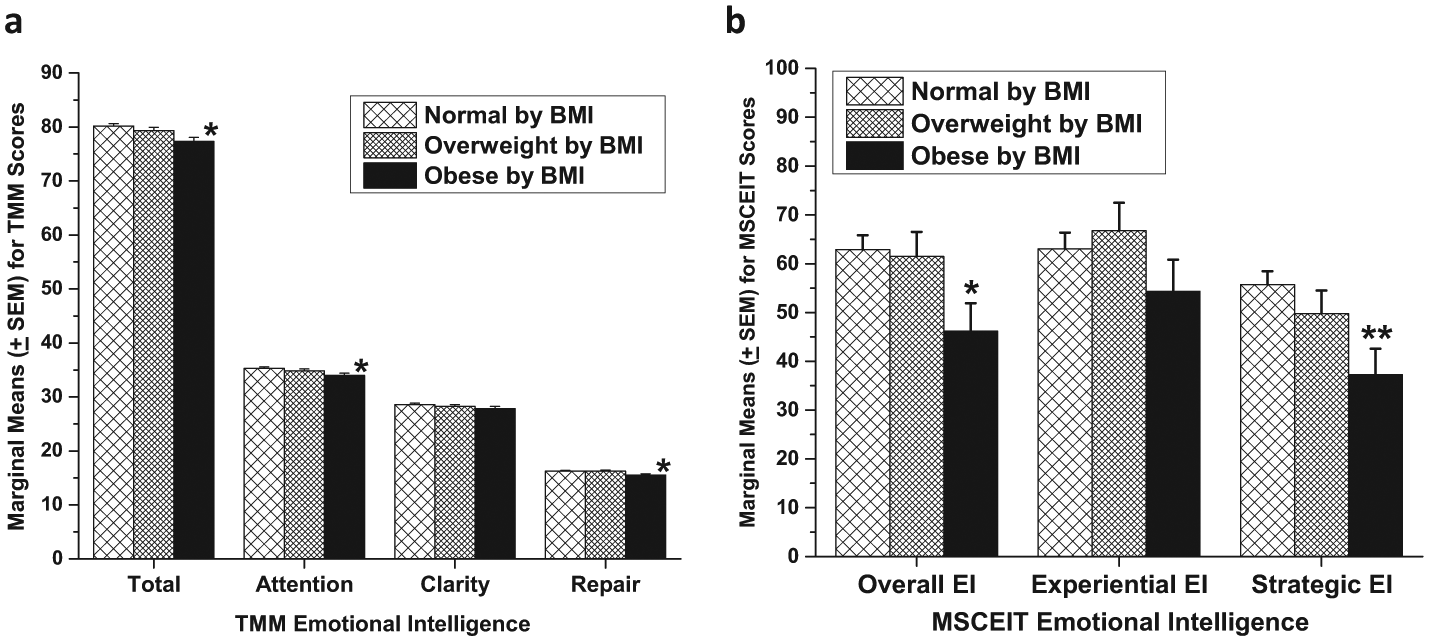
Marginal means plots of emotional intelligence by weight status group for (a) Study I and (b) Study II.
TMM emotional intelligence, weight status, and illness history
Follow-up factorial ANCOVA including weight status group, history of medical illness, and history of psychiatric illness revealed a significant effect of both weight status (F(2, 1326) = 4.80, p = .008, partial η2 = 0.007) and psychiatric illness history (F(1, 1326) = 10.88, p = .001, partial η2 = 0.008), but no effect of medical illness history (F(1, 1326) = 0.09, p = .769, partial η2 < 0.001) on TMM total scores. Including both medical and psychiatric illness history in the MANCOVA model of the three TMM subscales showed a main effect of weight status (Pillai’s trace = 0.011; F(6, 2650) = 2.37, p = .028, partial η2 = 0.005), with weight status group differences for TMM Attention to Emotions (F(2, 1326) = 4.77, p = .009, partial η2 = 0.007) and for Repair of Emotions (F(2, 1326) = 3.15, p = .043, partial η2 = 0.005).
AIM emotional intensity as a function of weight status
AIM total score did not differ as a function of weight status (total AIM: F(2, 1326) = 0.17, p = .843, partial η2 < 0.001). Follow-up MANCOVA also revealed no effect of weight status (Pillai’s trace = 0.867, F(6, 2648) = 0.418, p = .867, partial η2 = 0.001) on the three AIM subscales.
Study II
Aim
The aim of Study II was to replicate the findings of Study I using a more comprehensive, task-based assessment of emotional intelligence in an independent set of participants in whom objective measures of cognitive intelligence (IQ) and history of medical and psychiatric illness were obtained. In addition, we aimed to test the hypothesis that measures of emotional lability would be altered as a function of weight status (i.e. that higher weight status would be associated with poorer emotional intelligence and higher emotional intensity and lability).
Methods
Participants
Study II participants included 85 unrelated individuals comprised of 36 males and 49 females aged 20–53 years from the PennTwin Cohort. No Study II participant was included in Study I and, as in Study I, only one member of any twin pair, selected at random, participated in Study II.
Procedure
All Study II participants presented to the research center for assessment. Participants reported demographic characteristics, height, and weight, in addition to completing study assessments, detailed below. Participants with a current or lifetime substance use disorder or a lifetime history of bipolar disorder, schizophrenia (or other psychotic disorder), or intellectual disability were excluded from the study. Participants provided informed consent, and the study was approved by an Institutional Review Board.
Measures
Diagnostic assessment
Medical history was taken by the study team, and syndromal and personality disorder diagnoses were made according to criteria in the Diagnostic and Statistical Manual of Mental Disorders (5th ed.; DSM-5; American Psychiatric Association (APA), 2013). Diagnoses were made using information from (1) the Structured Clinical Interview for DSM Diagnoses (First et al., 1996) for syndromal disorders and the Structured Interview for the Diagnosis of DSM Personality (Pfohl et al., 1997) for personality disorders; (2) clinical interview performed by a research psychiatrist; and (3) review of other available clinical data as in previous studies from our program (Coccaro et al., 2012).
Mayer–Salovey–Caruso Emotional Intelligence Test (MSCEIT) emotional intelligence
Emotional intelligence was assessed using the task-based MSCEIT (Mayer et al., 2002). The MSCEIT yields one overall score and subscale scores for Experiential Emotional Intelligence and Strategic Emotional Intelligence. Higher scores on this measure indicate greater emotional intelligence. Experiential Emotional Intelligence provides an index of the participant’s ability to perceive emotional information, to relate it to other sensations such as color and taste, and to use it to facilitate thought and improve thinking. Strategic Emotional Intelligence provides an index of the participant’s ability to understand emotional information (i.e. the complexities of emotional meanings, transitions, and situations) and use it strategically for planning and self-management (i.e. to regulate their emotions). In this sample, internal consistency was α = .85 for Overall MSCEIT score, α = .83 for Experiential Emotional Intelligence, and α = .74 for Strategic Emotional Intelligence.
AIM emotional intensity
Intensity of emotion was assessed by the AIM as described in Study I. In the Study II sample, internal consistency was α = .91 for AIM overall score.
Affect Lability Scale (ALS)
Lability of emotion was added to Study II and was assessed by the ALS (Harvey et al., 1989). The ALS is a 54-item scale used to assess the tendency of individuals’ moods to shift between what they consider normal mood to a variety of dysphoric moods (e.g. “One minute I can be feeling OK and then I feel tense, jittery, and nervous”). Responses are rated on a Likert scale from 0 to 3 (i.e. ranging from “definitely not characteristic of me” to “very characteristic of me”). The ALS has shown acceptable internal consistency and test-retest reliability (α = .76–.86; r = .56–.79). In this sample, internal consistency was α = .97.
Cognitive intelligence (IQ)
To control for any influence of cognitive IQ in a study of emotional intelligence (Ermer et al., 2012), IQ was estimated using the vocabulary and matrix reasoning subtests from the Wechsler Abbreviated Scale of Intelligence (Psychological Corporation, 1999).
Statistical analysis
Correlational analyses were conducted using Pearson’s correlation, and Table 1 presents correlations between the measures used in this study by weight status group. Comparisons of between-group variables were performed by t-test (with correction for unequal variances where necessary), ANCOVA or MANCOVA (with age and sex as covariates), and by χ2 tests. Separate analyses were conducted with the independent variable as weight status group and the dependent variable(s) as Overall MSCEIT score (analyzed using ANCOVA), MSCEIT subscale scores (analyzed together using MANCOVA), AIM total score (analyzed using ANCOVA), AIM subscale scores (analyzed together using MANCOVA), and ALS score (analyzed using ANCOVA).
A two-tailed alpha value of .05 was used to denote statistical significance for all analyses. MSCEIT scores are reported as empiric percentiles because the MSCEIT raw data were skewed. Empiric percentiles work to standardize raw scores so that if a raw score of .50 is equal to or higher than 75 percent of those tested in the norm sample, a raw score of .50 would be at the 75th percentile.
Results
Characteristics of participants
Participants with normal weight, overweight, and obesity differed only marginally in age and sex and not at all with respect to race, income, full scale IQ, or in proportion of participants with history of a medical or psychiatric illness (Table 3).
Characteristics of Study II sample.

MSCEIT: Mayer–Salovey–Caruso Emotional Intelligence Test (total score range: 0–100); AIM: Affect Intensity Measure (total score range: 27–162); ALS: Affect Lability Scale (total score range: 0–162); SD: standard deviation.
Analysis of variance.
Chi-square.
Analysis of covariance (age and sex as covariates).
MSCEIT emotional intelligence as a function of weight status
ANCOVA revealed significant differences by weight status in Overall MSCEIT score (F(2, 80) = 3.41, p = .038, partial η2 = 0.078, post hoc p < .05: normal weight = overweight > obesity). The difference between individuals with normal weight and obesity in Overall MSCEIT score (Cohen’s d = 0.71) was moderate to nearly large in size.
Follow-up MANCOVA revealed a main effect of weight status (Pillai’s trace = 0.121, F(4, 160) = 2.58, p = .04, partial η2 = 0.060) for MSCEIT Strategic Emotional Intelligence scores (F(2, 80) = 4.78, p = .011, partial η2 = 0.107) but not for Experiential Emotional Intelligence scores (F(2, 80) = 1.10, p = .338, partial η2 = 0.027). There was a linear trend for lower MSCEIT Strategic Emotional Intelligence scores from normal weight to overweight to obesity. The difference between individuals with obesity and normal weight for the MSCEIT Strategic Emotional Intelligence score (Cohen’s d = 0.88) was large in size. Figure 1(b) shows marginal means plots of these results.
MSCEIT emotional intelligence, weight status, and IQ scores
IQ scores did not differ significantly across weight status groups (Table 3). However, because it is possible that cognitive intelligence might influence emotional intelligence, we conducted analyses with IQ as an additional covariate to determine whether IQ had any influence on the primary outcome variables in this study. Differences in Overall MSCEIT scores were reduced to a trend level of significance (F(2, 79) = 2.67, p = .076, partial η2 = 0.063), while differences in MSCEIT Strategic Emotional Intelligence scores remained statistically significant (F(2, 79) = 3.25, p = .044, partial η2 = 0.076). Differences between individuals with obesity and normal weight were reduced in magnitude but remained moderate to nearly large in size (Cohen’s d = 0.63 for Overall MSCEIT; d = 0.72 for MSCEIT Strategic Emotional Intelligence).
MSCEIT emotional intelligence, weight status, and illness history
Although history of medical or psychiatric illness did not differ between the weight status groups (Table 3), follow-up factorial ANCOVA including weight status group, medical illness history, and psychiatric illness history was conducted as in Study I. This analysis revealed a significant effect of weight status group (F(2, 78) = 3.43, p = .037, partial η2 = 0.081) but no significant effect of medical illness history (F(1, 78) = 2.07, p = .155, partial η2 = 0.026) or psychiatric illness history (F(1, 78) = 1.96, p = .167, partial η2 = 0.024) for Overall MSCEIT scores. Using MANCOVA, there was also a significant effect of weight status group for MSCEIT Strategic Emotional Intelligence scores (F(2, 78) = 5.23, p = .007, partial η2 = 0.118) but not for medical or psychiatric illness history.
AIM emotional intensity and ALS emotional lability as a function of weight status
AIM and ALS total scores did not differ as a function of weight status (total AIM: F(2, 80) = 0.27, p = .765, partial η2 = 0.007; total ALS: F(2, 80) = 0.57, p = .569, partial η2 = 0.014). Follow-up MANCOVA also found no differences among the AIM and ALS subscales as a function of weight status.
Discussion
The purpose of this study was to assess relations among weight status and emotional intelligence in order to better understand differences in individuals’ ability to identify and appropriately regulate their emotions. Using a two-study design, we found that individuals with varying weight statuses differed in emotional intelligence but not in emotional intensity or lability. More specifically, individuals with obesity showed poorer self-reported attention to emotions and repair of emotions (which represents efforts to regulate emotions) than individuals with overweight or normal weight. These findings were replicated in a second sample, using objective measures of emotional intelligence, in which individuals with obesity demonstrated poorer strategic emotional intelligence (which represents efforts to understand and regulate emotions for self-management) than individuals with overweight or normal weight, even after controlling for the possible influence of cognitive intelligence. Combined, these results highlight possible difficulties individuals with obesity may have in identifying, understanding, strategically using, and repairing their emotions, which could have important implications for emotion regulation processes that can lead to problematic behaviors associated with eating and weight gain.
Our work contributes to a growing literature on the role of emotions in obesity and weight gain. We showed that individuals with obesity are less likely to attend to (e.g. think about) their emotions and less likely to engage in efforts to alter negative mood states compared to individuals with overweight or normal weight, which is consistent with literature showing that individuals with obesity have difficulties identifying and regulating their emotions (Baldofski et al., 2016; Michopoulos et al., 2015; Taube-Schiff et al., 2015; Zijlstra et al., 2012). These results are important for increasing our understanding of mechanisms that drive weight gain, as appetitive traits such as eating in the absence of hunger or food responsiveness may be influenced by the experience of negative emotions, which leads to weight gain (Crockett et al., 2015; Davis, 2009; Gianini et al., 2013; Konttinen et al., 2015; Raman et al., 2013). Importantly, our results did not point to differences across weight status groups in emotional clarity (i.e. the clarity and distinctiveness in which a person experiences emotions), intensity (i.e. the range of emotions experienced across situations), or lability (i.e. shifts in mood), suggesting that differences between weight status groups in emotionality are not influenced by the ability to distinctly experience emotions.
We found that individuals with overweight had similar ratings of emotional intelligence as individuals with normal weight, rather than similar ratings as individuals with obesity. There may be something distinct about having a significantly heightened BMI versus having an elevated BMI that is associated with lower emotional intelligence. Literature on emotional intelligence and health behaviors suggests that the association between these constructs may be mediated by the use of adaptive and healthy coping behaviors (e.g. maintaining healthy eating patterns and physical activity routines) in response to high stress or negative emotions (Zeidner et al., 2012). As weight gain occurs via excess energy intake relative to energy expenditure (French et al., 2012), differences in emotional intelligence may be a factor that could influence weight gain, particularly in an obesogenic food environment laden with prompts for unhealthy eating and sedentary behavior. However, importantly, we did not measure individuals’ lifestyle behaviors in this study and thus do not make the assumption that individuals with obesity have poor lifestyle behaviors. Prospective research is needed to assess whether differences in emotionality lead to changes in weight over time, and to understand mechanisms that precipitate and maintain such effects.
Our findings have implications for obesity assessment and treatment. It may be beneficial to assess for deficits in emotional intelligence when individuals present to treatment, as this may provide intervention targets for weight regulation efforts. For individuals with low emotional intelligence presenting to weight loss treatment, it may be helpful to teach strategies to more effectively notice and respond to emotions, in order to disrupt patterns that lead to unhealthy lifestyle behaviors that contribute to excess weight gain. Moreover, given the difficulty of sustaining weight loss over time (Loveman et al., 2011; MacLean et al., 2015), individuals with obesity and low emotional intelligence may benefit from learning strategies to increase adaptive coping during times of high stress that can facilitate weight loss maintenance.
Strengths of this study include a two-study design in a population-based cohort of adults that used two different measurement modalities of emotional intelligence. Given that much of the emotion regulation literature on obesity has focused on individuals with severe obesity (e.g. presenting for bariatric surgery (Zijlstra et al., 2012)), our analysis broadens the scope of this work by examining emotional intelligence and regulation among individuals of varied weight status. Study II, which aimed to replicate Study I, also is strengthened by controlling for the possible influence of cognitive intelligence. However, study limitations should be noted. Participants’ BMI was calculated based on self-reported height and weight, which can be subject to reporting bias. Further research to replicate these results should use objective height and weight measurements. In addition, both studies were cross sectional, and our data did not include measures of loss of control eating, emotional eating, or appetitive traits, which may have been useful for identifying consequences of poor emotional intelligence on eating. Future work should evaluate relations among emotional intelligence, emotion regulation, and prospective changes in weight (e.g. excess weight gain over time).
Conclusion
Results from this study suggest that individuals with obesity have reduced self-reported attention to emotions, repair of emotions, and strategic emotional intelligence but not emotional intensity or lability. These alterations were not demonstrated among individuals with overweight or normal weight, suggesting that discrepancies in emotional intelligence may be particular to a higher weight status class. Given that individuals with low emotional intelligence have poorer emotion regulation than individuals with high emotional intelligence, and that poor emotion regulation can lead to problematic eating behaviors associated with weight gain, our findings represent an important step toward increasing understanding of mechanisms that drive excess weight gain. More work is needed to characterize the effects of reduced emotional intelligence on weight changes over time.
Footnotes
Declaration of Conflicting Interests
The author(s) declared no potential conflicts of interest with respect to the research, authorship, and/or publication of this article.
Funding
The author(s) disclosed receipt of the following financial support for the research, authorship, and/or publication of this article: Portions of this work were supported by the National Institute of Mental Health (R01 MH063262), the National Institute of Child Health and Human Development (F32 HD089586), and the Agency for Healthcare Research and Quality (T32 HS000078).