
Abstract
The aim of this study was to determine if adults value health states or are willing to accept risk differently for themselves than for their children or elderly parents. Participants (701) were asked to rate four hypothetical health states for themselves using both the standard gamble and time trade-off methodologies. They then did the same assessments for a real or hypothetical child as well as an elderly parent. Participants were willing to take more risk or trade more years of life to avoid bilateral vision loss and mental impairment for themselves than they were for their children and elderly parents.
Keywords
Background
As health care costs rise, decision makers are increasingly employing economic evaluations to assess the costs and consequences of health care interventions or diagnostic tests (Neumann and Sanders, 2017). Economic evaluation has the potential to allow society to decide the most effective use of health care resources using a rational methodology. Cost-utility analysis has emerged as a recommended practice for the field as it is a more sophisticated analytic technique that takes into account patient preference (i.e. utility) for a particular health state (Sanders et al., 2016). The quality of a cost-utility analysis depends largely on the quality of the inputs that go into it. Although we can reasonably calculate the costs of care and the probabilities of different sequelae may be available in numerous studies, utility data are often lacking, and our understanding of the factors that influence utility valuation is poor (Goodwin and Green, 2016).
The measurement of health utilities involves defining health states of interest and then asking individuals to assess these health states and to place a value on each of them (Chen and Ratcliffe, 2015; Makkes et al., 2013; Thorrington and Eames, 2015; Whitehead and Ali, 2010). There is disagreement over who should be asked to value health states: patients versus the general population, as well as the perspective that should be taken (Drummond et al., 2009; Pickard, 2015). In fact, new guidelines recommend including more than one perspective (Neumann et al., 2017). Those in favor of patient valuation argue that patients know their health state better compared to someone who is only trying to imagine it, and studies have demonstrated that values elicited from patients tend to exceed those from the general public (Stamuli, 2011; Whitehead and Ali, 2010). There are numerous reasons for these differences including the way patients adapt to their health state. Those in favor of the general public valuing health states argue that patients’ values may potentially incorporate self-interest; therefore, the general public provides a more unbiased valuation, which is appropriate when the purpose of the valuation is to allocate society’s resources most effectively (Drummond et al., 2009; Pickard, 2015; Stamuli, 2011). Individuals often have to make medical decisions on behalf of young children or older adults who do not have decision-making capacity (Fried et al., 2017). In these situations, it is not uncommon for adults from the general public to be utilized as proxy respondents. It has been speculated, though, that the general public may exhibit significant differences when it comes to the valuation of health states for children or the elderly when compared to how they would value that same health state for themselves (Adlard et al., 2014; Kind et al., 2015). A recent study, for instance, showed that parents were more willing to vaccinate their children than themselves or their elderly parents (Tang et al., 2016).
Because decisions on expenditure of limited health care resources can depend on the ratio of cost to the subjective value or the health outcome gained, it is important that we understand how we as a society comparatively value the lives of children, adults, and the elderly. For example, standard cost-utility analysis involves the application of a constant discount rate (usually 3%) to both costs and utilities (Sanders et al., 2016). This approach may disadvantage interventions for children who can gain many more years of life than can an adult. Yet parents may value the survival of their offspring more than themselves. It is well documented that discount rates for health outcomes may deviate widely from this constant 3 percent value (Paulden et al., 2017). In classic expected utility theory, discounting is confounded with risk attitude when considering life expectancy.
As resources become scarce, it becomes critical that an appropriate accounting of risk attitudes and discounts for health outcomes be made. Therefore, the overall aim of this study is to examine if utility values differ systematically when adults are thinking of themselves or when they are thinking of an elderly parent or child. This work will inform researchers as to how to perform economic analyses, as well as policy makers as to how society values the life of a child and an elderly person compared to an adult.
Methods
Study population
We recruited a convenience sample of individuals between the ages of 18 and 80. The goal of the project was to uncover differences in the way individuals value health outcomes for themselves versus others for whom they might make health-related decisions (not to ascertain a population-based utility value for the health outcomes). For this reason, the choice of respondents was somewhat arbitrary, and a convenience sample was considered appropriate. In order to participate in the study, the individual’s primary language had to be English or Spanish. We believed the proportion of primarily Spanish-speaking persons was sufficiently large to warrant development and use of Spanish-language procedures and instruments.
Recruitment sites
Recruitment sites for this study consisted of the primary care clinics that participate in the Indiana University Primary Care Practice-Based Research Network (ResNet) and the Pediatric Research Network (PResNet). Additionally, we recruited participants at public venues that draw upon national audiences such as the Hyde Park Jazz Festival and the WrigleyVille Summerfest in Chicago, the Indiana Black Expo in Indianapolis, and local events in Florida.
Recruitment process
When participants were recruited from physician practices, the research assistants approached individuals in the waiting room and then moved to a more secluded area to obtain consent and conduct the interview. When participants were recruited from public venues, the research assistants set up an exhibit table that included signage and flyers that briefly explained the purpose of our study. When an individual expressed interest in the study, he or she was moved to an area behind the exhibit table that was partitioned off to provide privacy. It was in this more secluded area that consent was obtained and the interview conducted. Participants were each given a US$10 gift card after completing the assessments.
This study was approved by the Institutional Review Board of the Indiana University School of Medicine.
Health state descriptions
We utilized four different hypothetical health states during this study: Severe Seizure Disorder, Severe Bilateral Vision Loss, Severe Mental Impairment, and Diabetes. These had been used in prior studies by our group and found to have good variability in responses. These descriptions were written in the format of the Mark 3 version of the HUI, a multi-attribute health status classification system. The descriptions were also developed to be as clear and unambiguous as possible. In order to provide validation of the four developed health state descriptions, we sent these descriptions to a group of clinician experts who had experience with the health state of interest. They were asked to provide us with feedback regarding (1) whether the scenario accurately described the health state of interest, (2) whether the description was easily understandable, and (3) whether the description contained sufficient detail in order for an individual to provide a utility rating. Edits to the descriptions were made after the expert reviews were complete. These edited descriptions were then sent to naive reviewers for further evaluation concerning ease of understanding and sufficiency of detail. Final edits to the health state descriptions were made based on the feedback of these naive reviewers. These health state descriptions can be found in Appendix 1.
Study procedures
Much of our methodology has been described in detail in previous publications (Carroll and Downs, 2009) and is based on widely adopted standards in utility assessment (Stalmeier et al., 2001). The standard gamble (SG) and time trade-off are the two most accepted methods of directly assessing utilities of health states and therefore we utilized both methods in our study. To begin the procedure, the subject was presented with six 3″ by 5″ cards with the name of a health state printed on one side and the description of the health state on the other. The health states were “Diabetes Mellitus,” “Bilateral Vision Loss,” “Severe Seizure Disorder,” “Severe Mental Impairment,” “Well,” and “Dead.” The descriptions were read to the subject and the cards were scattered in a random order on a table. The respondent was asked to order the cards from the most desirable outcome to the least desirable, creating the rank ordering for utility assessments.
In both the SG and the time trade-off, people are given descriptions of health states and asked to sacrifice years of life or risk worse outcomes in order to achieve a more desirable health state. In the SG, respondents were presented with a lottery involving a 50-50 gamble between “Well” and their lowest ranked outcome, usually “Dead.” They were asked to choose between this lottery and getting the second worst outcome, for example, “Severe Mental Impairment” for sure. If the respondent preferred “Severe Mental Impairment,” the lottery was changed to a 75 percent chance of “Well” and a 25 percent chance of “Dead,” and the respondent was asked again to choose between the certain outcome and the lottery. With each response, the probability was set at half way between that probability and the last response, higher or lower, depending on the response (splitting). This is the most efficient approach to reach indifference and biases away from the endpoints. This was repeated until the respondent was unable to choose between the certainty and the lottery, the indifference point. At the indifference point, we assigned the utility of the certainty to be the expected utility of the gamble, that is, the utility of “Well” times the probability of “well” plus the utility of “Dead” times the utility of “Dead.”
To assess the utility of the next outcome, for example, “Bilateral Vision Loss,” it was compared to a 50-50 lottery between “Well” and “Severe Mental Impairment.” The probabilities were adjusted with splitting, as above to determine the indifference point. At the indifference point, the utility of “Bilateral Vision Loss” is, again, the expected value of the lottery, or in this case, the utility of “Well” times the probability of “well” plus the utility of “Severe Mental Impairment” times the utility of “Severe Mental Impairment.” This process of comparing each outcome to a lottery between “Well” and the next worse outcome known as “laddering” helps reduce the so-called death effect, which tends to inflate utility values (Sumner et al., 1991).
The time trade-off, on the other hand, had respondents determine the number of years of life with a health state they would be willing to give up to achieve a better one (Robinson et al., 2017). In the time trade-off, a respondent was asked to choose between living a certain number of years of life with a health state, for example, “Severe Mental Impairment” and living half as long in good health (“Well”). The number of years of life in the health state was calculated based on an individual’s age, and the age- and sex-based life expectancy of an American at that age, using standardized tables. If the respondent chose “Severe Mental Impairment,” the number of years in good health was increased to 75 percent as many years, and the respondent was asked to choose again. This process was repeated until the respondent was indifferent between the years in the health state and the reduced years in good health. Utilities derived by time trade-off have been shown to be theoretically and empirically similar to those obtained by the SG (Doctor et al., 2010).
In the time trade-off, no response could be worse than death. In the SG, however, the rating of health states allowed participants to choose death to be preferable to a health state. In that case, the value of death was set to zero and the worst health state was scaled to a negative number, and other health states were scored according to the SG methodology. In this way, all utility assessments were comparably anchored to death = 0 and good health = 1.
After agreeing to participate in the study, participants were interviewed by research assistants using a computer-based tool that had been previously developed by our research group.
The interview consisted of five sections: (1) Collection of demographic data. (2) Ranking of the four health states along with perfect health and death in order from best to worst. (3) Assessment of utility values, with the participant thinking of himself or herself. Participants were randomized to either the SG or time trade-off first, followed by the other method. (4) Assessment of utility values, with the participant acting as a proxy respondent for either a hypothetical or real child or elderly parent (at least 65 years) for whom they would have decision-making power. In other words, if they had an actual child or elderly parent, they were asked to consider that individual when doing assessments; if they did not, they were asked to consider an imaginary child or elderly parent, whose ages were then chosen at random. Whether the respondent served as a proxy for a child or elderly parent first was chosen randomly. (5) Repeat of the proxy valuation for whichever of the two (child or elderly parent) was not done before. However, this fifth step was not mandatory, as it was felt that this could be overly burdensome for participants to be forced to do so many valuations.
Analysis
For each method-disease combination, data for child or elderly utilities were paired with subject utilities by matching encounter ID. Utility measures for the SG method were omitted if death had utility = 1. If death was not considered the worst outcome (utility = 0), then utility scores for other outcomes were rescaled using this transformation: Y = 1/((1 − death) × utility) + (1 – 1/(1 − death)). Utilities were summarized for subject, child, and elderly person type and for differences of paired responses. Normality of the distribution of differences was tested by the Shapiro–Wilks test. Non-normal differences were tested for being different from zero by means of the Sign test. The Sign test tests the null hypothesis of equal proportions of positive and negative differences.
Results
We performed assessments on 701 participants. In addition to the 701 participant (self) person types, 611 child person types and 372 elderly person types were assessed. Not all pairs had complete data for participant (self), child, and elderly person. Participant demographic information can be found in Table 1. Most participants were black, and 69 percent of participants had children. About 81 percent of the assessments were done in English, and 19 percent were done in Spanish.
Demographic data for adult participants in this study.

SD: standard deviation.
Both the number (N) and percent are presented.
As a measure of internal consistency, we determined what fraction of respondents gave inconsistent preference ordering. This was done by determining whether the plot of SG responses as a function of time trade-off responses was monotonic. Non-monotonic responses suggest inconsistent ordering. This was 12.3 percent in our sample, which we interpreted as consistent with most direct utility assessments.
The median utility value for both the SG and time trade-off methods for the participant (self), as well as values when considering a child or elderly parent, can be found in Table 2. Severe mental impairment was determined to be the least preferred disease state, with median SG utility values ranging from 0.12 for self to 0.24 (elderly) and 0.31 (child). The continued order of rankings contained severe seizure disorder, then bilateral vision loss, and finally diabetes mellitus. These orderings were the same for the participant (self), as well as for the elderly parent and child valuations.
Median utility values for standard gamble (SG) and time trade-off (TT) assessments, along with (interquartile ranges) for each.
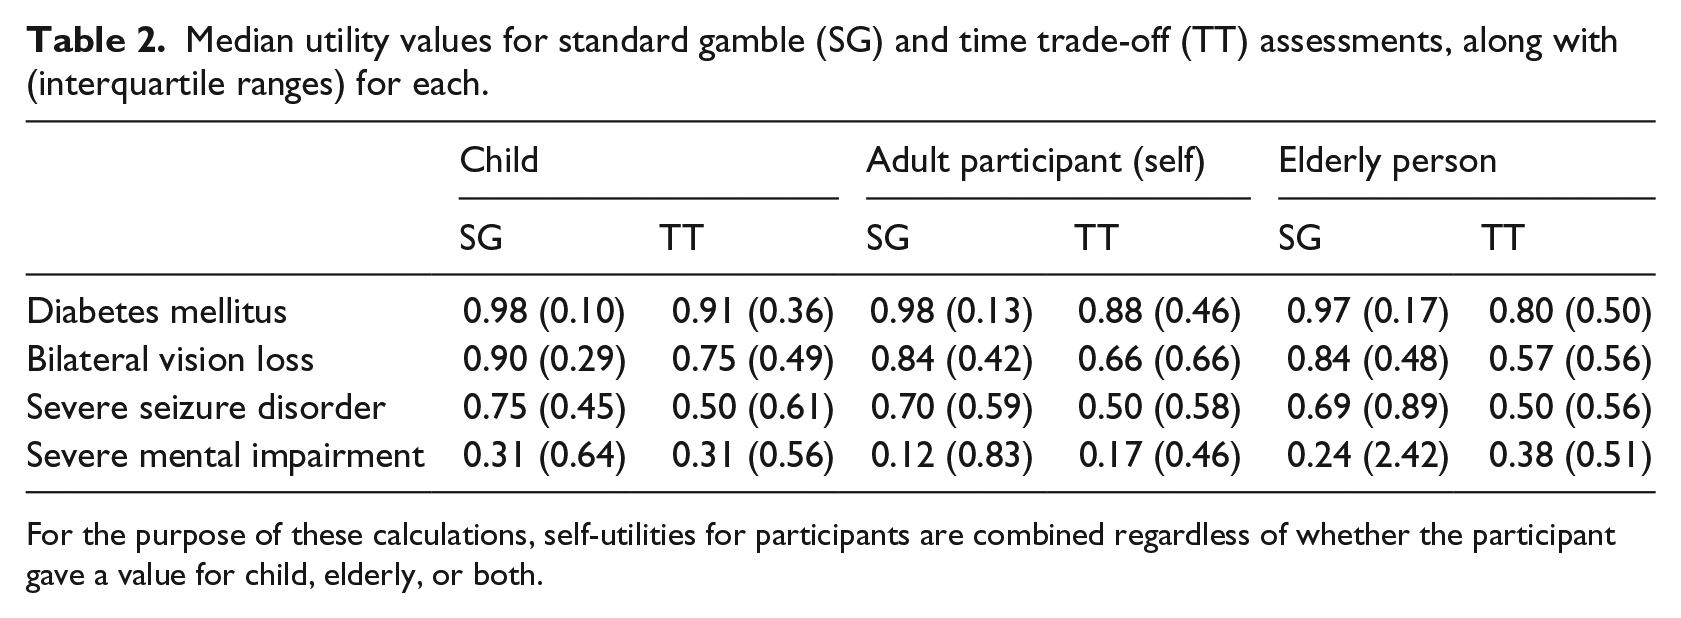
For the purpose of these calculations, self-utilities for participants are combined regardless of whether the participant gave a value for child, elderly, or both.
Death was considered the worst health state by 67 percent of people when considering themselves. When considering elderly parents, however, death was the worst health state in only 59 percent of participants. With respect to children, though, death was considered the worse health state in 77 percent of participants. In other words, participants were most likely to think that death was the worst occurrence when considering children and more willing to accept that death was a preferable outcome when considering elderly parents.
Table 3 shows proportions of participants classified into two categories, lower or higher self-utility values compared with child and elderly parent. Compared to themselves, participants were significantly more likely to hold lower utility values for bilateral vision loss for themselves than for their children (SG and time trade-off, p-value < 0.01) or elderly parents (time trade-off only, p-value < 0.02). For the condition of severe mental impairment, they were more likely to give a lower utility value for themselves than for their children (SG, p-value < 0.01) and more likely to have lower time trade-off utility values for themselves than for their elderly parents (time trade-off, p-value < 0.01). They were more likely to have lower utility values for themselves than for their children (p-value < 0.01), but more likely to have higher utility values for themselves than for their elderly parents (p-value < 0.01) for severe seizure disorder in the SG. No significant differences were seen for any of the utility assessments, regardless of method, for diabetes mellitus.
Proportions of participants with lower or higher self-utility values compared with child and elderly parent.

SG: standard gamble; TT: time trade-off.
Note: P<0.05 is bolded
For three of the four health states—diabetes, bilateral vision loss, and severe seizure disorder—the SG values were higher than the time trade-off values, implying risk-averse behavior. In other words, participants seemed less willing to risk a worse outcome to obtain a better one than they were willing to trade-off an absolute number of years, regardless for whom they were giving the utility value. However, when participants considered severe mental impairment, the SG values were lower than the time trade-off values, implying risk-seeking behavior. They were more willing to take a risk to avoid the outcome at hand than to trade off a known number of years especially for themselves or their elderly parents. Median utilization scores were about equal when considering children. These relationships are illustrated in Figure 1.
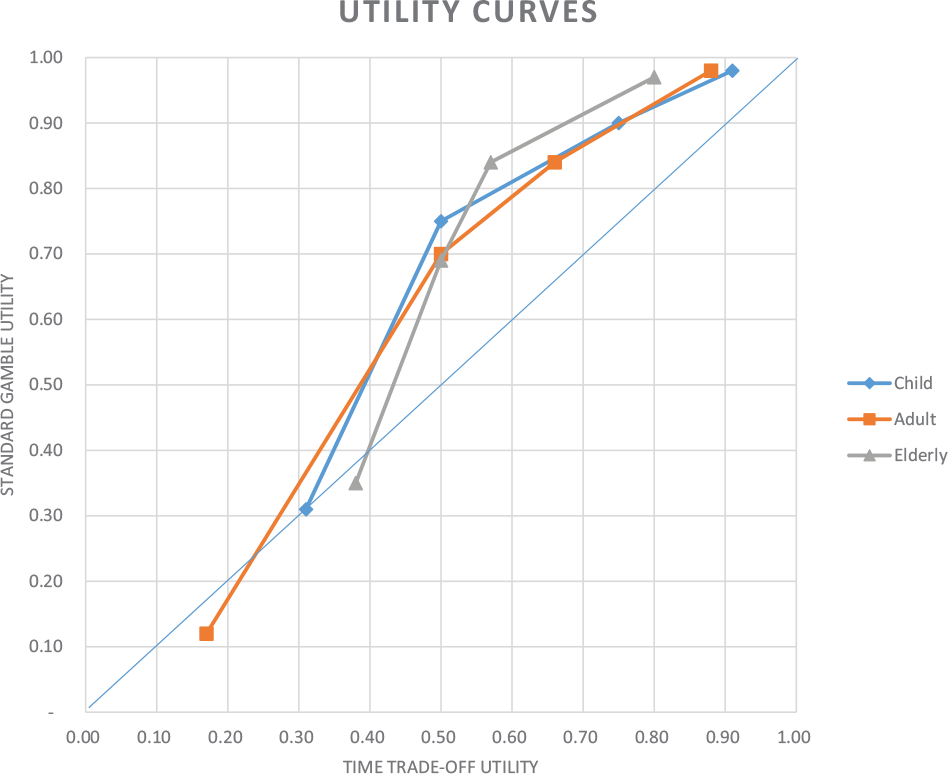
Utility curves showing median subject responses to the time trade-off (x-axis) and standard gamble (y-axis) utilities. Medians are in the risk-seeking domain for the lowest utilities and in the risk-averse domain elsewhere, consistent with Prospect Theory.
Discussion
This is one of the largest studies to date exploring how utilities for health states might vary by whether an adult is considering him or herself or a child or elderly parent for whom they are responsible. We found that utilities that the general public holds for themselves were sometimes significantly different from those they might hold for their children or for elderly parents. Based on our results, participants were, on average, willing to risk or trade more future years of life to avoid bilateral vision loss and severe mental impairment for themselves than they were for their children.
Moreover, it appears that the general public may be more willing to tolerate some conditions for their children or elderly parents than for themselves. This is consistent with earlier work suggesting greater risk aversion for younger versus older children when parents are considering decisions for their children (Finnell et al., 2012). Our study adds to the literature, by showing that adults are also more risk averse when considering decisions for their elderly parents as well. Viewed from the standpoint of discounting, these results may suggest that participants discount years of life at a higher rate for both the elderly and for children. While some studies have shown that demographic differences can alter viewpoints of the EQ-5D health states (Shaw et al., 2007), this study was consistent with our prior work in finding that these differences do not seem to be as significant with respect to direct utility value measurements (Carroll and Downs, 2009).
We have shown previously that curves of SG utilities, as a function of time trade-off utilities, demonstrate a risk attitude profile (Finnell et al., 2012; Rosen et al., 2003). The curves in Figure 1 show participants’ average profiles for themselves, and for when they are asked to consider a child or elderly parent for whom they are responsible. Median responses for the worst outcomes are in the risk-seeking domain (below the diagonal). The remainder of the responses are in the risk-averse domain (concave up curve above the diagonal). This pattern is consistent with Prospect Theory in which value functions differ depending on whether outcomes are viewed as gains or losses from some reference point (Kahneman and Tversky, 1979). Although one might imagine that respondents who imagined a child would respond differently from those who actually had a child, our preliminary analyses of these data suggest this is not the case (Chartash, 2016).
Differences in utility values of the magnitudes we observed (as high as 0.21 utilities) would certainly have the effect of changing some decisions, especially those that are close calls, in which the expected utilities of different options may be very close (Kattan and Cowen, 2009). However, even very important decisions can be altered by minor differences in utility values (Bansback et al., 2016; Veldwijk et al., 2016). The implication is that decisions made based on the general population may not represent the decisions that surrogate decision makers would make on behalf of their charges.
This study has limitations that warrant consideration. All work in this area depends on the ability of researchers to conduct consistent and high-quality utility assessments. Our research assistants have much experience, however, in conducting this type of research. The consistency of the results between SG and time trade-off values speaks to this. Moreover, the consistency of the findings with Prospect Theory lends credence to the results. Individuals can also have difficulty with utility assessments, and some believe that utility values themselves hold little meaning. Finally, our population was a convenience sample of mostly Midwestern people. The justification for this was stated earlier in the article. We recruited many people at national events, however, in order to widen our geographic distribution of participants. A random sample might yield different results, but this would have been prohibitive.
We used the SG and time trade-off methods to assess utilities. Other methods, specifically discrete choice (DC) multi-attribute methods, have gained popularity relative to these more classic techniques, largely because of their more reliable psychometric properties (Devlin and Krabbe, 2013; Richardson et al., 2015). While DC approaches are useful for achieving consistency across health economic models and large populations, they are insensitive to certain aspects of individual decision-making, specifically risk posture. For this reason, we chose to use the SG.
We also chose to frame the time trade-off (TTO) in terms of the respondent or respondent’s charge’s age. Again, this was done because of the desire to be sensitive to differences in individual preferences. When applied to population decisions, the TTO assumes a constant proportional trade-off over years of life. For our interest in comparing decision-making at between individuals, we wanted to minimize this effect.
Economic evaluations are becoming increasingly important. While there is still debate regarding whether patients or the general public are the appropriate population from which to elicit utility values, many groups including the US Public Health Service have recommended that a fully informed representative sample of the general public should be the appropriate source of health state values, based on the argument that the public bears the costs associated with health care decisions (Sanders et al., 2016; Stamuli, 2011). Our study demonstrates that utility values do not necessarily become lower when considering the elderly, which may have implications for how we discount years of life at different ages. Further work should explore the values the general public places on health at different times in their lives and how our focus of resources and policy might be impacted by those pivot points.
Footnotes
Appendix 1: health state descriptions
Acknowledgements
We would like to thank the Child Health Informatics Research and Development Lab (CHIRDL) and the Pediatric Research Network (PResNet) groups at the Indiana University School of Medicine for all of their work in collecting data for this study.
Declaration of conflicting interests
The author(s) declared no potential conflicts of interest with respect to the research, authorship, and/or publication of this article.
Funding
The author(s) disclosed receipt of the following financial support for the research, authorship, and/or publication of this article: This project was supported by a grant from the Robert Wood Johnson Foundation.