
Abstract
Trait-like sensitivity to stress in long QT syndrome patients has been documented previously. In addition, mental stress has been associated with symptomatic status of long QT syndrome. We examined whether the symptomatic type 1 long QT syndrome patients would be more sensitive to mental stress compared to asymptomatic patients and whether there would be differences in task-related physiological stress reactions between type 1 long QT syndrome patients and healthy individuals. The study population consisted of 21 symptomatic and 23 asymptomatic molecularly defined KCNQ1 mutation carriers, their 32 non-carrier relatives and 46 non-related healthy controls, with mean ages of 37, 39, 35 and 23 years, respectively. Electrocardiography was utilised to calculate inter-beat interval and high frequency and low frequency heart rate variability. Blood pressure was measured and mean arterial pressure and pulse pressure were calculated. Stress was induced using three different tasks: mental arithmetic, reaction time and public speech. Stress responses of symptomatic and asymptomatic type 1 long QT syndrome patients were not statistically different in any of the stress tasks. Short-term physiological stress reactivity of symptomatic type 1 long QT syndrome patients appears to be normal and does not enhance the risk assessment of asymptomatic mutation carriers.
Introduction
Long QT syndrome (LQTS) is a congenital cardiac disorder which may lead to ventricular arrhythmias, loss of consciousness and sudden cardiac arrest (Schwartz et al., 1975). These are often associated with physical or emotional stress. The disorder was described more than 50 years ago (Jervell and Lange-Nielsen, 1957; Romano, 1965; Ward, 1964), but the molecular cause was discovered first in 1990s. Several mutations affecting cardiac ion channels underlie LQTS (Curran et al., 1995; Wang et al., 1996a, 1996b). The three most common subtypes of LQTS are LQT1 and LQT2, which are caused by potassium channel genes KCNQ1 and KCNH2, respectively, and LQT3 which is caused by mutations in the cardiac sodium channel gene SCN5A (Splawski et al., 2000).
It is not fully understood why some LQTS patients have arrhythmic events while majority of mutation carriers remain asymptomatic. In LQT1, emotional stress has been the recognisable triggering factor in approximately every fourth cardiac event (Schwartz et al., 2001).
Previous studies on psychological factors in LQTS suggest that stress in different forms is associated with an increased likelihood of arrhythmic events (Hintsa et al., 2009, 2010, 2013; Määttänen et al., 2012, 2015). Interestingly, in addition to the heart, KCNQ1 gene is also expressed in brain (Goldman et al., 2009).
Although previous observational studies indicate an association between psychosocial stress and LQTS, the role of stress needs to be confirmed in controlled laboratory conditions. Also, previous studies of LQTS and stress have concentrated on QT intervals rather than other stress variables, unlike this study. The aim of this study was to examine in laboratory settings using three different physiological tasks (mental arithmetic (MA), reaction time (RT) and public speech (PS) procedures; Cacioppo et al., 1995) whether symptomatic and asymptomatic LQT1 patients differ from each other in stress reactivity and whether the stress responses of LQT1 patients differ from healthy subjects.
Materials and methods
Clinical study scheme
The study was approved by the Ethical Review Committee of the Helsinki University Hospital and was in accordance with the institutional guidelines and the Declaration of Helsinki. A written informed consent was obtained from all patients.
Participants
We examined four different groups: symptomatic and asymptomatic KCNQ1 mutation carriers, non-carrier relatives of LQT1 patients and healthy unrelated volunteers. The LQT1 patients and their healthy relatives were drawn from those Finnish LQTS registry patients who had participated in a large-scale questionnaire study of psychosocial risk factors and LQTS in 2006. A total of 47 LQT1 patients and 82 control subjects took part in the experiment. For the analyses, data were available from 122 subjects of whom 25 were not used in the stress analyses because of incomplete or missing variable(s). Among the subjects (number of subjects used in the stress analyses in brackets), 21 (18) were symptomatic and 23 (20) asymptomatic LQT1 patients. The first control group consisted of 32 (28) non-carrier relatives and the second control group of 46 (31) students. Symptomatic mutation carriers were subjects who had had a syncopal spell other than a typical vasovagal syncopal spell and they were categorised so by a cardiologist. All participants were otherwise healthy and without medications (including β-blockers) for at least from 2 days before coming to the experiment. In total, 4 asymptomatic and 15 symptomatic LQT1 patients were on any kind of medication before the study.
Symptomatic and asymptomatic LQT1 patients
The mean age of the 21 symptomatic and 23 asymptomatic LQT1 patients was 37.3 ± 13.4 and 38.6 ± 10.2 years, respectively. Altogether 9 (42.9%) of the symptomatic and 10 (43.5%) of the asymptomatic LQT1 patients were men.
Controls
Two control groups were used in order to understand the possibly differing reactivity of LQTS patients to healthy population. The first control group consisted of 32 healthy non-carrier relatives (14 men) of LQT1 patients and they are referred as ‘relative controls’. Their mean age was 35.2 ± 11.3 years. The second control group was recruited from the students in the University of Helsinki. It included 46 healthy student controls (4 men) with a mean age of 23.2 ± 4.6 years. They were mostly students studying in the Faculty of Behavioural Sciences and they responded to a recruitment invitation for the study on the Faculty web page.
Experimental procedure
All of the subjects were tested during the afternoon (after 12 pm). After arrival to the laboratory, the subjects were instructed to wash their hands before the experiment, close their cell phone and remove all large jewellery from neck, fingers and wrists. Trained medical personnel and a defibrillator were present when measuring the symptomatic LQT1 patients.
The experiment was conducted in an electrically shielded, sound-attenuated room with a computer for stimulus presentation and a keyboard for answering the tasks. The subjects read and signed the informed consent and were then to be seated in the laboratory. Headphones were put on the subject, and the subject was informed about a surveillance video camera in the corner of the laboratory (and hence it would be possible for the experimenters to see the subject during the experiment). The subjects were instructed to respond using the keyboard with their dominant hand, while the non-dominant hand was asked to be kept stationary. The subject also received questionnaires on experienced emotions before and after each task. They also reported anticipated and post-task perceived performance before and after each task.
The subjects were verbally instructed in between each segment of the experiment from the other room. There were three different tasks presented in a counterbalanced order: (a) MA, (b) RT task, and (c) PS task. Before the first task and after the last task, there were 8-minute rest periods, and between the tasks there were 5-minute rest periods. The lights were dimmed during the rest periods. After the first rest period and each task, the participants rated their emotions by answering a questionnaire.
Experimental tasks
MA task
During this task, the participants solved six 1-minute serial subtraction problems, adjusted for individual differences in terms of mathematical skills, continuously for 6 minutes. During minutes 1, 2, 3, 4, 5 and 6, respectively, the numbers to be subtracted from were 297, 688, 955, 593, 1200 and 1741. In order to maximise task involvement and moderate task difficulty, the subtrahend was bigger or smaller depending on the performance during previous minute. The numbers used were presented on the computer screen, and the participants gave their answers by typing on the keyboard. The subjects were informed about an error by presenting the word ‘wrong’ displayed on the screen and given the percentage of correct answers after each response. The number of correct and sufficiently quick answers (time limit was 10 seconds) was used to measure the performance in each problem.
RT task
The task included three increasingly difficult 3-minute blocks of 10 trials, which were presented to the participants. Each subject in each trial was given a 1000 or 2000 Hz tone through headphones and asked to distinguish them by pushing one of two buttons labelled either 1000 or 2000 Hz. If the answer was incorrect or not rapid enough, an unpleasant sound (400 Hz, 100 dB, instantaneous rise time) lasting 0.5 seconds was presented. Furthermore, performance feedback for the current trial and the percentage of correct answers scored so far were displayed on the computer screen after each trial. The break duration between two trials was 2–4 seconds. The RT deadline in each trial was contingent on the subject’s own time reaction. The RT task was meant to be an aversive situation (Puttonen et al., 2005; Ravaja et al., 2006).
PS task
The participants were asked to present a 3-minute speech. The preparation period was 3 minutes. The participant was instructed to give a defending speech connected with a hypothetical situation in which he or she was unfairly accused of shoplifting (Puttonen et al., 2005; Ravaja et al., 2006). They were informed that the performance would be evaluated by two experimenters and evaluated by them. The evaluators (one from both sexes) sat in the room during the task. A monetary prize for the best speeches was promised to enhance task involvement.
Physiological measures
Electrocardiogram (ECG) and blood pressure (BP) were measured. Several parameters were derived from ECG and BP signals. Combined values for each task segment were calculated and used in the analyses (beginning rest, final rest, MA, PS and its preparation, and execution of RT task).
The measurement equipment was placed in the following order: first the respiratory band to the chest, then the impedance cardiograph electrodes, first two to stomach below the sternum and then two to neck (in both a minimum 2 cm distance), then electrocardiograph electrodes one to the start of right arm, one to the left lower belly or up of the proximal aspect of the left leg, and a reference electrode to the inner left ankle. Next, the wires for ICG (impedance cardiogram) and ECG were attached. In addition, BP device was attached to the non-dominant wrist (thus, usually left) and EDA (electrodermal activity) electrodes with gel were attached to forefinger and middle finger (to the middle joint).
Data analysis
Data were recorded with a sample rate of 2000 Hz using Biopac software AcqKnowledge (version 3.8.2). Analysis was conducted with ECGlab toolbox in MATLAB (version 8.1; De Carvalho et al., 2002). After detection of R-spikes, resultant data were visually inspected according to Porges and Byrne (1992). Ectopic values were identified and interpolated for heart rate variability (HRV) calculations.
From the raw ECG data, inter-beat interval (IBI) and values describing HRV were calculated. Consecutive IBI values were transformed into uniformly sampled 4 Hz series using cubic spline interpolation.
Average IBI, maximum IBI and minimum IBI were calculated per each differing experimental set up. Calculated HRV values were following: high frequency (HF; 0.15–0.4 Hz) and low frequency (LF; 0.08–0.15 Hz). These mean square power values were obtained from the interpolated IBI series using Welch method with 512 point Hann windows with 50 per cent overlap.
Time varying continuous HRV parameters (HF and LF) were calculated over the time of the whole experiment. Mean values of these separate indexes during conditions were calculated (De Carvalho et al., 2003).
BP was analysed using mean arterial pressure (MAP) and pulse pressure (PP) as indicators of it. MAP is defined as average arterial pressure during a cardiac cycle and was calculated 2/3 diastolic BP + 1/3 systolic BP. PP was calculated by subtracting diastolic BP from systolic BP.
Because of the data collection settings, the raw BP data were partially negative, and a constant of 8.6 was added to all analysed values. The numbers did not represent absolute BP measurement with values such as mmHg, but showed the proportional reactivity in each individual. Thus, the numbers presented here (besides beginning rest-level values) describing BP (MAP, PP) represent the proportional change within individuals with the following calculation: score = (score – mean (baseline))/std (baseline).
Statistical analysis
All the HRV variables were log transformed before the analyses (Berntson and Stowell, 1998). When analysing task-level physiological responses, the baseline (first rest period) physiological value, symptom status, sex and age were included as the independent variables. The data were analysed with the analysis of covariance separately for each task (MA, RT, PS). The effects of different tasks on different stress variables were analysed separately as they represent different types of stressors. Sex and age were controlled in all of the analyses. MA, RT and PS tasks were also adjusted for the rest-level physiological measures. Effect sizes were estimated with eta-squared (η2).
All the ECG analyses were replicated with ‘subtraction-variables’ – where the stress variable in a given task is subtracted with the rest-level values. The results were the same as in the other analyses (results not shown). This ensures that the way in which the analyses were made did not have a huge impact on the results.
The beginning rest-level BP values were calculated differently from the other task’s values and thus they are not comparable with each other.
Results
Rest-level physiology
There were no significant differences in IBI (p > 0.1) between the groups (Table 1). There was a marginally significant main effect of group in predicting time varying LF HRV with mean values of 1.84, 2.01, 2.03 and 2.24 for symptomatic and asymptomatic LQT1 patients, relative controls and student controls, F(3,8) = 2.409, p = 0.071, η2 = 0.06. Symptomatic LQT1 patients differed only from student controls (p = 0.015). There was no significant main effect of group in predicting HF HRV (p > 0.1). The other tasks were not used as covariates for the analyses of rest-level analyses.
Stress variables of the LQT1 patients and controls.
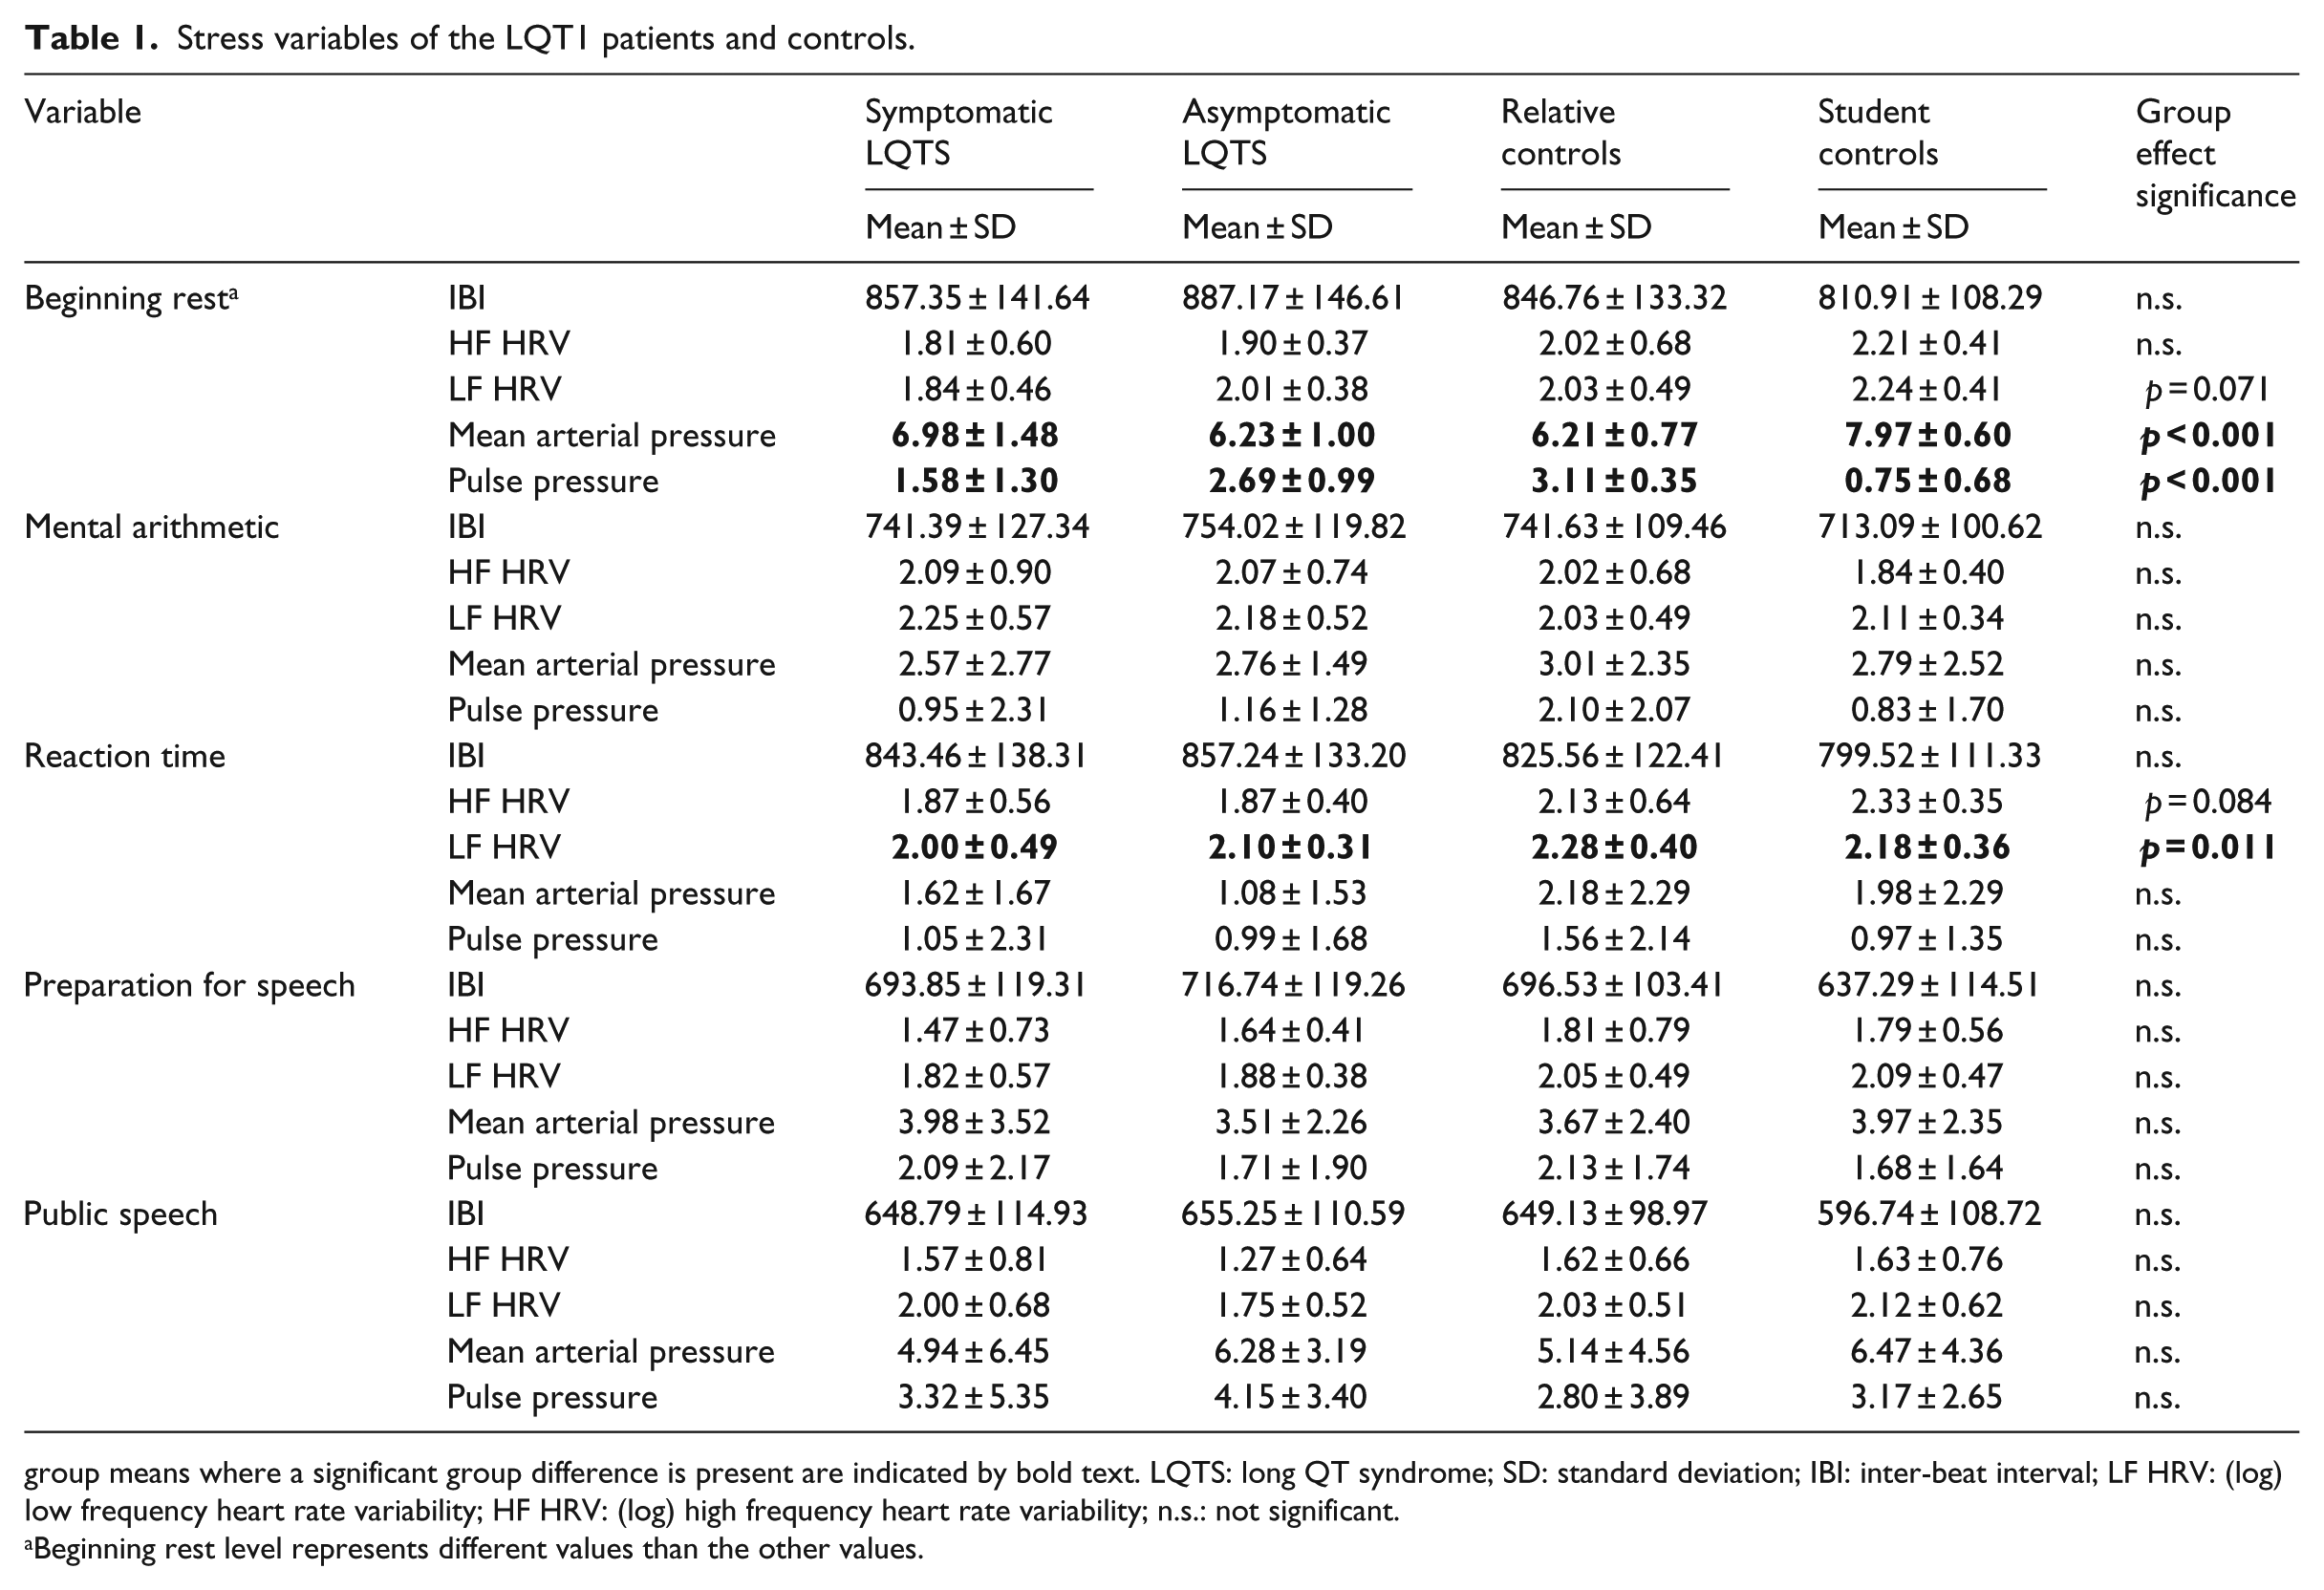
group means where a significant group difference is present are indicated by bold text. LQTS: long QT syndrome; SD: standard deviation; IBI: inter-beat interval; LF HRV: (log) low frequency heart rate variability; HF HRV: (log) high frequency heart rate variability; n.s.: not significant.
Beginning rest level represents different values than the other values.
There was a significant group effect of MAP and PP, suggesting differences between the groups, but no contrast analyses were made (Table 1).
MA task
There were no significant (all p-values > 0.5) group effects in predicting any of the physiological parameters (Table 1).
RT task
There were no group differences in IBI or HF HRV (p > 0.1) (Table 1). There was a significant main effect of group for LF HRV, F(3,9) = 4.537, p = 0.011, η2 = 0.095, with no significant contrasts between the groups.
PS task
There were no significant (p > 0.1) main effects of group in predicting any of the physiological parameters during speech preparation or delivery (Table 1).
QT times of the LQTS patients
Description of LQTS patients’ QT times, heart rate (HR) and QTc times measured at rest during the same day as other displayed measurements can be seen in Table 2. QT times are the typical way of distinguishing between symptomatic and asymptomatic LQT patients, but this study was mainly interested studying different, less studied, stress variables.
QT-interval data of the LQT1 patients.
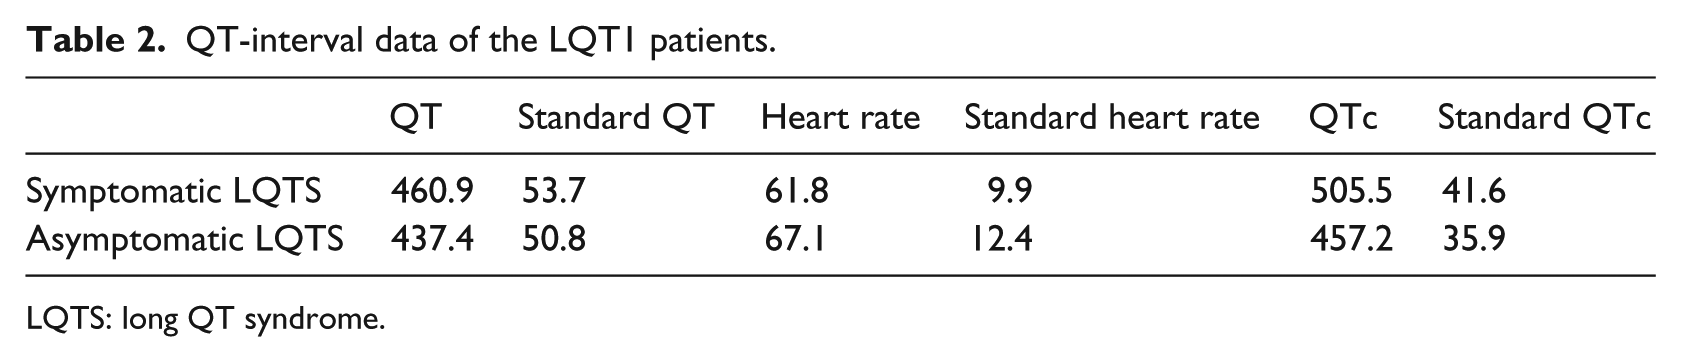
LQTS: long QT syndrome.
Discussion
We examined whether symptomatic and asymptomatic LQT1 patients differ from each other in stress reactivity and whether the stress responses of LQT1 patients differ from healthy subjects in laboratory settings. According to the results, stress responses to psychologically stressful laboratory tasks or rest period of symptomatic and asymptomatic LQT1 patients mostly do not differ from each other. In addition, when all LQT1 patients were compared to the control groups, their stress reactivity was mostly similar. There were marginally significant differences between the LQT1 patients and control groups in the physiological stress during the rest period.
Interestingly, there were no HRV differences between any of the groups in MA and PS tasks, which are generally considered to be the more stressful tasks. This may indicate that the symptomatic and asymptomatic LQT1 patients may also be resilient in their stress reactions to many everyday stress-contexts.
BP is not a completely separate measure but is integrated into the entire cardiovascular system. Two major additional measures can be obtained from BP: MAP and PP (Shapiro et al., 1996). In this study, baseline rest MAP and PP differed on the group level, a finding that is likely to be influenced by several other factors besides stress reactivity. The baseline rest values may depend on the sitting height, sex, age, weight and physical condition of the person. On the other hand, the other tasks’ MAP and PP were adjusted by the baseline and baseline standard deviation. This study was set up to test stress reactivity, not baseline BP, although it is true that baseline values may sometimes give relevant information about stress.
It is important to note that the LQT1 patients did not significantly differ in their MAP and PP from each other or the control subjects in any of the stress tasks. BP reactivity has been shown to predict also long-term rise in BP (Matthews et al., 2003). High BP combined with high sympathetic nervous activity may be a predictor of cardiac arrhythmias (Esler, 2000). There is also causation to different direction so that people with stronger response to stressful tasks are more prone to develop future high BP (Gasperin et al., 2009). It has to be noted that the results of this study differ from previous research studying long-term stress exposure or reactivity of LQTS patients (Hintsa et al., 2009, 2010, 2013, 2016; Määttänen et al., 2011, 2012, 2013, 2015).
The strength of this study was to include both symptomatic and asymptomatic patients. Stressors that had not been used in previous studies, that is, PS and RT task with a startle sound, were used (Paavonen et al., 2001) and HRV was measured in other situations besides rest, unlike some previous studies (Perkiömäki et al., 2001).
When studying the stress sensitivity of LQTS patients in a psychophysiological laboratory setup, there should be great emphasis on the type of stressors as the reactions may differ significantly between the tasks. Tasks used in future studies could be, for example, a startle sound without the need of reaction of the subject. However, normal reactivity to short-term stress does not mean that stress would not induce harmful neurohumoral changes in LQTS patients. Since long-term stress has already been associated with the risk of arrhythmic events in LQTS (Hintsa et al., 2010), it is possible that persisting stress results in hormonal and electrolyte abnormalities which then predispose a LQT1 patient to increased risk of ventricular arrhythmias.
Limitations
The non-relative student control group was not age- and sex-matched and therefore these controls were younger and had more women than the other groups. In addition, we cannot rule out that the lower sympathetic nervous system activation of LQT1 patients could not result from the remaining β-blocker effect despite the discontinuation of the drug among the patients.
Conclusion
Symptomatic LQT1 patients do not manifest abnormal reactivity to acute stress, nor does their physiological stress reactivity differ from that in asymptomatic LQT1 patients. Therefore, it is not likely that testing LQT1 patients for stress reactivity with HR, HRV or BP could be used as a part of risk assessment of asymptomatic patients.
Footnotes
Acknowledgements
The authors thank Mrs Hanna Ranne for her excellent technical assistance.
Declaration of conflicting interests
The author(s) declared no potential conflicts of interest with respect to the research, authorship and/or publication of this article.
Funding
The author(s) received the following financial support for the research, authorship, and/or publication of this article: This study has been supported by a grant from the Finnish Foundation for Cardiovascular Research, Helsinki, Finland.