
Abstract
The A-ADS is one the first validated measures of attitudes of dementia in adolescents, though further validation is needed. 630 adolescents were recruited from secondary schools in England. A Principal Component Analysis was completed (n = 230) followed by a Confirmatory Factor Analysis (n = 400). Reducing the A-ADS into a single factor, 13-item measure (Brief A-ADS) improved the model fit of the measure (χ2 = 182.75, DF = 65, CMIN/DF = 2.81, p < 0.001, CFI = 0.90, RMSEA = 0.07). The scale demonstrated good internal consistency, good predictive and concurrent validity. Building on the validation of the A-ADS, the Brief A-ADS is suitable to capture attitudes towards dementia amongst adolescents.
Public stigma and misconceptions towards dementia is widespread (Alzheimer’s Disease International, 2019). Stigma can lead to a people with dementia being socially isolated, not sharing their diagnosis or avoiding seeking support (Alzheimer’s Disease International, 2019; Alzheimer’s Society, 2008, 2012; Iliffe et al., 2005; Milne, 2010). Theoretically, raising awareness of dementia is a key mechanism to reduce stereotypes and prejudice towards people living with the condition (Mukadam and Livingston, 2012). It is therefore unsurprising that raising awareness around dementia is at the forefront of international policy (Alzheimer’s Disease International, 2019; Batsch and Mittelman, 2012; Department of Health, 2009; Scottish Government, 2013; World Health Organisation, 2017).
There are a number of initiatives in existence that aim to change attitudes towards dementia which are usually focused on adult populations, healthcare professionals or healthcare students (Banerjee et al., 2017; George et al., 2013). Comparatively, there have been far fewer initiatives developed for younger people, despite there being evidence that stigmatising attitudes and misconceptions towards dementia already exist amongst adolescents (Cowley, 2005; Farina et al., 2020; Isaac et al., 2017). Crucially, both the impressionable years hypothesis and increasing persistence hypothesis suggest that people are more susceptible to attitude change earlier in life, albeit for different theoretical reasons (Glenn, 1974; Krosnick and Alwin, 1989; Marinova, 2013; Visser and Krosnick, 1998). The impressionable years hypothesis states that when individuals are young, experiences have a profound impact on their thinking. Once these early years have passed, attitudes become more resistant to change (Docking and Stock, 2017; Krosnick and Alwin, 1989). In the increasing persistence hypothesis, attitudes are believed to be flexible and responsive to social situations when young, though as they age, this flexibility gradually decreases (Krosnick and Alwin, 1989; Mortimer and Shanahan, 2006).
Several dementia awareness initiatives aimed at young people have been developed, usually delivered through schools (Atkinson and Bray, 2013; Chow et al., 2018; Di Bona et al., 2019; Nazir and Bangash, 2015; Parveen et al., 2015; Rylance and Pendleton, 2015). These initiatives tend to evaluate dementia attitude change using qualitative methods or single-item questions. However, none of these initiatives have been evaluated using validated measures. This might be in part due to a lack of validated measures developed for use in young people. Only a single dementia awareness initiative (KIDS4Dementia) aimed at Australian young people (9–12 years old) (Baker et al., 2018) has been empirically evaluated using the authors’ Kids Insight into Dementia Survey (KIDS) (Baker et al., 2017). KIDS is made up of three factors; ‘Personhood’, ‘Stigma’ and ‘Dementia Understanding’, and demonstrates overall good internal consistency (ωt = 0.83).
The value of using standardised measures are well documented; allowing us to have a more objective outcome and allowing outcomes to be compared across initiatives and settings. The lack of empirical evaluation of such initiatives, including dementia friendly initiatives more broadly (Hebert and Scales, 2017), may also be attributable to the notion that they are ‘inherently good’ and therefore do not warrant the same level of scrutiny. However, there is evidence that anti-stigma strategies are not all equal, with some being less effective, whilst others causing harm through concreting negative stereotypes (Mental Health Commission of Canada, 2013).
The Adolescent Attitudes towards Dementia Scale (A-ADS) is the first measure specifically designed and developed to capture attitudes towards dementia amongst British younger people, specifically aimed at those aged 13 to 18 years old (Griffiths et al., 2018). The scale has three underlying factors; ‘perceptions of dementia’, ‘empathy’ and ‘personal sacrifice’ (α > 0.60). Scores on this scale correlate with other measures of attitudes towards dementia, originally validated amongst adult populations (i.e. Dementia Attitudes Scale, Attitudes towards Older People Scale, Lundquist & Ready Scale; (Kogan, 1961; Lundquist and Ready, 2008; O’Connor and McFadden, 2010) (r = 0.49–0.94). However, the A-ADS only been validated in a single UK sample, and as the original authors stated, there is a need to confirm the construct validity of the model using a Confirmatory Factor Analysis (CFA) (Griffiths et al., 2018) demonstrating strong statistical underpinnings to the scale.
The present study aimed to further validate the A-ADS in a sample of adolescents from the South of England, this was achieved first by running an Exploratory Factor Analysis (EFA) followed by a CFA. The secondary aim was to understand whether it was possible to reduce the number of items in the A-ADS, without effecting its validity, so to further promote its use in settings where time is at a premium.
Methods
Sample
A sample of adolescents (ages 13–18) were recruited from secondary schools in South East England. Approvals were obtained from the Head Teacher or Deputy Head Teacher prior to approaching the students. The survey was distributed by teachers within school time, apart from age there was no additional inclusion or exclusion criteria. All participants were provided information sheets prior to participation, with the opportunity to opt-out of the research. Nine-hundred and one adolescent participants were recruited across four schools, further details about the whole sample have been reported elsewhere (Farina et al., 2020).
For this study, participants were only included if they had no missing data from the A-ADS measure (n = 630). This sample was randomly split into two (using SPSS), so that EFA and CFA could be run separately. For the EFA, 230 participants were randomly selected and were on average 15.0 years old (SD = 1.45), female (n = 130, 56.8%), and predominantly White British (n = 177, 83.1%). The remaining 400 participants included in the CFA were on average 14.9 years old (SD = 1.48), female (n = 230, 57.8%) and predominantly White British (n = 290, 72.5%). There was no significant difference between the split samples on age (U = 44962, p = 0.79), gender (χ2 = 0.06, p = 0.80) or ethnicity (χ2 =1.51, p = 0.22).
Materials
Age, gender and ethnicity (free-text) were captured.
The A-ADS (Griffiths et al., 2018) is a 23 item scale that captures attitudes towards dementia in adolescents. Items are rated on a 5 point Likert scale. The scale is composed of three factors, ‘perceptions of dementia’, ‘personal sacrifice’ and ‘empathy’ with people living with dementia. Higher scores represent better attitudes towards dementia. See Supplemental Appendix A for total score syntax.
The Allophilia scale (Kinney et al., 2017; Pittinsky et al., 2011) is a 17-item questionnaire of positive attitudes towards outgroups (i.e. dementia). As per previous recommendations, a single item ‘I would like to be more like someone with dementia’ was removed from total analysis (Pittinsky et al., 2011). Items are rated on a 6 point Likert scale. Higher scores represent more positive attitudes towards dementia.
Analysis
EFA: A Bartlett’s test of sphericity and Keiser-Meyer-Olkin (KMO) were checked prior to EFA to confirm the suitability of the data EFA. A Principal Component Analysis (Direct Oblimin Rotation) was run in which factors were reported based on having an Eigenvalue > 1 and visual inspection of the scree plot. Percentage of variance factors accounted for were reported. After the initial EFA, the Velicer’s minimum average partial (MAP) test (Velicer, 1976) and parallel analysis (Horn, 1965) were ran to provide an alternative indicator of factors, utilising a syntax reported elsewhere (O’connor, 2000). This informed whether an alternate forced factor model should be explored.
Decisions about item retention were made by initially reviewed the factor loadings, considering how the items are theoretically grouped, and whether there were similarities with the original A-ADS factor structure. However, we also used statistical outcomes to help inform our decision making. Item loadings >0.4 were consider as adequate fit, and >0.6 consider good fit. In cases where cross loading occurred (i.e. items loaded on multiple factors), the factor that the highest loading was chosen as. Item loadings less than 0.6 were also required to not cross-load onto a second factor (defined as being within by 0.2 absolute difference between item loadings). Cross-loading can be problematic, and absolute difference of 0.2 has been suggested to be a threshold between a small and large difference, thus warranting item removal (Ferguson and Cox, 1993). In line with previous guidance, factors were required to contain three items (Yong and Pearce, 2013).
Internal consistency was then checked using Cronbach’s alpha, including confidence intervals (CIs). Items were subsequently removed if the item removal improved the Cronbach’s alpha outside of 95% CIs. Concurrent validity was assessed through a correlation between the A-ADS and the Allophilia scale. Predictive validity was assessed through a t-test between people that agreed and disagreed to the statement ‘In general, I have positive attitudes about people with dementia’. This question is taken from the Allophila scale and response format was dichotomised.
CFA: A structural equation model was created (AMOS) using Maximum Likelihood Estimation. Two models were created (1) using the three factor structure described in Griffiths et al. (2018), and (2) using the factor structure of the 13-item A-ADS identified in the EFA. Model fit was assessed using the following statistics: the χ2 statistic, the Comparative Fit Index (CFI), Standardized Root Mean Square Residual (SRMR), and the Root Mean Square Error of Approximation (RMSEA). A non-significant χ2 indicates a good model fit. A χ2/DF ratio between 1 and 3 indicates an acceptable fit between the hypothetical model and sample data. A SRMR value below 0.08 indicates good fit. For the RMSEA, values less than 0.08 indicate a reasonable error of approximation, whilst the CFI value ⩾0.90 is indicative of good fit. As the purpose was to determine the suitability of the A-ADS factor structure, no attempts were made to improve or change the model fit.
Similar to the EFA, psychometric properties were reported for the 13-item A-ADS and 23-item A-ADS. In addition, a Pearson’s correlation was run between the 13-item A-ADS and 23-item A-ADS.
Readability: In consideration of the practicalities of using the 13-item A-ADS in an adolescent age group, we also examined the readability of the text. Four readability statistics were calculated for the item text, providing an US grade-level readability, which were converted into age by adding six. A final index of readability age was calculated by averaging scores across readability statistics. The procedure of calculating this is described in detail elsewhere (Patalay et al., 2018).
Ethics
Ethical approval was obtained from the Brighton and Sussex Medical School Research Governance and Ethics Committee.
Data sharing statement
We regret that publishing anonymised study data is not possible because informed consent was not obtained from participants to allow the data to be used in this manner.
Results
Exploratory factor analysis
Bartlett’s test of sphericity confirmed that correlations between items were large, χ2 (253) = 1823.24, p < 0.001. A KMO test indicated suitable sample size for EFA (KMO = 0.88), with an item-participant ratio of 10:1. A Principal component analysis revealed five factors that loaded (Eigenvalue > 1), accounting for 55.55% of the variance. The parallel analysis of 1000 data sets using 95% cut-off was conducted. The first five eigenvalues extracted from the simulation were 1.73, 1.60, 1.50, 1.43 and 1.36. In the actual data, the only the first two eigenvalues of 7.07 and 1.93 exceeded chance values, suggesting that a two factor structure underlies the data. For the MAP test, the smallest average fourth power partial correlation was 0.0005; only two factors had higher correlations (0.012 and 0.0008 respectively), also indicating a two factor solution.
After reviewing the component matrix and loadings in a five factor (Table 1), and forced two factor model (Table 2), only a single factor had items with; (a) high item loadings and, (b) did not cross-load onto other factors. The choice to focus on a single factor solution was further supported by the fact that a second factor, did not have appear to have a common theme linking the items. Several items loading onto the second factor appear to represent ‘I feel’ or ‘I would feel’ statements, but these often also more often strongly loaded on the first factor. Importantly, the second factor items did not closely represent any factor from the original 23-item A-ADS factor structure (i.e. items spanned empathy, perceptions and sacrifice).
Principal component analysis revealing a five factor structure (Eigenvalue > 1). Standardised loadings are reported (>0.3).
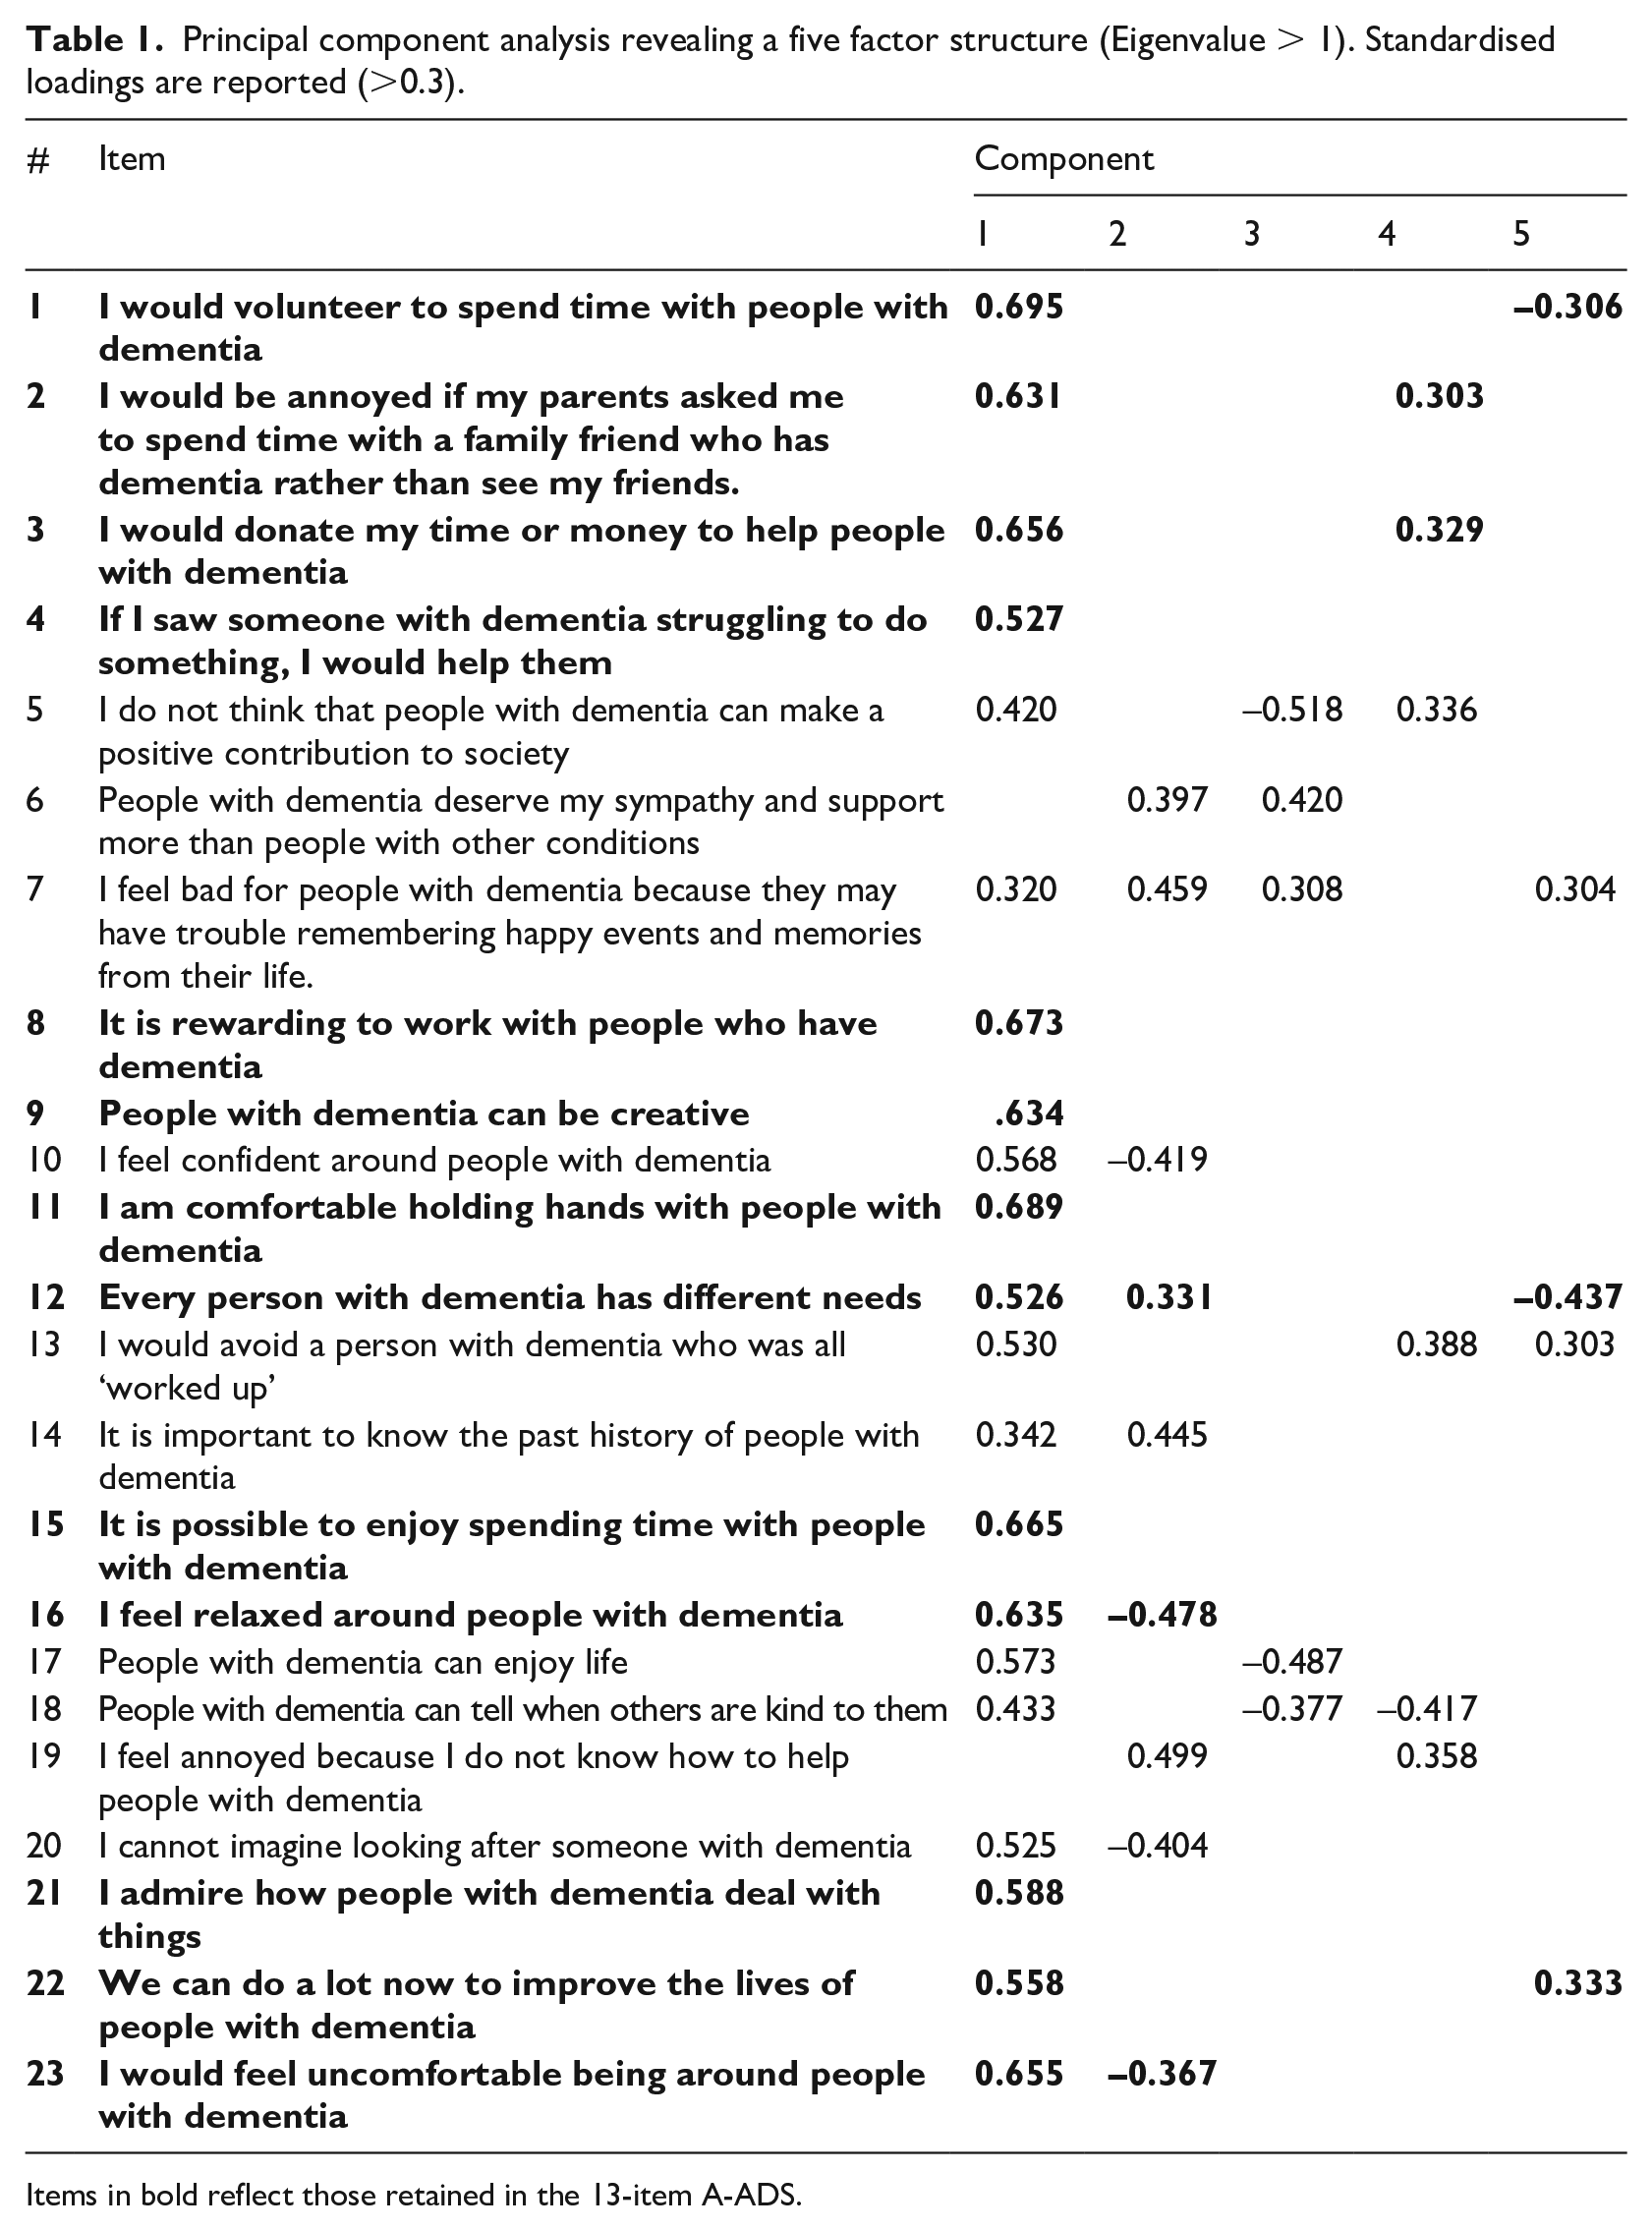
Items in bold reflect those retained in the 13-item A-ADS.
Principal component analysis forced two factor structure (based on MAP and parallel analysis). Standardised loadings are reported (>0.3).
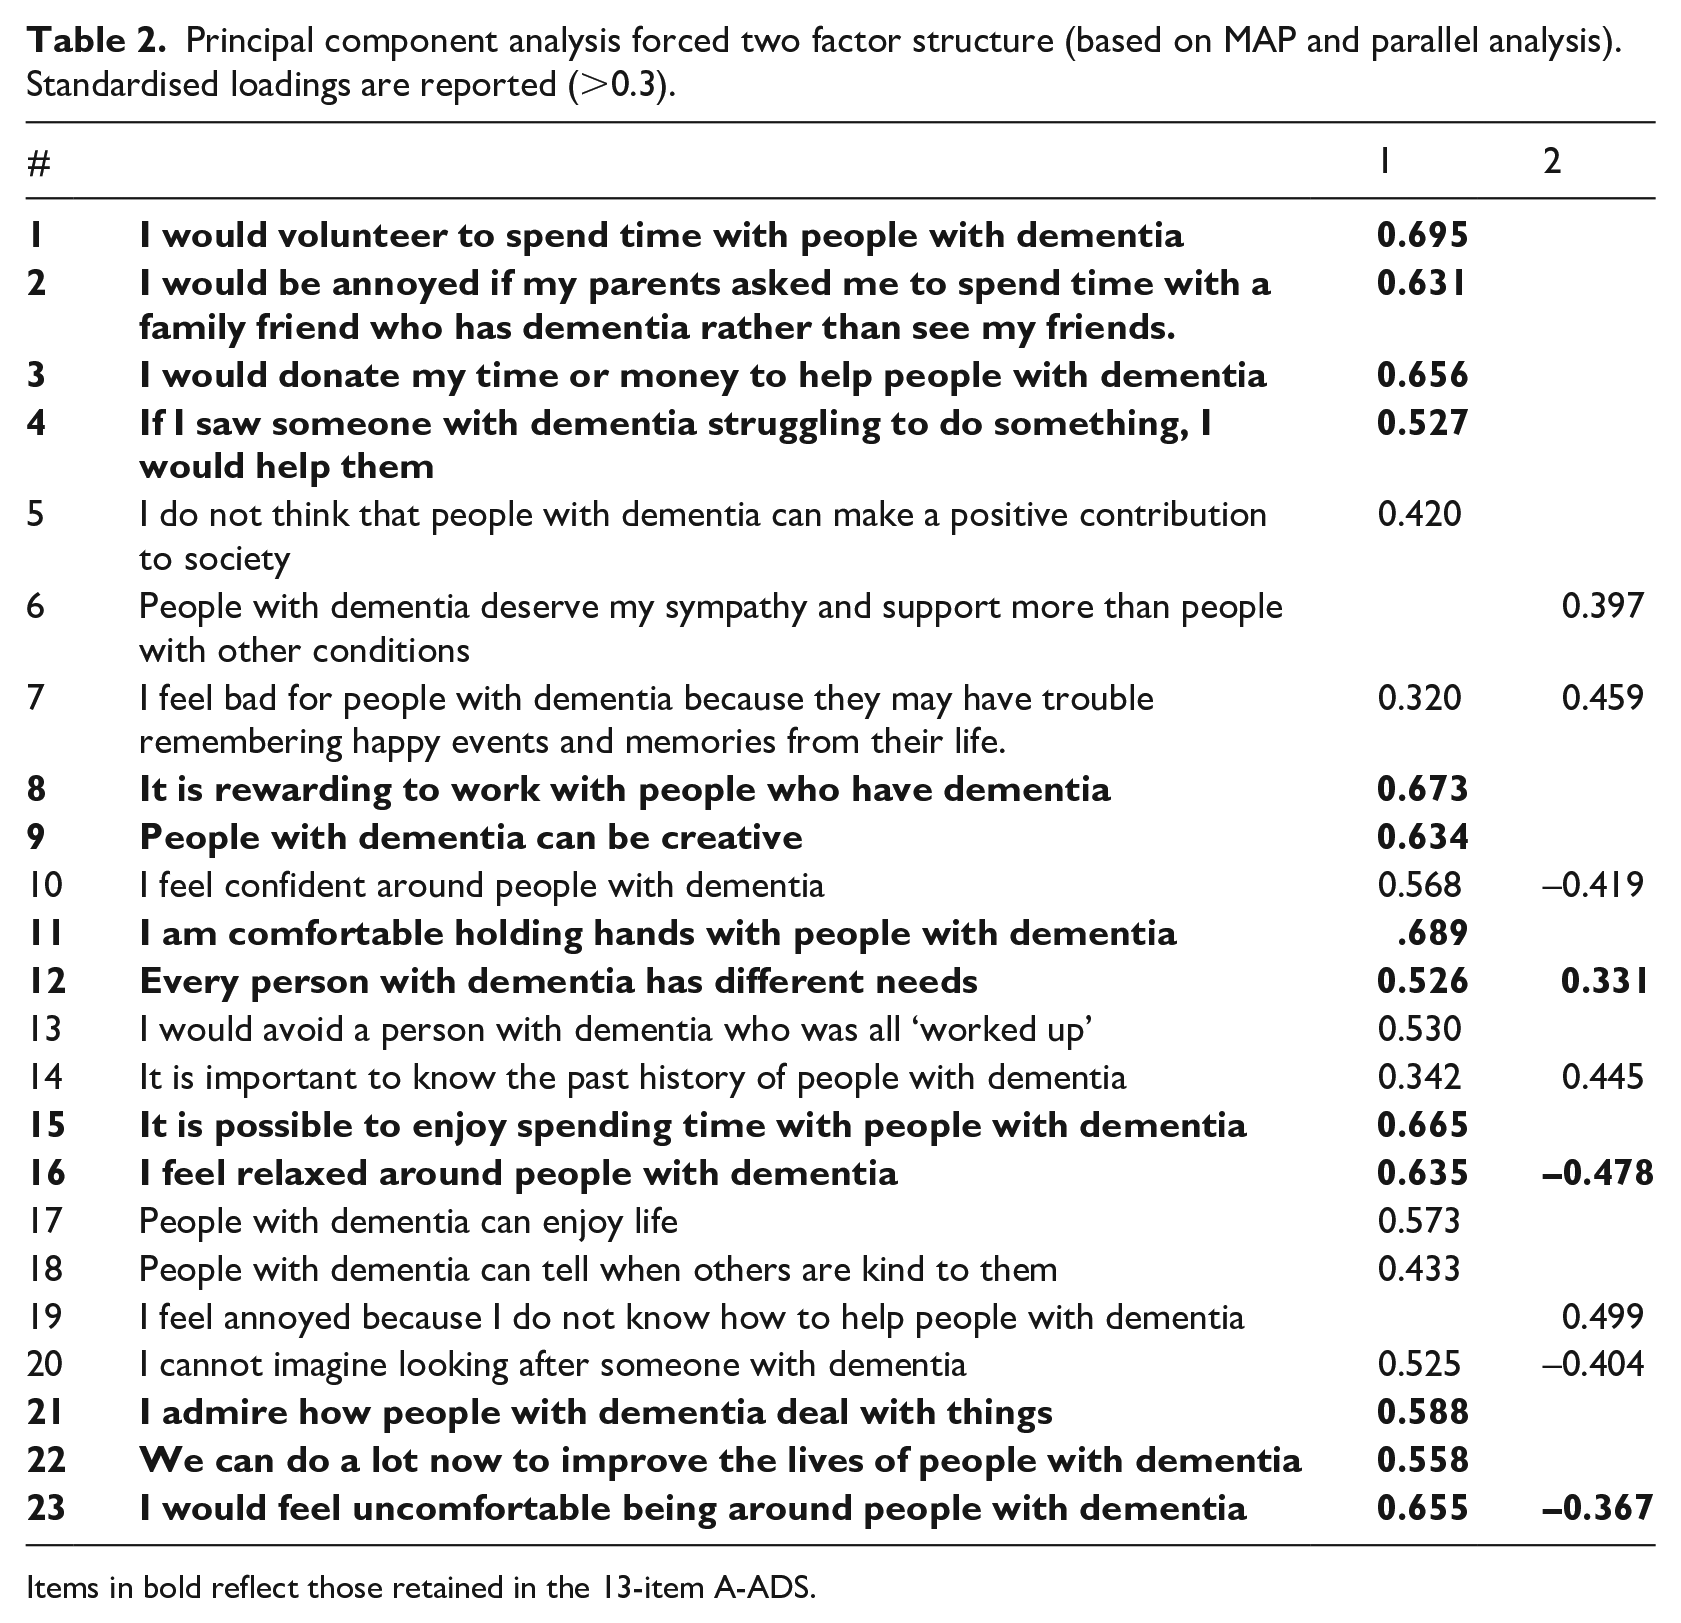
Items in bold reflect those retained in the 13-item A-ADS.
Items in bold reflect those retained in the 13-item A-ADS. In adopting a single factor structure, the scale had 13 items, with a good internal consistency, α = 0.88 (95% CI, 0.85–0.90). Individual item removal would not have improved the internal consistency of the factor. The 13-item A-ADS had good concurrent validity with the total Allophilia scale (r = 0.77, p < 0.001). The 13-item A-ADS also had good predictive validity, being able to differentiate between people who self-report having positive attitudes toward dementia (t = −5.53, p < 0.001). A summary of measure characteristics is presented in Table 3.
Characteristics of the 13-item A-ADS within the two samples.
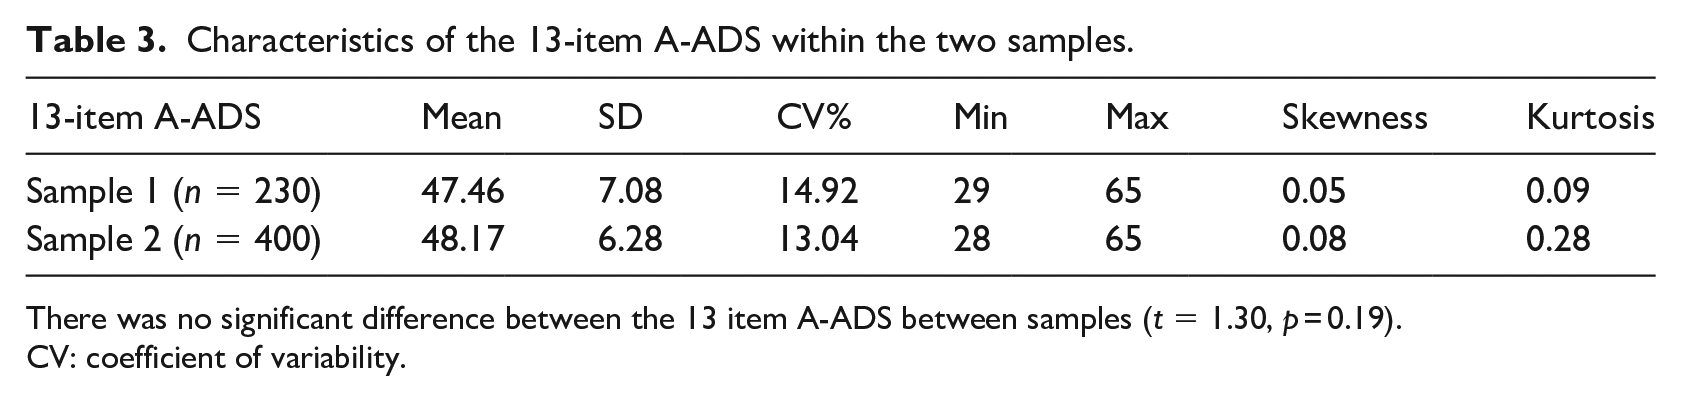
There was no significant difference between the 13 item A-ADS between samples (t = 1.30, p = 0.19).
CV: coefficient of variability.
Confirmatory factor analysis
The 23-item A-ADS model indicated questionable to poor fit (χ2 = 717.15, DF = 227, CMIN/DF = 3.16, p < 0.001, CFI = 0.76, RMSEA = 0.07, SRMR = 0.07). Within the model there were seven items that had low standardised regression weight loadings (<0.4), potentially warranting their removal (See Table 4). For the 13-item A-ADS, the model indicated improved, albeit adequate, fit (χ2 = 182.75, DF = 65, CMIN/DF = 2.81, p < 0.001, CFI = 0.90, RMSEA = 0.07, SRMR = 0.05). Only a single item within the model had a low loading (‘We can do a lot now to improve the lives of people with dementia’).
Standardised regression weight loadings in confirmatory factor analysis.
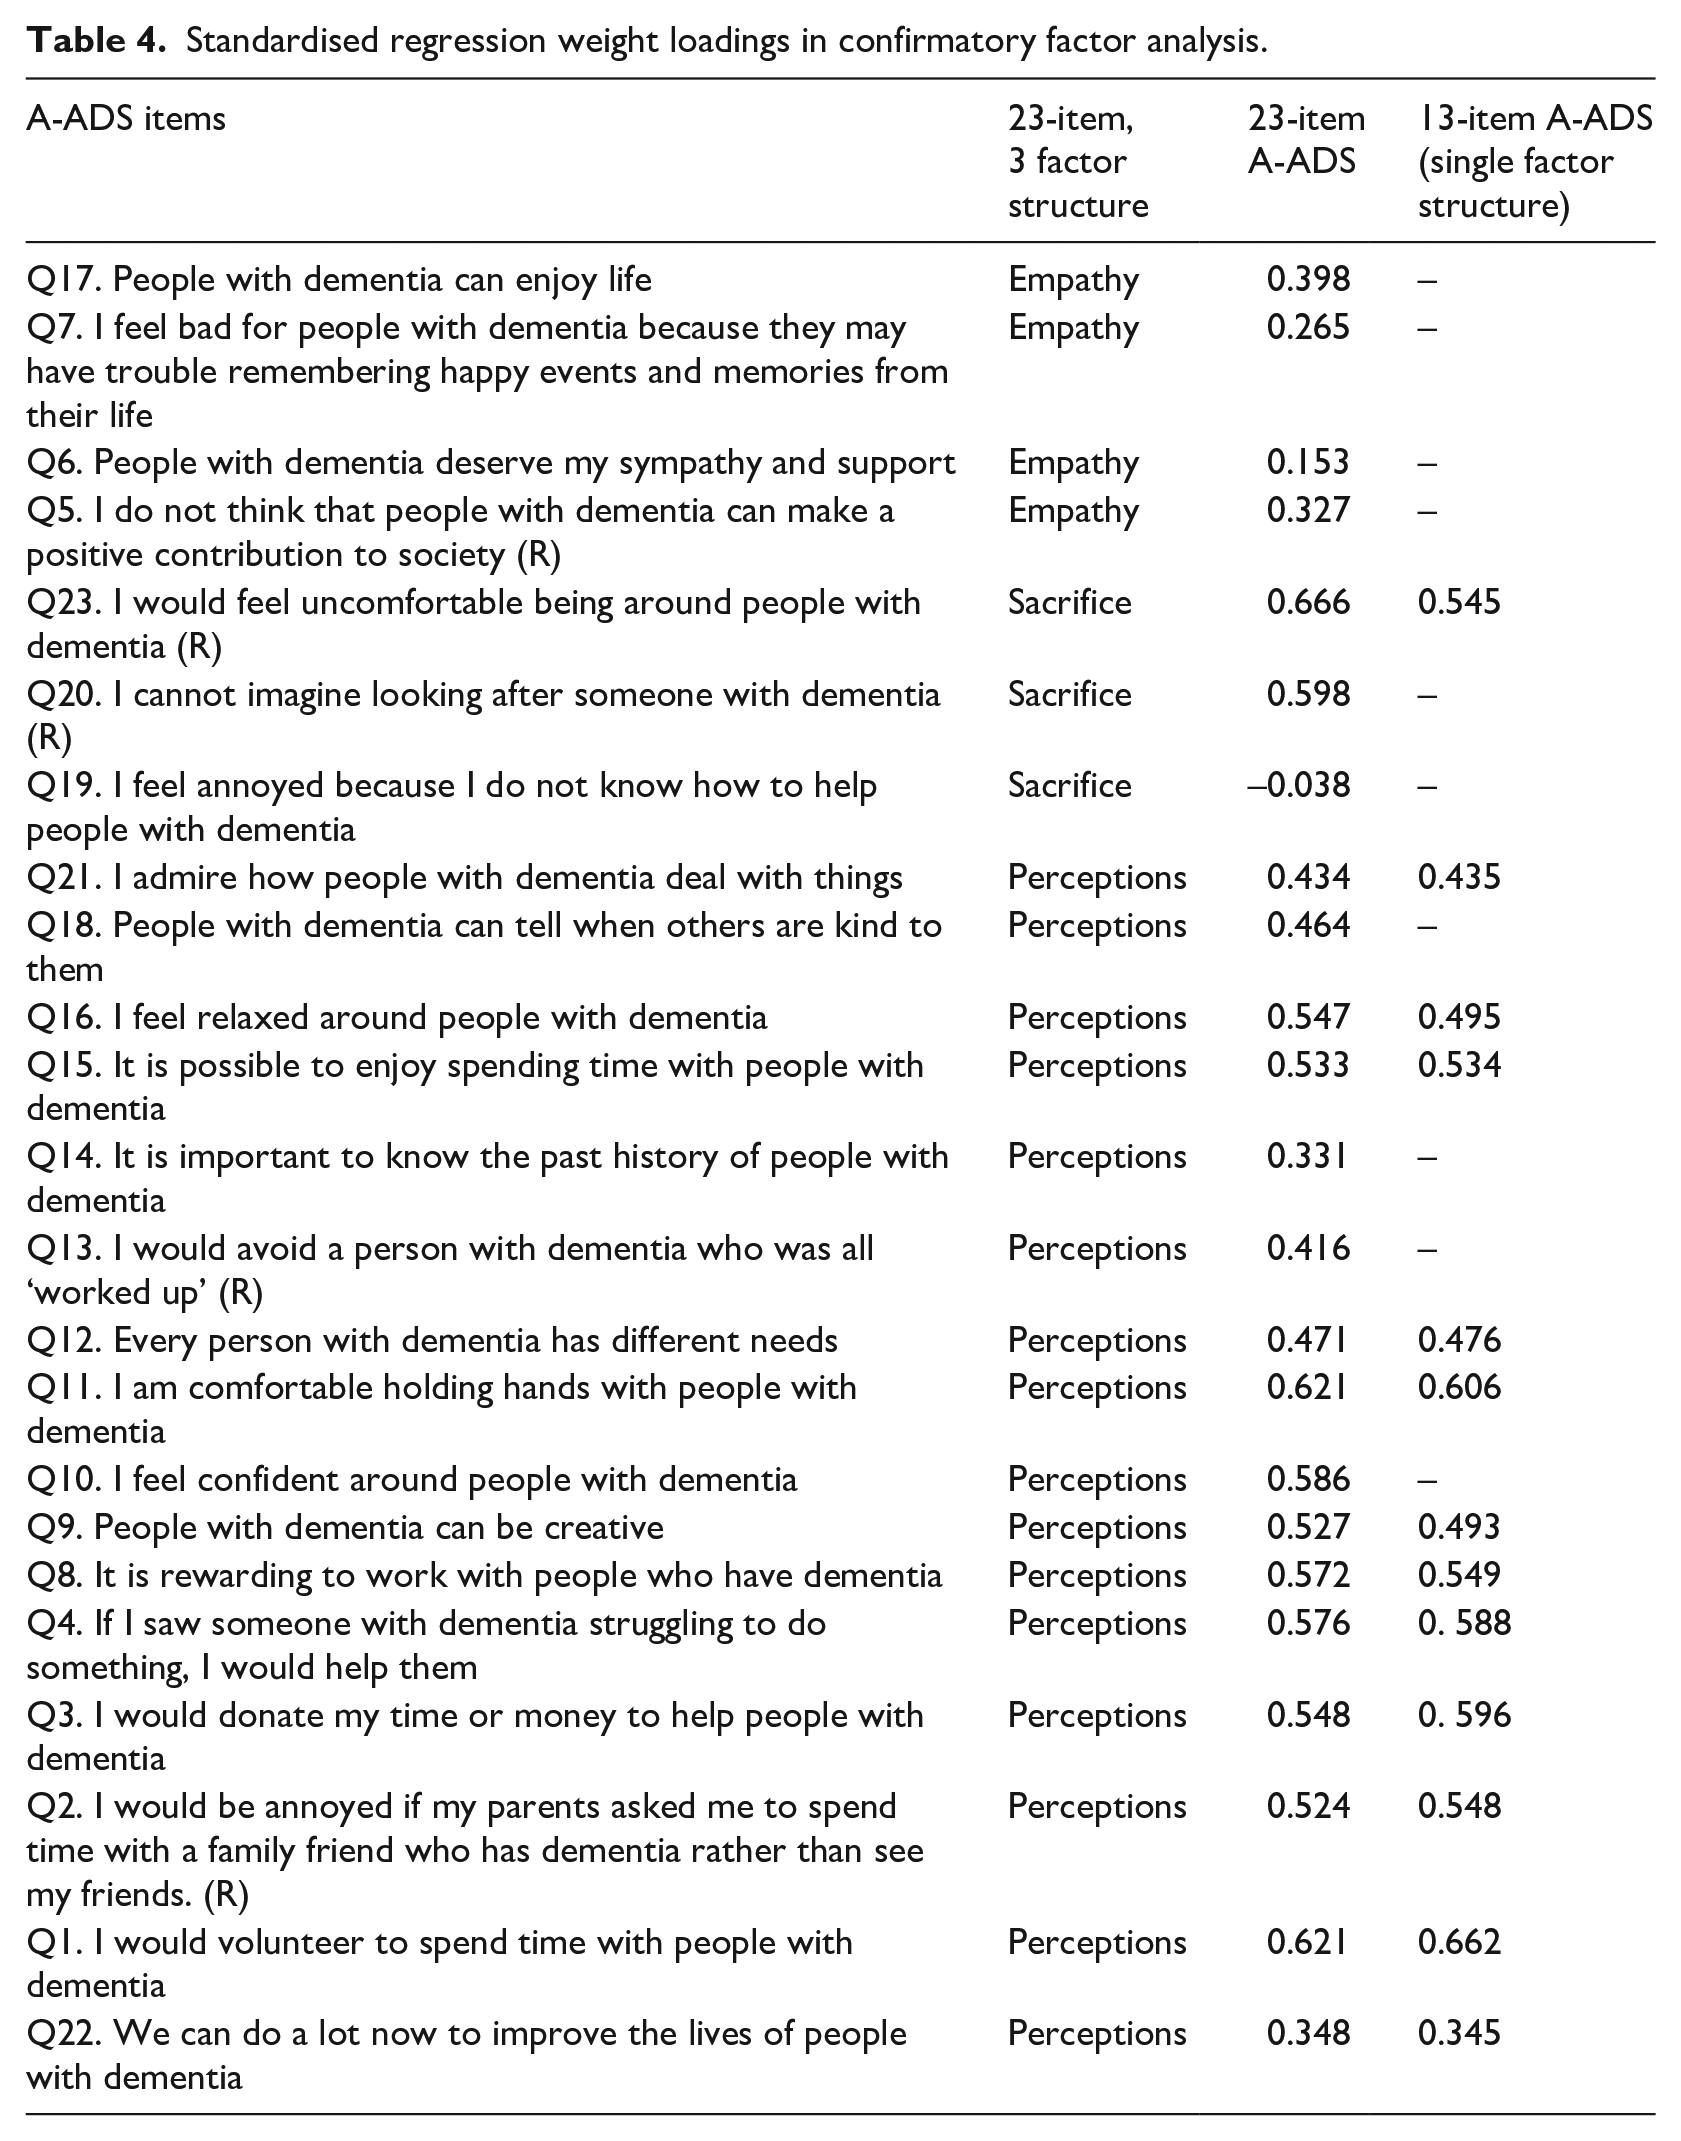
The 13-item A-ADS had a high internal consistency, α = 0.83 (95% CI, 0.81–0.86). Removal of any single item would not have improved the overall internal consistency. The 13-item A-ADS had good concurrent validity with the total Allophilia scale (r = 0.73, p < 0.001). The 13-item A-ADS also had good predictive validity, t = −6.34, p < 0.001.
In comparison, the 23-item A-ADS had good internal consistency (α = 0.85, 95% CI 0.83–0.87), good concurrent validity (r = 0.76, p < 0.001) and good predictive validity (t = −6.01, p < 0.001). The 23-item A-ADS had a very strong, positive association with the 13-item version of the A-ADS (r = 0.95, p < 0.001).
Readability
The 13-item A-ADS had the following readability scores; Dale-Chall Formula = 6.5, Gunning Fog = 10.3, The Coleman-Liau Index = 8.54 and Flesch-Kincaid Grade = 6.7. After converting to readability estimates in years, there was an average readability age of 14.0 across the four indices.
Discussion
The aim of the present study was to revalidate, and potentially refine the A-ADS to develop a brief measure of dementia attitudes in adolescents, enabling it to be practically used in a school setting.
The EFA revealed that there was there was a potential for a two and five factor solution (depending on the statistical approach) within the A-ADS. However, theoretically there was no common theme linking the items, and many cross-loaded with the first factor, as such a single factor structure was deemed as being a better fit with the data. The CFA demonstrated that the 13-item A-ADS had a satisfactory model fit, and was an improvement over the original 23-item A-ADS. The fact that the 13-item A-ADS was very strongly associated with the 23-item A-ADS provides evidence that ultimately the 13-item A-ADS (hence forth called the Brief A-ADS) optimises the original scale.
The Brief A-ADS questionnaire is composed of a single factor and has a high internal consistency in both subsamples (α = 0.83–0.88). It improves upon the internal consistency of the ‘perceptions’ factor of the original development paper (α = 0.61) (Griffiths et al., 2018), and improved on the internal consistency of the A-ADS as a whole (α = 0.69, self-calculated). The Brief A-ADS shifts from being a three factor to a single factor structure. Although such an approach was driven by a more conservative statistical approach compared to the original development paper, the improved model fit and maintained psychometric properties is sufficient evidence to consider the use of the Brief A-ADS over the original A-ADS. In shortening the A-ADS, it is also possible that we may reduce participant burden (Rolstad et al., 2011) and response fatigue (Lavrakas, 2008).
Whilst shorter questionnaires may result in better response rates (Rolstad et al., 2011), the availability of a short questionnaire may also promote adoption for those working with young people. Removing the items loading onto ‘empathy’ and ‘sacrifice’ in the A-ADS theoretically loses some of the complexity of attitudes towards dementia. However, it is important to consider how the Brief A-ADS still ties in with the wider attitude literature. First, the measure captures both positive and negative attitudes, which could be important if we consider that attitudes might not sit on a single bipolar dimension (Alfieri and Marta, 2011). Second, the measure captures elements of ‘public stigma’, such as ‘discrimination’ and ‘prejudice’ (Alzheimer’s Disease International, 2019; Rüsch et al., 2005). Lastly, there are several items that capture behavioural intention; and whilst the intention-behaviour gap is large (Sheeran and Webb, 2016), they do predict future behaviour (Sheeran, 2002). Irrespective, researchers should be vigilant that the Brief A-ADS may not capture all elements related to dementia attitudes or stigma.
One strength of this study is the sample size, having a larger sample size than the original development paper (n = 262) (Griffiths et al., 2018). The sample used for the EFA matched the 10:1 ratio in terms of sample size to number of items (Everitt, 1975). Admittedly the importance of meeting rule-of-thumb criteria has been discussed elsewhere (Hogarty et al., 2005; Williams et al., 2010).
It is important to acknowledge that when this study was conceptualised the A-ADS was the only validated questionnaire to capture dementia attitudes in adolescents. As such, Allophilia scale which was validate in adults (Kinney et al., 2017), is less than optimal to check for concurrent validity. Since this study was conceptualised, the KIDS has been developed and validated, capturing ‘Personhood’, ‘Stigma’ and ‘Dementia Understanding’ (Baker et al., 2017). The KIDS has a similar number of items (k = 14), internal consistency (ωt = 0.83) and measurement variance (CV = 14.88%) compared to the Brief A-ADS (Baker et al., 2017). However, unlike the A-ADS, KIDS was developed in Australian schoolchildren aged 10 to 12, potentially having implications on its applicability in the current sample. Early evidence indicates a moderate association between the KIDS and the Brief A-ADS (rs = 0.47–0.67) (Farina et al., 2020). Future research should compare the agreement between the two measures.
Within this current study, we adopted a split sampling approach, allowing us to capitalise on our large dataset. Such an approach, has been previously recommended (Anderson and Gerbing, 1988; Kyriazos, 2018). However, we should acknowledge the limitations of split-half sampling (Bandalos, 2017); not least because the two subsamples a likely to be very similar, therefore may not reflect the findings if the analysis was completed on two different samples. In fact, the findings are limited to a group of predominantly White British adolescents (aged 13–18), therefore until tested further, it unclear whether the Brief A-ADS validity in different settings and samples. This might include younger ages. The Brief A-ADS appears to have a readability appropriate for most adolescents (aged 14 years old). This does raise the possibility that the Brief A-ADS might be more difficult to read for those below this age, though anecdotally this did not appear to be the case in the 13 year olds within our sample. Another limitation of this research is the item reduction process used in the EFA. The creation of the Brief A-ADS was driven, in part, by looking at psychometric properties. Certain thresholds have been recommended previously (e.g. absolute difference <0.2 indicating large cross-loading; Ferguson and Cox, 1993), though strictly following such them could lead to different outcomes. Within this study we ensured that decisions were complimented by looking at underlying theoretical commonalities between items.
The Brief A-ADS contributes to a gap in the literature in terms of measuring dementia related stigma (Herrmann et al., 2018). Whilst there is no consensus about the ‘gold standard’ measure (Harper et al., 2019), particularly for a younger age group, providing transparent evidence of a measures development and validity is one step closer to achieve this. It should be acknowledged that there are some psychometric properties not reported here, most notably test-retest reliability and responsiveness. In addition, there is the need to understand the extent to which missing data effects the ability to score the Brief A-ADS. Therefore, there is scope for future research to continue the process of validating the Brief A-ADS.
Conclusion
The original A-ADS displayed good psychometric properties, however factor analysis reveals that by reducing the number of items, with a single factor structure provides a better fit. The Brief A-ADS is a short, standardised way of capturing attitudes towards dementia in adolescents. The initial test of validity and reliability of the Brief A-ADS has demonstrated that the scale effectively measures attitudes towards dementia amongst adolescents. The questionnaire could prove to be a useful tool in assessing attitude (and stigma) change in future dementia awareness initiatives aimed at adolescents, particularly in settings where participant time is limited, or large amounts of data are being collected. It is hoped that the development of this scale will lead to the greater use of validated scales within initiatives aimed at improving attitudes towards dementia. Notably, the Brief A-ADS has already been successfully used in one such initiative (Farina et al., 2020). Future validation of the Brief A-ADS would be useful, particularly when considering responsiveness and test-retest reliability, before its use more widely, particularly within longitudinal studies.
Supplemental Material
Appendix_A – Supplemental material for Measuring adolescent attitudes towards dementia: The revalidation and refinement of the A-ADS
Supplemental material, Appendix_A for Measuring adolescent attitudes towards dementia: The revalidation and refinement of the A-ADS by Nicolas Farina, Alys W Griffiths, Laura J Hughes and Sahdia Parveen in Journal of Health Psychology
Footnotes
Acknowledgements
Thank you to the secondary schools and adolescents that participated in the research. We are particularly appreciative of the staff within the schools who helped facilitate the research. The project was internally funded by the Centre for Dementia Studies, Brighton and Sussex Medical School.
Data availability statement
The data that support the findings of this study are available on reasonable request from the corresponding author. The data are not publicly available due to ethical restrictions, as consent was not obtained from participants to share data in this manner.
Declaration of conflicting interests
The author(s) declared no potential conflicts of interest with respect to the research, authorship, and/or publication of this article.
Funding
The author(s) received no financial support for the research, authorship, and/or publication of this article.
Sponsorship
Ethical approval and sponsorship was obtained from Brighton and Sussex Medical School.
Supplemental material
Supplemental material for this article is available online.
References
Supplementary Material
Please find the following supplemental material available below.
For Open Access articles published under a Creative Commons License, all supplemental material carries the same license as the article it is associated with.
For non-Open Access articles published, all supplemental material carries a non-exclusive license, and permission requests for re-use of supplemental material or any part of supplemental material shall be sent directly to the copyright owner as specified in the copyright notice associated with the article.