
Abstract
Social adversity events commonly occur in our daily lives. However, an individual’s perception of social adversity experienced may be more important than actual events in impacting an individual’s psychological functioning and reactions. In the current study, we examined how individuals’ perception of social adversity events they experienced is associated with their traumatic stress symptoms as well as mood and anxiety symptoms using the Bayesian network model. The findings indicated that individuals with a perception of social adversity events as traumatic and frequent showed an increase in the probability of displaying a high level of posttraumatic stress symptoms.
Keywords
Most individuals typically encounter adversities or stressors within their daily social interactions. While some can constructively manage stress, others may be psychologically bothered, leading to the most common mental disorders of anxiety and depression (Clark and Beck, 2010; Sartorius et al., 1996), in addition to fear or even suicide. According to Weinberger et al. (2018), depression prevalence increased significantly in the USA from 2005 to 2015, before and after controlling for demographics. Thus, one factor warranting further exploration is the etiological role of social adversities in mental distress. It is particularly fundamental to understand whether these daily feelings of stress can be perceived as traumatic and associated with posttraumatic stress symptoms as well as mood and anxiety symptoms.
In contrast to trauma as defined in the Diagnostic and Statistical Manual of Mental Disorders, fifth Edition (DSM-5), typical social adversities are less intense. However, these adversities can be very emotional and personal, which may, in turn, affect one’s sense of control and ability to cope with stress. According to the theory of capture proposed by Kessler (2015), our thoughts and behaviors become negatively captured by three essential elements: narrowing of attention, perceived lack of control, and change in emotional states. When an event captures our attention in a way that we perceive as negative and uncontrollable, it may change our behaviors. Although we often experience stress from social interaction that commands our attention, capture involves more than just typical attention. Capture alters our emotions by evoking memory, imagination, fear, or anger. For example, one may think that a person calling our name or saying things in a particular tone is not as it appears. Instead, it could indicate a criticism or personal slight, leaving us with a feeling of insecurity or anxiety, which becomes our predominant thought. This preoccupation of thought is an example of capture.
There are many examples of such capture situations in our daily lives, as indicated by Kessler (2015), all of which could potentially lead to significant psychological suffering. Previous studies have found that psychological maltreatment are related to posttraumatic stress symptoms (e.g. Caston and Frazier, 2013; Gilman et al., 2013; Hodgdon et al., 2019; McIlveen et al., 2019). Thus, viewing from the lens of the theory of capture, we expect that social adversity may overly focus attention on the negative perceptions of an event. When individuals experience social adversity events, they may interpret these events in a way that further reinforces their negative schema. This can result in feelings of helplessness, significantly altering their emotional state. Accordingly, capture may result in psychological response patterns, which impact their subsequent perception of life experiences.
In the current study, we hypothesized that social adversities and their corresponding perceptions (as frequent, traumatic, and distressing) are related to a complex system formed by posttraumatic stress symptoms and mood and anxiety symptoms. In order to deal with complex organizations of mutually interacting entities, we used Bayesian network analysis in the current study. Bayesian network is an effective machine learning method used to express uncertainty and probability reasoning of a system in the field of artificial intelligence (Castillo et al., 1997; Pearl, 1988, 2000). As indicated by Borsboom and Cramer (2013), the use of a directed causal graph in statistical analysis has greatly been advanced since the work of Pearl (2000). With a set of statistical assumptions, the Bayesian network can be considered the causal network structure by exploratively finding causal dependency and conditional independence from a set of observational data. Such an explorative approach allows us to build causal psychopathological models (Danks et al., 2010) to conduct bidirectional uncertainty analysis for prediction and diagnosis. Thus, in the current study a Bayesian network model is formulated concerning social adversity and its correlates, and then Bayesian network learning process and posterior probability reasoning are conducted to examine this complex psychological network.
Method
Participants
This study was part of a larger research project concerning the effects of perception of social adversity events on individuals’ psychosocial adaptation. The current sample consisted of 478 adults recruited online from several communities in Northeast China. Participants were provided a link to the online software program Survey Monkey and asked to voluntarily complete the survey. The study obtained the university research committee approval before data collection.
The age of the participants ranged from 20 to 63 (M = 30.27, SD = 7.46) and 42% were males. Among them, 19% had an education of high school or below, 61% had a college education, and 20% had post-college education. Most of the participants reported having a job (74%), 18% reported to being students, and 8% reported being unemployed.
Measures
Perceived Chronic Social Adversity Scale-Revised
Perceived social adversity events were assessed using the Perceived Chronic Social Adversity Scale-Revised (PCSAS-R), which consists of 30 items that assess social adversity events that are commonly experienced in daily life (see Supplemental Appendix A). Four different aspects of each social adversity event were assessed: (a) whether an event occurred (0 = no, 1 = yes); (b) perceived level of distress caused by the event (i.e. event distress on a scale of 1 = not distressed to 5 = very much distressed); (c) whether the event was perceived to occur frequently (i.e. chronicity on a scale of 0 = do not feel it happens frequently and 1 = feel it happens frequently); and (d) whether the event felt traumatic (i.e. traumaticity on a scale of 0 = do not feel it to be traumatic and 1 = feel it to be traumatic). Based on the response to these items, we computed three scores for (1) event occurrence, (2) event chronicity, and (3) event traumaticity. These three scores (each ranging from 0 to 30) serve as an index of each individual’s experiences. A high total score would reflect a higher level of (1) events experienced, (2) event chronicity, and (3) event traumaticity.
We also calculated the average score for “felt distressed” across all items (i.e. event distress), with scores ranging from 1 to 5. A high score indicated greater distress by adversity events experienced.
PTSD Checklist for DSM-5 (PCL-5) (Weathers et al., 2013). The PCL-5 is a 20-item self-report measure that assesses the four types of DSM-5 PTSD symptoms: intrusion (e.g. repeated, disturbing, and unwanted memories of the stressful experience); avoidance behavior (e.g. avoiding memories, thoughts, or feelings related to the stressful experience); negative alterations in cognitions and mood (e.g. having strong negative beliefs about yourself, other people, or the world); and alterations in arousal and reactivity (i.e. irritable behavior, angry outbursts, or acting aggressively). Participants rated each item on a 4-point scale, with scores ranging from 0 (not at all) to 4 (extremely). In this study, Cronbach’s alpha was 0.86, 0.84, 0.90, and 0.89, respectively for the four subscales. An average score was calculated for each subscale, with a high score indicating a higher level of PTSD symptoms.
Shapiro control inventory (SCI) (Shapiro, 1994). The SCI is a test that provides a multi-dimensional control profile of an individual. It has nine subscales; however, the current study used only General Domain Negative Sense of Control (5 items) to measure individual perceived controllability. Cronbach’s alpha for negative sense of control scales were 0.79 in the current sample.
Short adaptation of the mood and anxiety symptoms questionnaire (MASQ-D30) (Wardenaar et al., 2010). In the current study, we used the MASQ-D30, which is more suitable for large-scale psychopathology research. The MASQ-D30 has three subscales: General Distress (10 items), Anxious Arousal (10 items), and Anhedonic Depression (10 items). Items are rated on a 4-point scale, from 1 (not at all) to 4 (always). An average score was calculated for each subscale, with a high score indicating a higher level of mood and anxiety symptoms. In this study, Cronbach’s alpha was 0.81, 0.80, and 0.79, respectively, for the three subscales.
Analysis: Bayesian network model
Basic concepts
The Bayesian network is an interface of graphical models and statistics for causal interactions among a set of variables, and it is a well-studied statistical tool for examining causal dependency using graphical models (Pearl, 1988). In the graphical model, the variables are represented as nodes. The relationships among nodes are represented as a directed link using edges to indicate dependence and conditional independence in the data. Specifically, Bayesian networks (Pearl, 2000) are directed acyclic graphs (DAG) and are widely used for knowledge modeling under uncertainty (e.g. Friedman et al., 2000; Lauría and Duchessi, 2006; Sun and Shenoy, 2007) based on the fact that the joint probability distributions in the conditional probability table can be naturally described in graphical terms with nodes and edges.
Bayesian networks can be viewed as representation of fuzzy causal-effect rules that can perform deductive (or causal), adductive (or diagnostic), and inter-causal (or explaining away) reasoning (Kjærulff and Madsen, 2005). Figure 1 shows a hypothetical example of Bayesian networks. As shown in Figure 1, if a person has reported feeling helpless, one can conclude with high probability that she also feels depressed and irritable (causal reasoning). Observing she is irritable provides evidence with high probability for either “felt helpless” or “loss of control” as a potential diagnosis. However, if feeling depressed leads to the assumption of “felt helpless” as the cause of feeling irritable, this reduces the belief that losing control is the cause of “felt irritable” (inter-causal reasoning). The importance of inter-causal reasoning of Bayesian networks is its ability to make inferences that support one or a set of hypotheses but reduce beliefs in competing hypotheses. This property is referred to as the explaining away in the Bayesian networks literature.
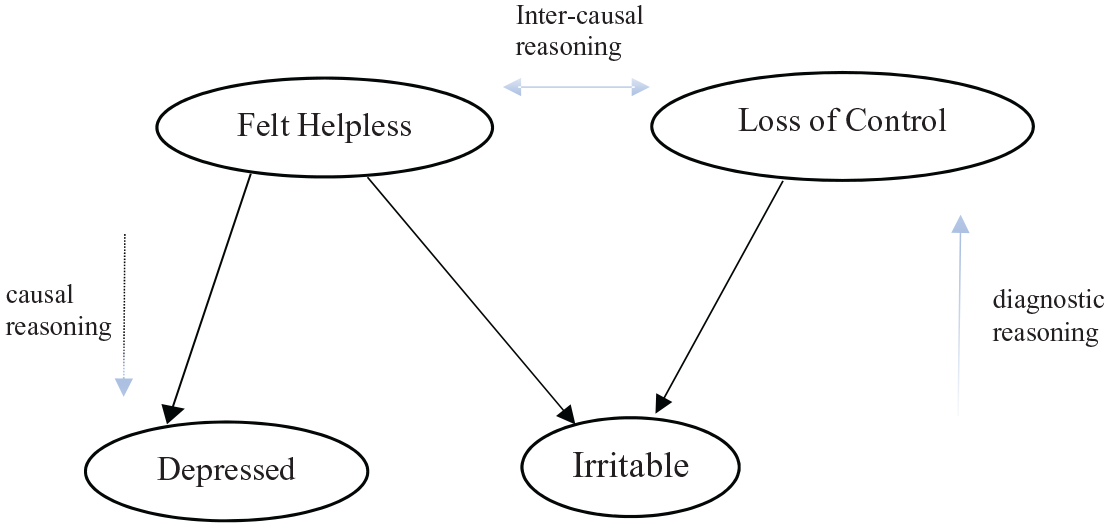
Bayesian networks with deductive (causal), adductive (diagnostic), and inter-causal (explaining away) reasoning.
Construction of a Bayesian network
The theory of learning networks from data has been extensively examined in the literature (e.g. Heckerman, 1998). Construction of a Bayesian network involves two major steps: structure learning and parameter learning. These two steps are briefly described below due to the space limit. To better understand Bayesian network, it is best to consult references such as Korb and Nicholson (2010), Russell and Norvig (2009), Friedman et al. (1997), or Neapolitan (2004).
Structure learning
During structure learning, the dependency is determined among the nodes to construct a DAG. Three approaches can be used for this purpose. The first is to use expert experience and prior knowledge. The second is through learning of sample data, which automatically acquire the network structure through use of a machine learning algorithm. The third is to combine both expert experience and machine learning to determine the effective network.
Typically, a machine learning algorithm is used to find an optimal structure based on a search-and-score algorithm, which performs a search of all possible structures from observed data. During Bayesian structure learning, the purpose is to find the maximum likelihood Bayesian structure, which is the network that is the most likely given the data. However, due to the fact that the nature of many scoring functions is such that several different network structures may have equal scores (Chickering, 1995), it makes more sense to refer to an optimal network as “a best” instead of “the best.” Whenever “a best” network is determined, it does not matter which one is selected since the end result will still be a best network (Silander and Myllymaki, 2006).
Parameter learning
For a given Bayesian network structure, parameter learning determines the conditional probability table (CPT) at each node of the network model. Learning algorithms include expectation-maximization or gradient descent (Dempster et al., 1977; Lauritzen, 1995).
Model evaluation
Model evaluation can be completed through sensitivity analysis, which is the analysis of the influence of multiple causes (i.e. variables involved) on outcomes (i.e. target variables) (Castillo et al., 1997; Kjærulff and van der Gaag, 2000) by examining the effect of a small change in probability of potential sensitive factors on the posterior probability of the target node. One such algorithm is proposed by Kjærulff and van der Gaag (2000), in which sensitivity of a node is quantified by sensitivity index (SI) to provide an indication of importance of precision of probability parameters in the network for calculating the posterior probabilities of the target nodes. If the derivative is large for a probability p, then a small change in p may lead to a large change in the posteriors of the targets. If the derivative is small, then even the large changes in p make little difference in the posterior probabilities of the target nodes. In this way, the sensitivity analysis function can be used to identify which variables have relatively greater contribution to the posterior probabilities of the outcome events such as traumatic stress symptoms.
A second way to evaluate model fit is to assess predication accuracy via K-fold cross validation, in which the data are divided into K parts, the network structure is trained on K − 1 parts, and tested on the last Kth part. This process is repeated K times, with a different part of the data for testing. Next, the confusion matrix and receiver operating characteristic (ROC) curve can be examined. Typically, the ROC curve assumes that the outcome events or variables to be binary. When the outcome variables are not binary, they can be changed to binary by taking a state of interest and lumping all of the other states into the complement of that state.
Inferential analysis and assessing most likely configuration
In the Bayesian network model, one can examine the most likely configuration of a set of child nodes (i.e. outcome states) given evidence or observations of a set of parent nodes (i.e. a precedent state). According to the literature, this is often called maximum a posteriori probability (MAP) (e.g. Neapolitan, 2004; Yuan et al., 2004). To solve the MAP, different algorithms can be used. For example, the annealed MAP algorithm finds MAP by means of an approximate optimization procedure of simulated annealing and it works well in practice (Yuan et al., 2004).
Analysis process in the current study
For the current analysis, we conducted both structure and parameter learning. We then assessed model accuracy and most likely configuration based on outcome events for a set of given precedents. Before structure learning, discretization of all variables was processed. Specifically, conditional probability may work best with discrete variables due to computational complexity. Sun and Shenoy (2007) indicated that the discrete variables with binary and three-values usually result in best performance of prediction in Bayesian network. Therefore, in this study we discretized the variable number of events perceived as frequent, in binary state of low (= eight or less than eight events) and high (= more than eight events) and all the other variables in a three-value discrete state based on the score distribution, with scores in the bottom 30% qualified as low, the middle 30% to 40% as medium, and the top 30% scores as high The Bayesian network analysis was conducted using software GeNIe version 2.5 (BayesFusion, LLC).
Results
Structure and parameter learning
For structure learning, the method of combining the Greedy Thick Thinning algorithm (GTT) (Cheng et al., 1997) and previous knowledge is used to formulate the Bayesian network structure. The GTT algorithm first begins with a graph based on the prior knowledge and repeatedly adds and removes the edge until no edge deletion results in a positive increase in the marginal likelihood of data. The GTT algorithm in this study yielded an acyclic directed graph that had the maximum score, which was proportional to the probability of the data given the structure (see Figure 2). Based on this network structure, we conducted parameter learning with the EM algorithm, obtaining the conditional probability distribution of nodes. Figure 2 shows the final Bayesian network model with 12 nodes (i.e. variables) and corresponding edges that indicated the dependency among them.
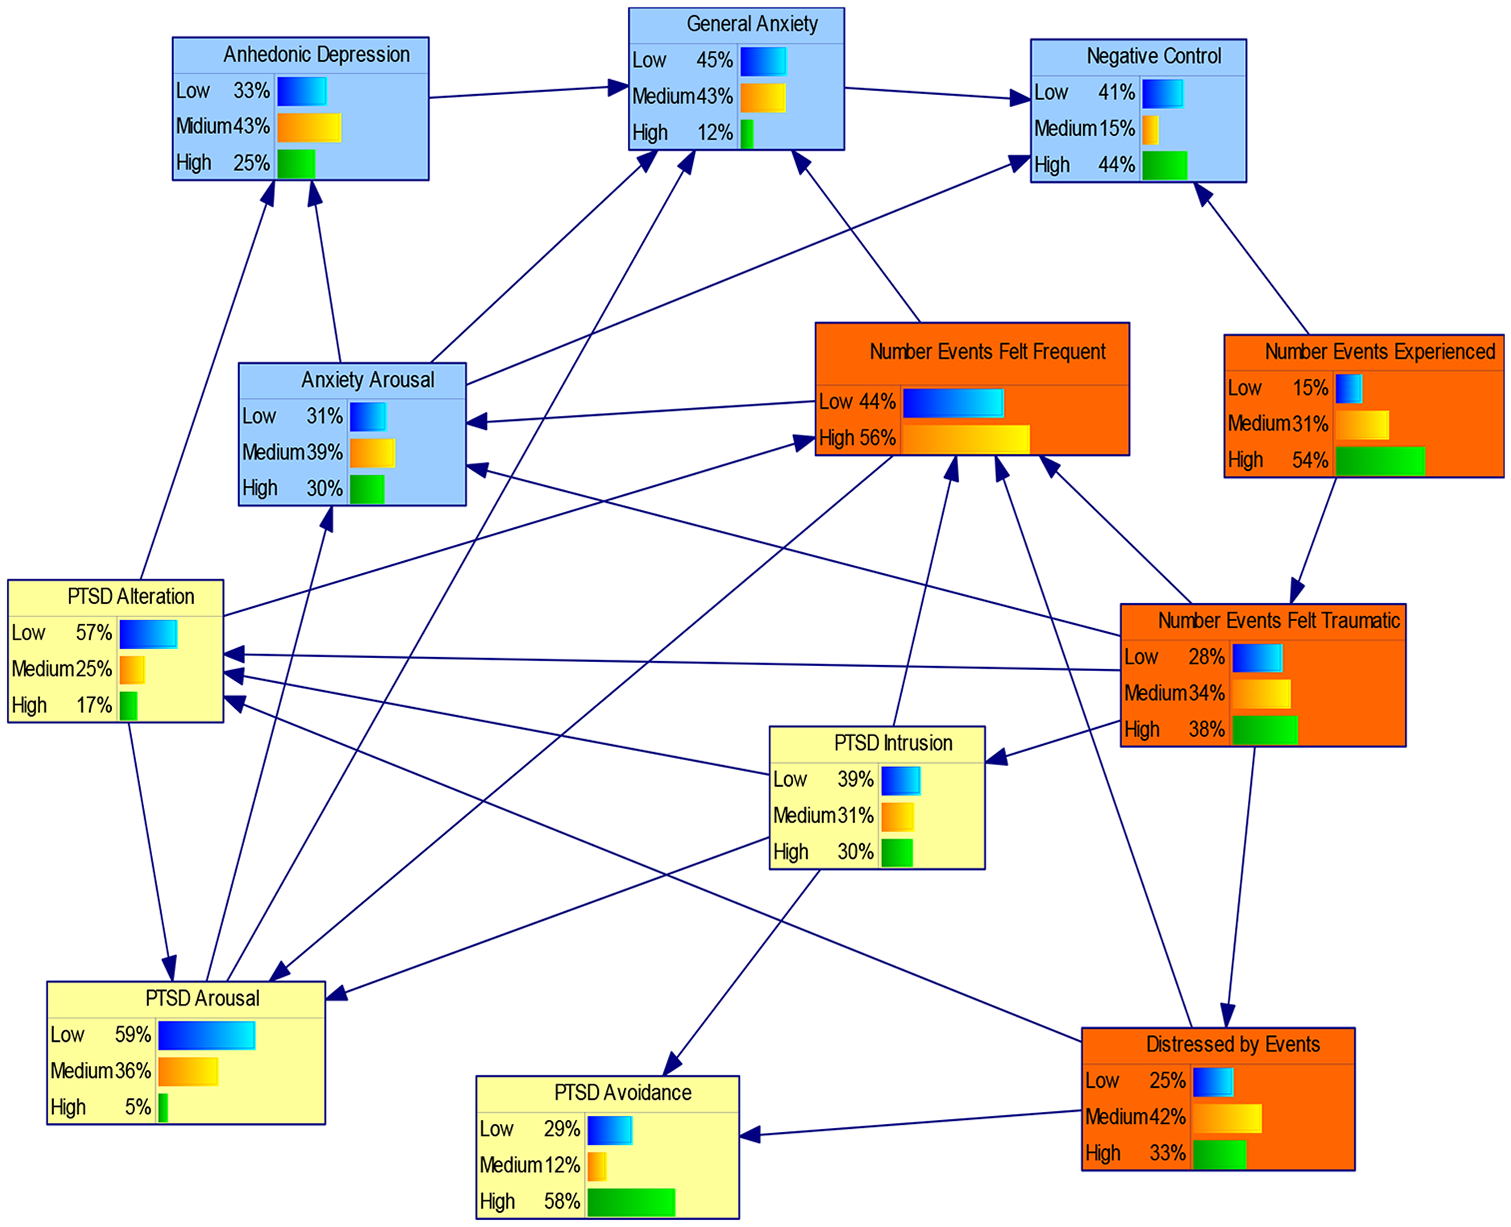
The Bayesian network model of social adversity and its correlates after structure and parameter learning. It shows a quite complex structure. The orange-colored nodes indicate social adversity events and their perception, yellow-colored nodes indicate PTSD symptoms, and blue-colored nodes indicate mood and anxiety symptoms.
As shown in Figure 2, the relationships among these nodes were quite complex. There are three types of nodes depicted in the figure: nodes related to social adversity, PTSD symptoms, and mood and anxiety. First, for the nodes related to social adversity, “number of events experienced” impacts individuals’ perception of “number of events felt traumatic,” which impacts reported “distressed by events” and “number of events felt frequent.” These perceptions in turn impact reported PTSD symptoms and mood and anxiety symptoms. For example, on one hand, node “number of events felt frequent” may influence symptom of “general anxiety,” “anxiety arousal,” and “PTSD arousal”; but on the other hand, it may also be influenced by “PTSD alteration” and “PTSD intrusion.” This might suggest that if individuals perceived the social adversity events to occur frequently, it may lead to anxiety and heightened arousal state. However, individuals’ perception of event occurrence frequency may also be influenced by “PTSD alteration,” “PTSD intrusion,” and “distressed by events,” all of which are influenced by “number of events felt traumatic.” The interactional hierarchical relationship of nodes can be fully modeled within the Bayesian network.
Another interesting finding to note is how PTSD symptoms manifested in the participants. It appeared that PTSD intrusion was a gateway that led to other PTSD symptoms such as avoidance, arousal, and alteration. In addition, anxiety arousal seemed to influence other mood symptoms such as anhedonic depression, general anxiety, and negative control. Both anxiety arousal and PTSD intrusion were influenced by “number of events felt traumatic.” Therefore, it seemed that a major pathway from social adversity to psychological distress was from “felt traumatic” to “PTSD instruction” and “anxiety arousal” to other symptoms.
Model validation and calibration
Sensitivity analysis
After the K-fold method was used to validate the parameter learning and predication accuracy of the Bayesian network model, we performed a sensitivity analysis. In order to invoke sensitivity analysis algorithm, we needed to define a target node or a set of target nodes. For example, when node “PTSD alteration” was set as a target node, Figure 3a shows nodes colored in red containing parameters that were important for calculating the posterior probability distribution of the target node of “PTSD alteration.” In contrast, gray-colored nodes did not contain any probability parameters that were used in the calculation of the posterior probability distribution of the target variable of PTSD alteration. Therefore, the sensitivity of any these parameters was zero. In the current case, the most sensitive factor was “PTSD intrusion” with sensitivity index (SI) being 0.20, followed by “number events felt traumatic” with SI being 0.12, “number events experienced” with SI being 0.097, and “distressed by events” with SI being 0.067.
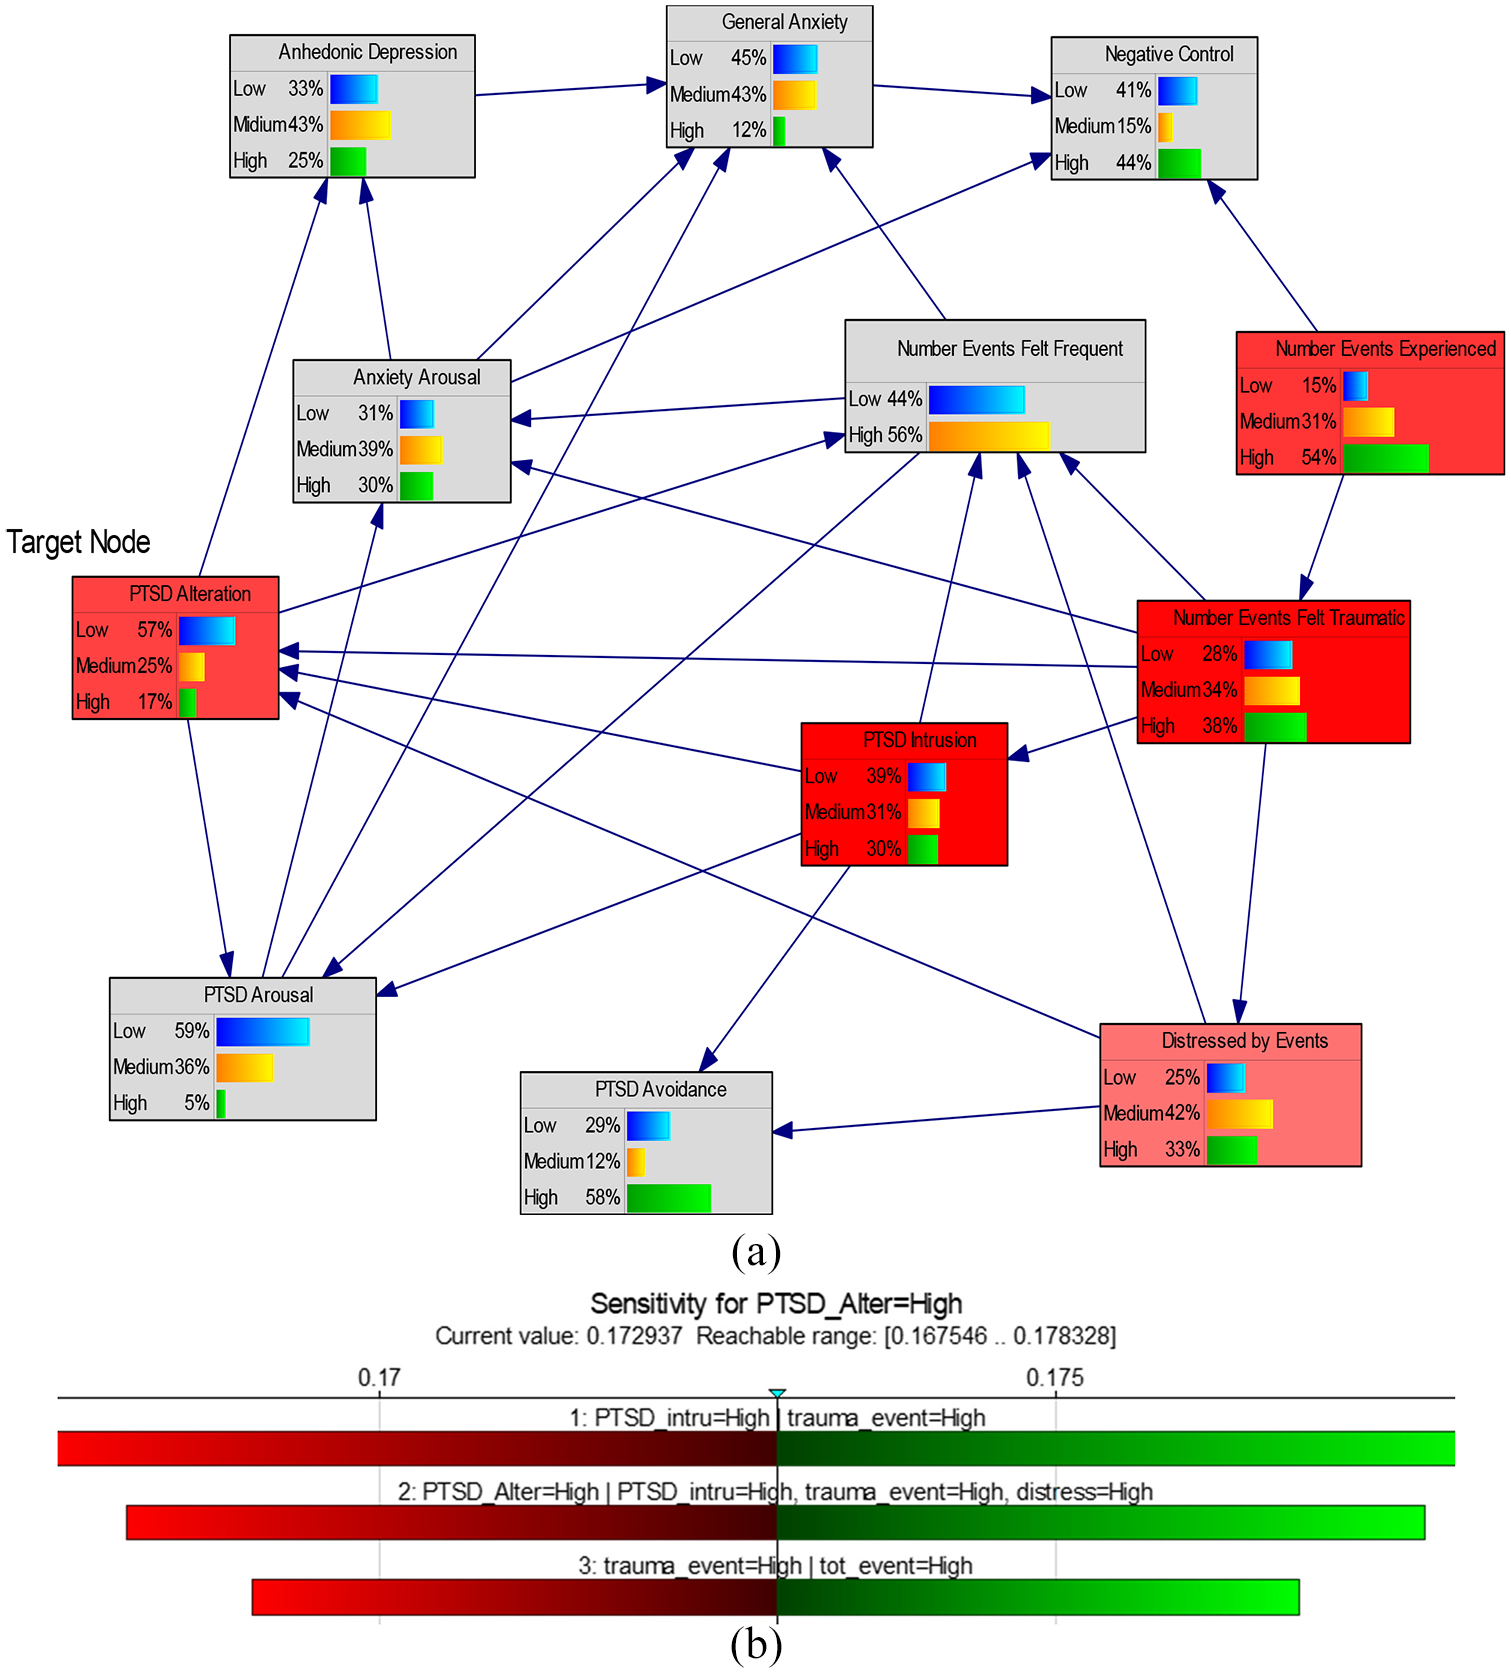
Sensitive factors with respect to (a) PTSD alteration as target node, (b) most sensitive parameters for calculating posterior probability distribution of the target variable. Specifically, Figure 3b portrays results of sensitivity analysis on the probability of the PTSD alteration at a high level. The horizontal bars indicate absolute change to that probability as individual parameters’ probabilities change (in this analysis by ±10%). The bar width indicates magnitude of change, for instance, the widest bar shows the maximum sensitivity to the high level of PTSD intrusion (bar 1). The red/green pair of the bar indicates the probability of high level PTSD alteration is increased as PTSD intrusion = high probability increases).
Figure 3b provides more detailed results of the sensitivity analysis. The most sensitive parameters for a selected state of the target variable are pictured. In this case, for instance, when we selected “high” state of the target node “PTSD alteration,” the figure showed the first three most sensitive parameters. The bar in the figure shows the range of changes in the target state as the parameter changes in its range (in this case ±10% of its current value). The color of the bar shows the direction of the change in the target state, and red/green pair represents increase in probability. As shown in Figure 3b, the most sensitive parameters that impact the increase in probability of “high” state of PTSD alteration are a high state of “event perceived as traumatic,” “PTSD intrusion,” “felt distressed,” and “events experienced.”
The findings of the sensitivity analysis suggest that individuals who had high level of these experiences are most likely to experience high level of PTSD alteration symptoms. Although the space limit did not allow us to show the results related to other possible target nodes, it is important to note that nodes related to social adversity events and their perceptions are, to various degrees, sensitive factors when different PTSD symptoms or mood and anxiety symptoms are target variables.
Model fitting and prediction
For model evaluation, the target node was set as the evidence variable to conduct model fitting and prediction. We selected four target variables as an example due to the large amount of data. The four target variables were: anxiety arousal, general anxiety, PTSD alteration, and PTSD arousal. The predication accuracy of these four target nodes was 0.72, 0.67, 0.72, and 0.72, respectively. Figure 4 shows the ROC curve of each state for these four target nodes. These ROC curves display the good degree of prediction accuracy for the low and high state level of each target node and fair accuracy for the middle state level of those nodes; this suggests that the current Bayesian network model has both fitting accuracy and high prediction accuracy. Therefore, it is feasible to use the Bayesian network model to conduct inferential analysis of social adversity variables on their correlates.
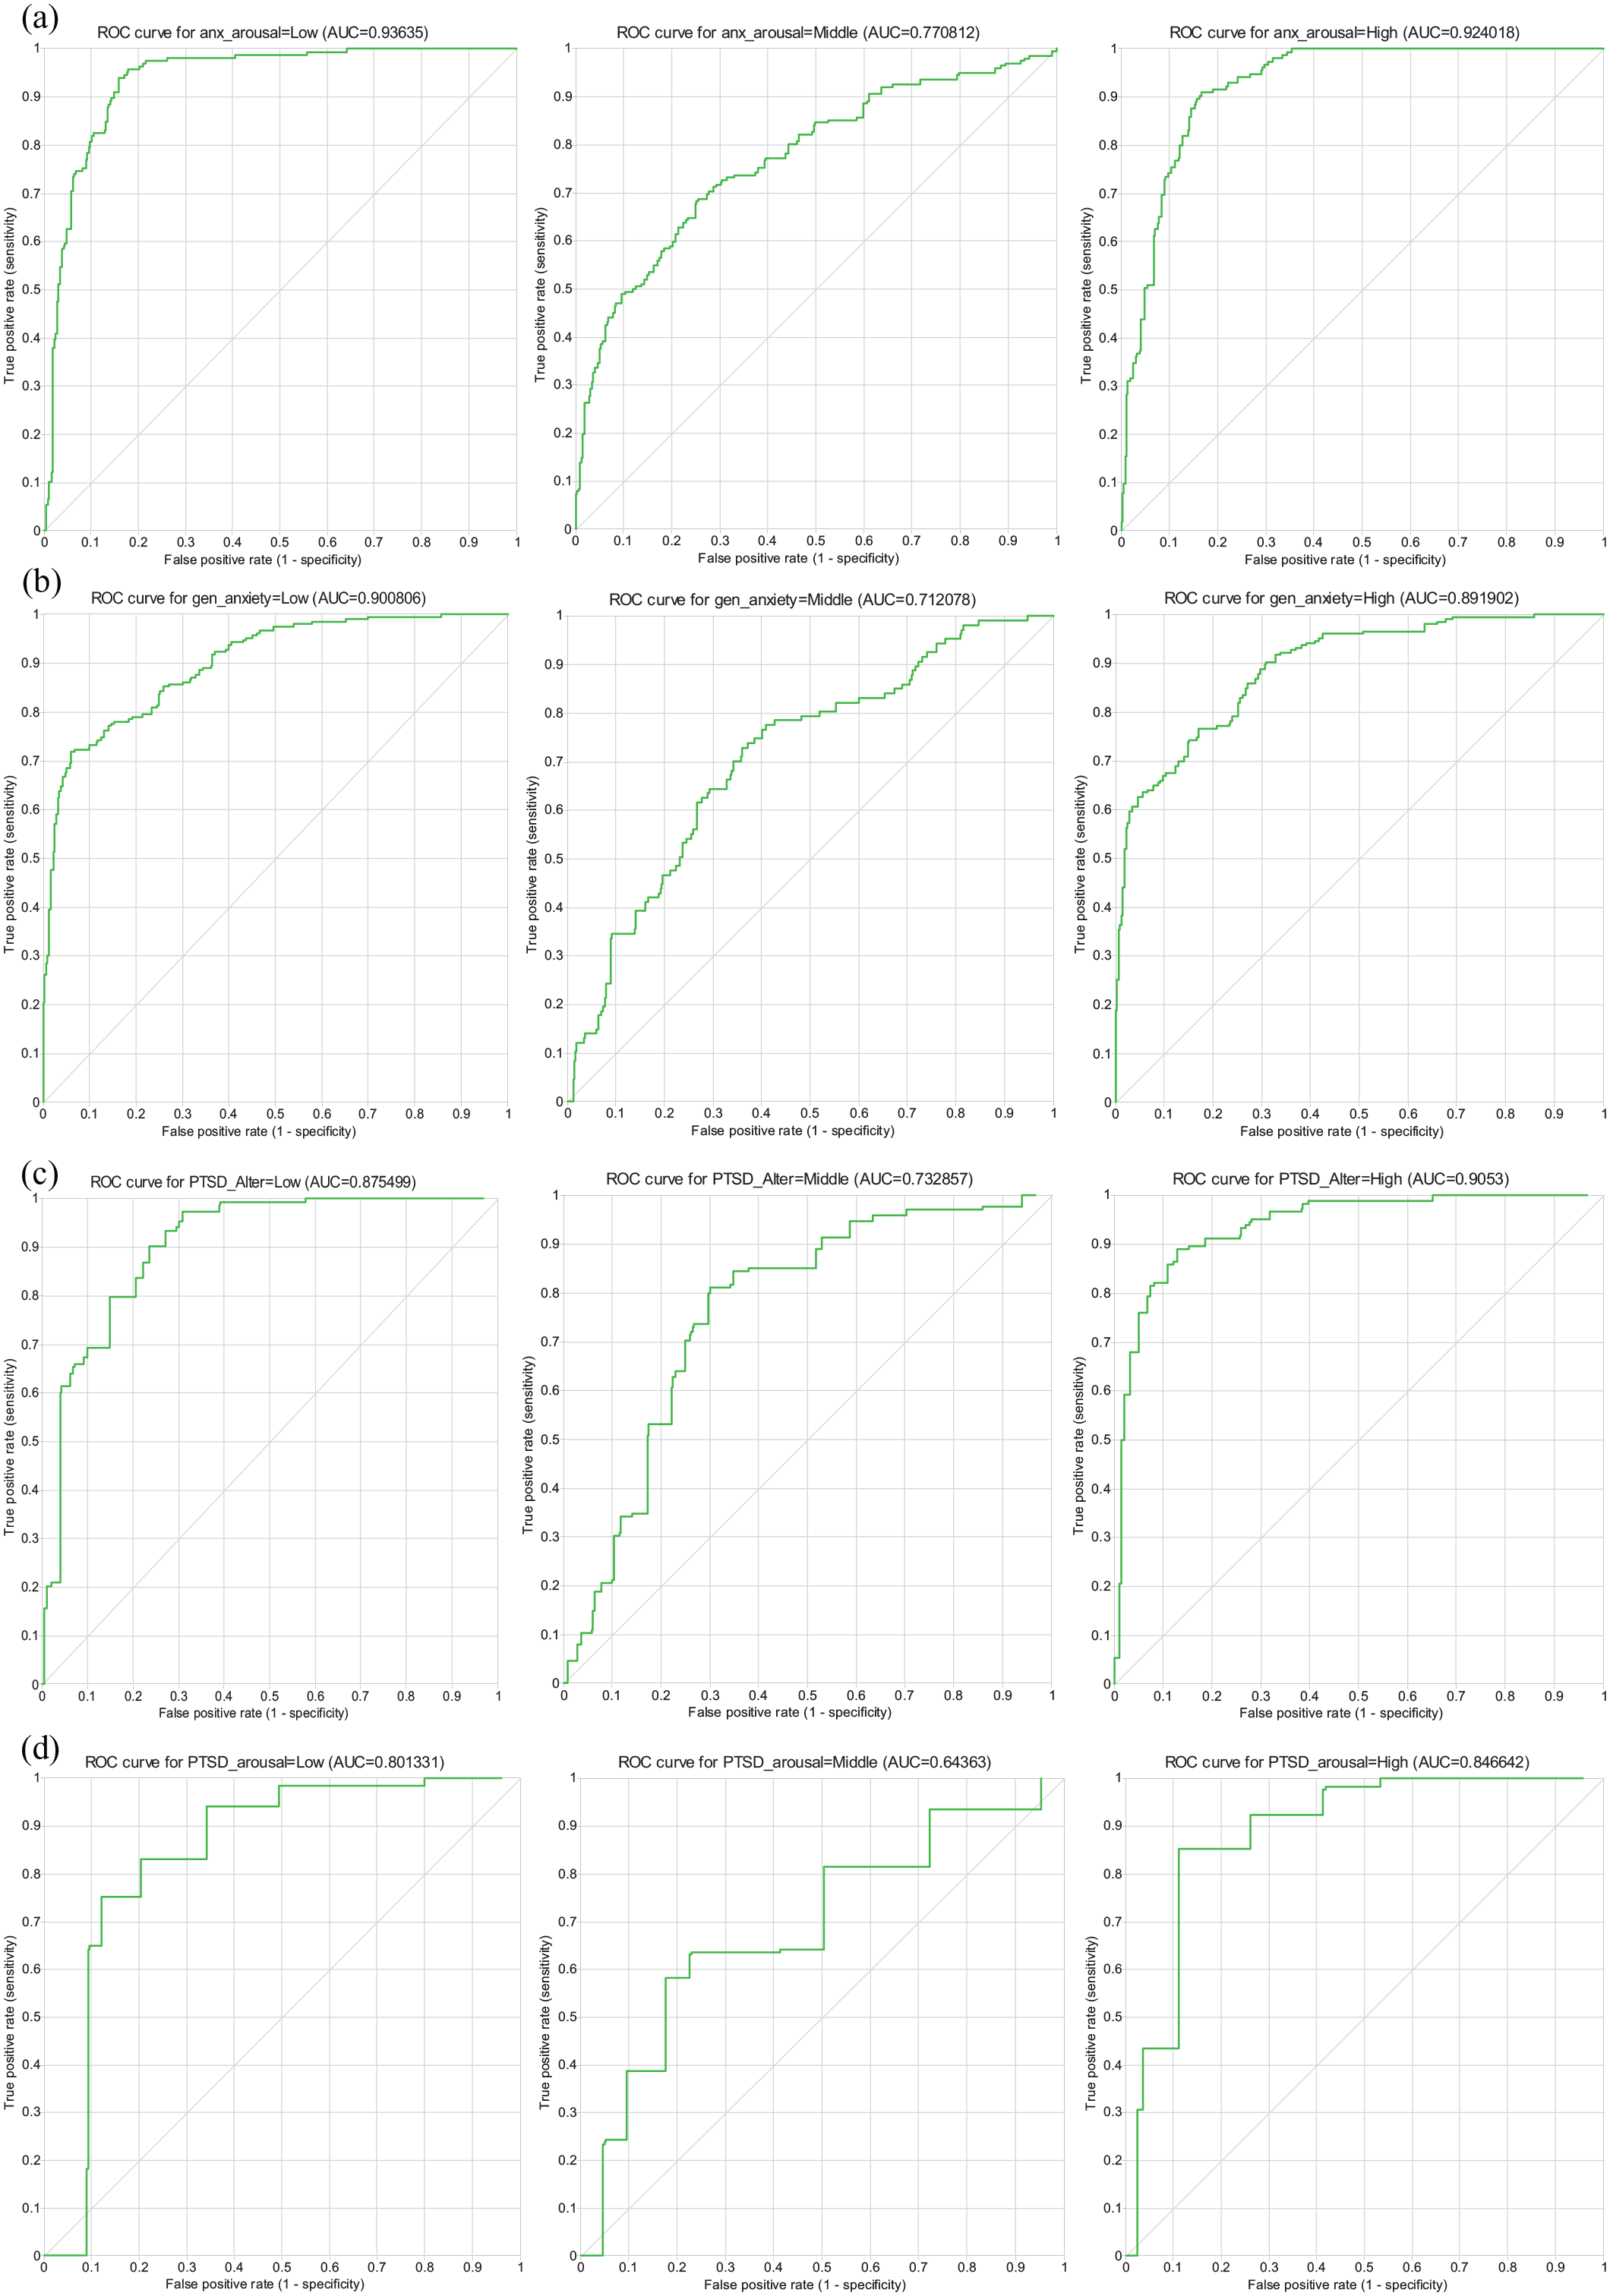
ROC curve of each state for (a) anxiety arousal, (b) general anxiety, (c) PTSD alteration, and (d) PTSD arousal.
Posterior probability reasoning
The Bayesian network model can be used to conduct probability causal reasoning, including diagnosis and predicting the posterior probability of state for a given nodes after specific evidence of a specific source nodes are provided. The posterior probabilities in inferring the results from cause and inferring the cause from result are often referred to as prediction and causal inference, respectively.
Predicting
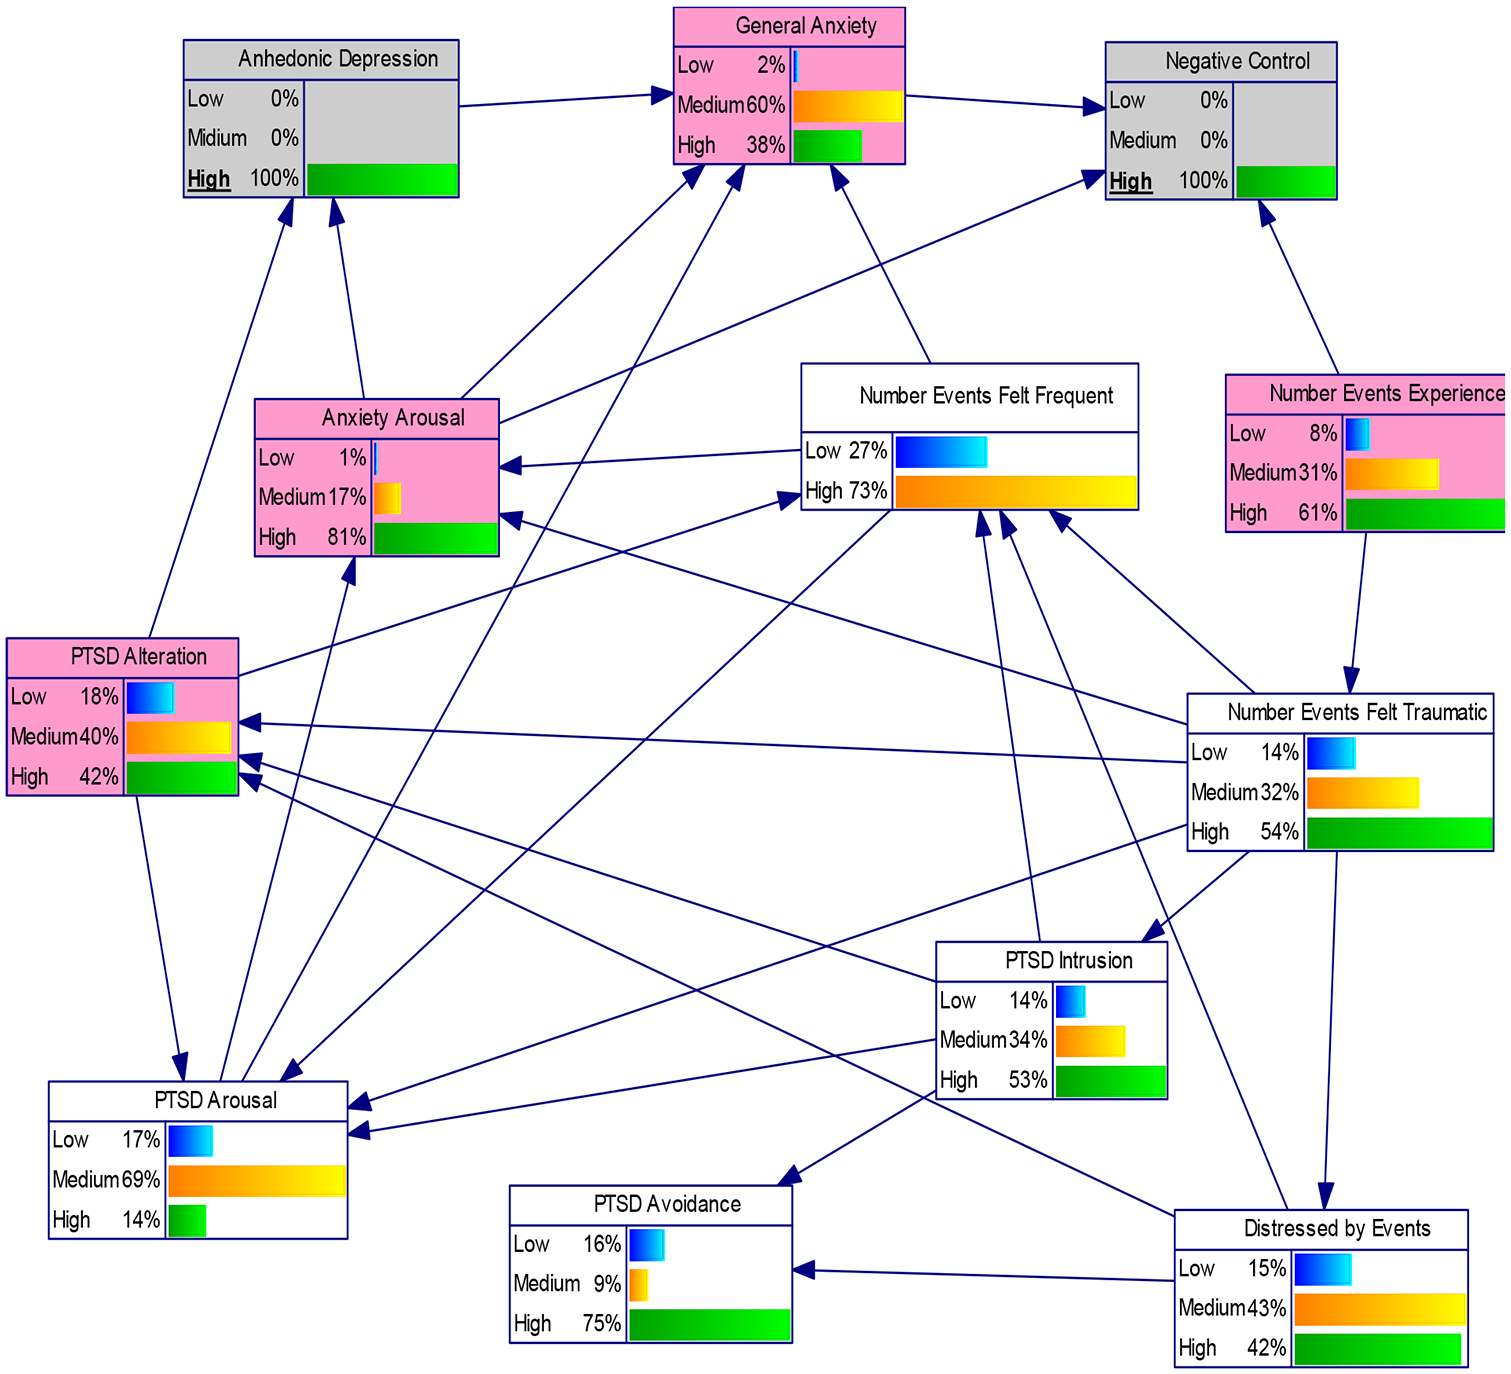
In Bayesian network, we can input the evidence of a particular node (i.e. evidence variable) so that it becomes a problem to solve the posterior probabilities of other nodes, with the known status of the evidence variables. For instance, Figure 5 displays the influence of “number of events felt traumatic” on other nodes. In this case, we set the statuses of evidence node “number of events felt traumatic” as 100% (gray colored node); that is, the statuses of the evidence variables are determined. Next, we updated posterior probabilities of the whole network to be observed. In Figure 5, we highlighted relevant nodes (purple colored) with the probability change of 5% or more in high status level. The change in posterior probability of these nodes ranged between 5% and 28%, with a medium of 12%. As an example, the probability of general anxiety is found to increase from 12% to 17%, negative control from 44% to 56%, PTSD alteration from 17% to 27%, PTSD avoidance from 58% to 72%, PTSD intrusion from 29% to 46%, anxiety arousal from 30% to 42%, and anhedonic depression from 24% to 34%. These increases in posterior probability of high level given the evidence seemed to suggest that “number events felt traumatic” had predictive power of those psychological distresses, which is consistent with literature of trauma events on psychological functioning. In addition, it is also interesting to note that posterior probability of high status level for nodes “number events felt frequent” and “felt distressed by the events” also increased from 55% to 72% and from 32% to 60%, respectively. This suggests that high levels of distress and number of adversity events felt frequent are also influenced by social adversity perceived as traumatic, which in turn is influenced by number of events experienced (posterior probability increased from 54% to 66%).

Predication for psychological distress symptom (purple-colored nodes) when the evidence variable “number of events felt traumatic” (gray-colored node) is set to be “high.”
Causal inference
Another important aspect of posterior probability reasoning is diagnosis of cause given a symptom. The bidirectional reasoning technology of the Bayesian network can calculate not only the posterior probability of symptoms given a cause (number of events felt traumatic in this case), as shown in Figure 5, but also the posterior probabilities of cause given the evidence of the symptoms. For example, as shown in Figure 6, after we input the evidence of high level to be 100% for nodes “negative control” and “anhedonic depression” (gray colored), the posterior probability in high level for node “anxiety arousal” increased from 30% to 72%, increased from 17% to 41% for node “PTSD alteration,” increased from 12% to 34% for node “general anxiety,” and increased from 53% to 57% for node “number of events experienced,” respectively (purple colored). This suggests that, in absence of other evidence, the most probable direct cause to “anhedonic depression” might be “anxiety arousal” and “PTSD alteration.” The most probable direct cause for “negative control” might be “general anxiety” and “number events experienced.” It should be noted that high level statuses in these causal nodes can also be influenced by other nodes in the network, which might indirectly influence the symptoms under inquiry.
The posterior probability of causal nodes (purple-colored nodes) when the evidence variables “Anhedonic depression” and “Negative control” (gray-colored nodes) is set to be “high” state.
Most probable configuration
Using the annealed MAP algorithm, we estimated MAP. It explicitly shows, in terms of posterior probability, the most probable explanation and causal inference about the set of variables that is most likely to lead to the result. For example, when we input the evidence to be “high” for all four measures of social adversity variables, Table 1(a) shows the most likely state of mood and anxiety symptoms, and Table 1(b) shows the most likely state of PTSD symptoms of alteration, arousal, intrusion, and avoidance. The findings indicated that when individuals experienced high levels of social adversity with respect to total number, chronicity, traumaticity, and distress, the likelihood for these individuals to expose to high level of one of the symptoms was quite high, changing from 43% to 79%.
Most likely configuration of symptom state given the state of evidence variables.

Discussion
The primary purpose of the current study was to assess how daily social adversity events and individual perceptions of these events interact with posttraumatic stress symptoms and mood and anxiety disorder symptoms. More specifically, we focused on number of the regular social adversity events experienced and how individuals perceived them with respect to their chronicity, traumaticity, and distressing level. Although these adversity events are not clinically considered as traumatic by the DSM-V, a growing body of research indicates the importance of accounting for cumulative effects of experiences (e.g. Contractor et al., 2018). Consequently, we should take into account one’s cumulative adversity experience history; the multiple adversity events may result in equivalent degree of distress as traumatic events, particularly when these events are perceived as traumatic and frequent.
Using Bayesian network analysis, the results suggested that the variable of “number of adversity events perceived as traumatic” seemed to be a common sensitive factor across all target nodes, although we did not display these results within the graph. The findings from posterior probability reasoning indicated that when the level of state was set to be high on the variable “number of adversity events perceived as traumatic,” the posterior probability of high level of symptoms of posttraumatic stress and mood and anxiety increased. The findings may suggest that an individual’s perception of social adversity experienced as traumatic may be more important than actual events in impacting individual’s psychological functioning and reactions.
The findings of our study seem to be consistent with the theory of capture. According to this theory (Kessler, 2015), social adversity events can narrow our attention and affect the way we feel and act. Our findings indicate that as individuals experienced more adversity events, they tended to perceive them as traumatic, frequent, and distressing, which in turn increased the likelihood for them to report high level of symptoms related to posttraumatic stress and mood and anxiety. In general, our findings suggest that we should not overlook or neglect the effects of these so-called regular stress experiences on individuals’ emotions and behaviors. One key difference between the current study and previous studies on trauma (e.g. Green, 1996; Holmes and Johnson, 2019; McIlveen et al., 2019) is that we focus on adversity events that seem to be less intense in comparison to trauma such as abuse or violence. However, the significance of the current study is that we provide the empirical evidence about the association between these adversity events and posttraumatic stress symptoms in addition to mood and anxiety symptoms, whether we would consider these events to be potentially traumatic or not. This work extends the literature by emphasizing the importance of social adversities as perceived traumatic events worth consideration in trauma psychology research.
Limitations
Bayesian network analysis is a graphic model based on both probability theory and graphic theory. As a graphic model, the results are mostly shown in graphic forms rather than numerical numbers in tables. Since the Bayesian network provides a complex network of dependencies among variables under study, it is not feasible to present scenarios of each dependency relationships, so we only presented one or two examples of such scenario in the current study. In addition, the current Bayesian network can only be viewed as a best solution given the estimation algorithm used in the analysis. Thus, the study findings must be viewed in light of this circumstance, although it is not a limitation per se. There are other limitations that should be considered in interpreting the findings. First, the study implemented a cross-sectional design. The temporal order or causal relationships of social adversity experiences and psychological distress cannot be definitely determined, although Bayesian network model is theoretically grounded in casual inferences (Pearl, 2000). In this study, the instrument of perceived chronic social adversity scale includes 30 events we deemed typical in daily social life. However, there may be other events we did not include. Second, the data for the study utilize a community sample from China, which may reduce the generalizability of the findings across different cultures. Further research in different cultural contexts would help to explain the proposed mechanism of subjective social trauma in developing or maintaining trauma-related symptoms. Third, the Bayesian network is used in an exploratory way based on the machine learning algorithm in the current study. It helps us to gain some insight into how study variables form a complex network; however, there is a need to further replicate the mechanism of such relationships using different samples.
In conclusion, the results of the study suggest that psychological distress may have its roots in our regular daily social interactions. The stresses caused by our daily social encounters could be perceived as traumatic. This type of subjective trauma does not render the traditional construct of PTSD meaningless. Instead, we suggest that daily social adversity events could have traumatic effects, and we should explicitly acknowledge its impact on our well-being rather than consider it merely as “normal” stressors.
Supplemental Material
Supplement-Appendix_A-PCSA-R – Supplemental material for Understanding social adversity and stress and mood symptoms: The Bayesian network approach
Supplemental material, Supplement-Appendix_A-PCSA-R for Understanding social adversity and stress and mood symptoms: The Bayesian network approach by Cody Ding in Journal of Health Psychology
Footnotes
Acknowledgements
I would like to thank Ms Yang Zhang for allowing me to use the data for the current study.
Data sharing statement
The data used in this study do not contain any individual identification information. Data include 12 psychological variables used in the analyses. A document describing these 12 variables and their measurement was included as part of data sharing files. The data will be available in Figshare and as Supplemental Material on the SAGE journal platform. Data analyses were conducted based on the procedures described above.
Declaration of conflicting interests
The author declared no potential conflicts of interest with respect to the research, authorship, and/or publication of this article.
Funding
The author received no financial support for the research, authorship, and/or publication of this article.
Supplemental material
Supplemental material for this article is available online.
References
Supplementary Material
Please find the following supplemental material available below.
For Open Access articles published under a Creative Commons License, all supplemental material carries the same license as the article it is associated with.
For non-Open Access articles published, all supplemental material carries a non-exclusive license, and permission requests for re-use of supplemental material or any part of supplemental material shall be sent directly to the copyright owner as specified in the copyright notice associated with the article.