



Abstract
Although medical mistrust (MM) may be an impediment to public health interventions, no MM scale has been validated across countries and the assessment of MM has not been explored using item response theory, which allows generalisation beyond the sampled data. We aimed to determine the dimensionality of a brief MM measure across four countries through Mokken analysis and Graded Response Modelling. Analysis of 1468 participants from UK (n = 1179), Ireland (n = 191), India (n = 49) and Malaysia (n = 49) demonstrated that MM items formed a hierarchical, unidimensional measure, which is very informative about high levels of MM. Possible item reduction and scoring changes were also demonstrated. This study demonstrates that this brief MM measure is suitable for international studies as it is unidimensional across countries, cross cultural, and shows that minor adjustments will not impact on the assessment of MM when using these items.
Introduction
Medical mistrust (MM) is a tendency to distrust medical systems and personnel believed to represent the dominant culture in a society. Medical ‘distrust’ and ‘mistrust’ are different terms, but sometimes are used interchangeably in literature – ‘distrust’ is most correctly based on a specific experience or information, whereas, ‘mistrust’ expresses a general sense of unease towards someone or something (Smirnoff et al., 2018). MM is an active response to direct or vicarious experiences of marginalisation or poor experiences, including medical error (Williams and Mohammed, 2009). For example, having a higher mistrust, a person receiving a cancer diagnosis may doubt the doctor’s advice and seek a second opinion(Guadagnolo et al., 2009), or a family member with high mistrust may be less likely to consent to organ donation when it is raised (Morgan et al., 2008a), or a person with high mistrust may be less likely to seek medical attention when experiencing symptoms that they can’t explain (Taber et al., 2015).
MM is often context specific and has significant negative public health implications, like lower adherence to cancer screening guidelines (Adams et al., 2017), lower adherence to antiretroviral medication among men with HIV (Galvan et al., 2017), poor patient-provider relationships (Saunders, 2017), engaging in risky behaviours (Hardin et al., 2018), conspiracy theories (Quinn et al., 2018), and lower use of vaccinations (Benkert et al., 2019; Larson et al., 2018), and even the recent resurgence of anti-vaccination movement in Western countries (Hussain et al., 2018; Opel et al., 2021).
Practicing organ donation has proven to be lifesaving, but mistrust in the healthcare system is associated with reduced intentions for organ donation (Miller et al., 2019; Russell et al., 2012). In the US alone, 64.02% of candidates failed to receive a transplant in 2020 (Goff et al., 2021), highlighting the importance of appropriate assessment of MM
However, few studies have attempted an in-depth exploration of the assessment of MM. In a recent systematic review (Ozawa and Sripad, 2013), around 20% studies used measures with 2–3 items or single item, such as ‘It is difficult for me to trust doctors and other health professionals’ (Williamson and Bigman, 2018). Commonly-used, multi-item scale measures include: the 12-item Group-Based Medical Mistrust Scale (Thompson et al., 2004), which was developed to measure race-based medical mistrust; the 7-item Medical Mistrust Index (Sheppard et al., 2019), which assesses the association between mistrust and five measures of underuse of health services; and the 10-item Health Care System Distrust Scale (Rose et al., 2004).
Previous psychometric work has identified three subscales within the Group-based Medical Mistrust Scale: (1) Lack of Support from doctors and health care workers; (2) Discrimination and group disparities in health care; and (3) Suspicion of doctors, health care workers and medicine (Shelton et al., 2010). There are important differences among these scales with regards to the object of mistrust (e.g. system, individual physician), referent specificity (e.g. group), health topic, and sample population in which they were developed, with around 88% being US-based. In addition, most were not used internationally nor validated across countries (Williamson and Bigman, 2018) though research shows that mistrust varies by ethnicity and within countries (Henrich et al., 2010). To establish psychometric validity, the Medical Mistrust Index and the Health Care System Distrust Scale relied on Classical Test Theory (CTT) parameters (DeVellis, 2006), reporting Cronbach’s alpha reliability for scale performance, without first adopting the recommended factor analytic techniques to establish dimensionality (Crutzen and Peters, 2017). In addition, while the Group-Based Medical Mistrust Scale used exploratory factor analysis (Gaskin and Happell, 2014), and structural equation modelling (SEM) (Tarka, 2018) in its development process, these methods can be criticised for being sample-dependent (Hays et al., 2000) – so it is unknown if the findings generalise across countries and cultures. To overcome limitations such as these, a psychometric technique increasingly used is the Item Response Theory (IRT) approach – a family of mathematical models that attempt to explain the relationship between latent traits (unobservable characteristic or attribute) and their manifestations (i.e. observed outcomes, responses or performance) (Hays et al., 2000). IRT has several advantages over CTT, including that rather than looking at the reliability of the test as a whole, IRT looks at each item individually. IRT suggests that a respondent’s latent trait is independent from the item or question on a test (Jabrayilov et al., 2016). It produces person-parameter invariance (i.e. test scores are not dependent on the particular choice of test items) when the model fit is present, while test information functions provide the amount of information or ‘measurement precision’ captured by the test on the scale measuring the construct of interest (Petrillo et al., 2015). IRT can, therefore, provide information for scale development and scoring that is not sample-dependent, is generalisable across cultures, countries and contexts that is not readily available via CTT methods, and arguably robust psychometric scale evaluation is incomplete without such assessments. Individuals might have different opinions about MM, but IRT methodology ensures that the results do not vary with population characteristics (Hambleton, 2004). Rasch analysis is a special case of IRT, which requires the data to fit the model in order to generate invariant, interval-level measures of items and persons, but is prescriptive by nature and assumes that each item has the same discrimination level (Boone et al., 2014). Rasch analysis was used to determine the validity of an instrument for measuring patients’ trust in medical technology (Montague, 2010), but to date, no studies have assessed MM using more flexible and powerful IRT analyses.
To summarise, there is limited psychometric evaluation of MM scales, including a lack of exploration across countries and cultures which limits comparability and generalisability, and no study to date has investigated MM using IRT. In addition, with challenges such as the current global threat of the anti-vaccination movement and the need for organs for transplant, robust measures are urgently needed to better understand potential contributors to MM. We therefore aimed to fill this gap in the literature, by analysing MM items that were previously developed by Morgan et al. (2008b) and used in several studies of MM in the context of attitudes to organ donation (Doherty et al., 2017; Doyle et al., 2019; O’Carroll et al., 2016). Specifically, we applied nonparametric and parametric IRT to investigate the dimensionality of MM across four countries. We explored whether the MM latent trait is adequately assessed by the MM items developed by Morgan et al. and investigated the MM items and the scoring of these items, with a view to determining whether item reduction or scoring changes would impact on MM assessment.
Methods
Participants and procedure
We used combined data from four randomised experiments on attitudes to organ donation, for secondary analysis of medical mistrust (Doherty et al., 2017; Doyle et al., 2019; O’Carroll et al., 2016). In brief, these studies ascertained the effects of affective attitudinal items on intention and registration for organ donation. The sample consisted of participating adults recruited from the community, shopping centres, libraries, campuses, and online from four countries — United Kingdom (313 in-person, 616 online, 864 postal), Ireland (586), Malaysia (148) and India (175). All procedures performed in studies involving human participants were in accordance with the ethical standards of the institutional and/or national research committee and with the 1964 Helsinki Declaration and its later amendments or comparable ethical standards. The protocol was approved by the Research Ethics Committees (RECs) in each site (RCSI Dublin REC1048bb; UK – Stirling University General University Ethics Panel [No. 188]; Malaysia, RCSI PU REC – PUIRBH0097; India – Kasturba Hospital Institutional Ethics Committee IEC 134/2017).
Measures
As part of the above studies, participants completed 4 items measuring medical mistrust, adapted from Morgan et al. (2008b). Items were rated on a 7-point scale (1 = strongly disagree; 7 = strongly agree) and evidenced good reliability (α = 0.84). Items included were as follows: MM1: ‘Hospitals sometimes prescribe medication as a way of experimenting on people without their knowledge or consent’; MM2: ‘If I sign an organ donor card, doctors might take my organs before I’m actually dead’; MM3’Sometimes, medical procedures are done on people without their consent’; and MM4: ‘If I sign an organ donor card, doctors might not try so hard to save my life’.
Statistics
We used non-parametric and parametric Item Response Theory (IRT) analysis. Mokken scaling is a non-parametric, iterative scale-building technique, especially suitable for skewed and polytomous items (van Schuur, 2003), which is ideal for establishing unidimensionality (Dima, 2018). Mokken scaling is a stochastic extension of Guttman scales (Rothman, 2004), which are unidimensional, ordinal scales of binary items along a continuum. A positive answer to one item of a certain ‘difficulty’ indicates that all other items of lesser difficulty have also been answered positively. Mokken scaling facilitates analyses of polytomous items with probabilistic ordering. Mokken scaling has several advantages over the typically adopted factor analytic techniques: it is suitable for binary or highly skewed polytomous items, it can be used in relatively small samples (n = 300–400), and it systematically orders items (Watson et al., 2012). Loevinger’s H-coefficient is used for interpretation. According to (Sijtsma and Molenaar, 2011), 0.3 ⩾ H < 0.4, 0.4 ⩾ H < 0.5, and H ⩾ 0.5 indicate weak, moderate and strong scales, respectively. Higher H values indicate higher item discrimination power, and thus more confidence in the ordering of respondents. Although this project is a secondary analysis, so sample size was not considered a priori, the total sample size far exceeds the required estimates to establish scalability (Watson et al., 2018), and therefore was used to assess the unidimensionality assumption of parametric IRT employed in the next steps of validation. Mokken scaling is an established method for IRT analysis with wide application in the social sciences. It provides psychometricians with an additional tool in the development of questionnaires and in the study of individuals and their responses to latent traits (Watson et al., 2012).
Model fit for parametric IRT (see Appendix) was considered using the likelihood ratio test of Akaike and Bayesian information criteria (Swaminathan et al., 2006), which indicated that the unconstrained Graded Response Model (GRM) was most appropriate. The IRT GRM approach constructs a nonlinear relationship between latent traits and item responses (Samejima, 1997). The GRM is especially suited to ordinal response items, as it does not assume that each item discriminates equivalently along with the latent trait (unlike Rash models) (Pallant and Tennant, 2007). The GRM characterises item functioning via two types of item parameters for each item: the item discrimination and item difficulty parameters. We report test-level and item-level parameters. The test information function, a function of the true score theta (θ, in this case, MM), is a measure of the amount of information provided by the item responses about MM. The test characteristic curve is the functional relation between the true score and the trait scale. Item Characteristic Curve shows the behaviour of individual items on a scale relative to the latent trait. Steeper curves indicate higher discrimination. Item information function is a measure of how much statistical information a test item provides. Item information is a function of MM. Category characteristic curves were used for the polytomous response categories of MM items. Each CCC depicts the probability of endorsing a single response category (Fayers, 2004; Ockey, 2012; Reckase, 2009).
Mokken scale analysis was conducted using a procedure written for StataCorp(2019), by Hardouin (2004), GRM IRT was conducted in Stata SE 15 (StataCorp, 2017). Other analyses were done in RStudio Version 1.3.959 (The R Foundation, 2018), using the procedure described by Ark(2007).
Results
Sample profile
The baseline profile of the larger samples has been described in detail elsewhere (Doherty et al., 2017; Doyle et al., 2019; O’Carroll et al., 2016). The mean age for the total sample (n = 2702) was 42.3 years (SD = 16.9), with 58% being women. The number of subjects who completed all MM items was 1468 (54% response rate; due to the differing exposures across the experimental groups) (mean age = 44 years, 60% were women). The details of responses as obtained from four countries were: United Kingdom (107 in-person (mean age = 46 years, 42% were women), 211 online (mean age = 51 years, 51% were women), 861 postal (mean age = 45 years, 66% were women)), Ireland (191; (mean age = 37 years, 48% were women), Malaysia (49; mean age = 19 years, 55% were women) and India (49; mean age = 24 years, 81% were women).
Mokken scaling results
The overall scale H score of 0.51 (for individual items = 0.47–0.54) indicates a ‘strong’ scale, showing that all items in this scale tapped a hierarchical, unidimensional variable of medical mistrust measure (Table 1). We also found unidimensionality for each country (Ireland: H = 0.51, UK (in person): H = 0.53 UK (online): H = 0.61, UK (postal): H = 0.54, Malaysia: H = 0.56, India: H = 0.48 (three items). It should be noted that one item was dropped from the analysis for India because the item was not selected by the Mokken scaling procedure as it did not discriminate along the latent trait: ‘If I sign an organ donor card, doctors might not try so hard to save my life’.
Mokken scaling results for total sample.

Graded response model results
Test level parameters
The Test Information Function for the overall assessment of the MM latent trait is shown in Figure 1a. Most information is provided at mid-higher levels of the latent trait, but very little about lower levels of MM. As shown in Figure 1b, the Test Characteristic Curve, there was a substantial spread of scores evident, as here we expect 95% of people to score between 5 and 23.

Test level information. (a) Test information function. (b) Test characteristic curve.
Item level parameters
The Item Information Curves (Figure 2a) show how well and precisely each item measures the latent trait at various levels of the attribute. Items 1 and 3 provide more information at low levels of the trait (MM) and across a broader range of scores, while items 2 and 4, which specifically refer to organ donation, provide more information overall. As shown in the Item Characteristic Curve (Figure 2b), items 2 and 4, which concern mistrust in doctors, show significantly higher levels of discrimination (95% CIs do not overlap), with the discrimination indices available in Table 2. Also clearly indicated is that the discrimination parameters for scores of 3 and 4 within individual items lie very close together, suggesting that, if necessary, these could be combined to form an overall 1–6 scoring range without losing much information (Also see correlation matrix in Appendix).
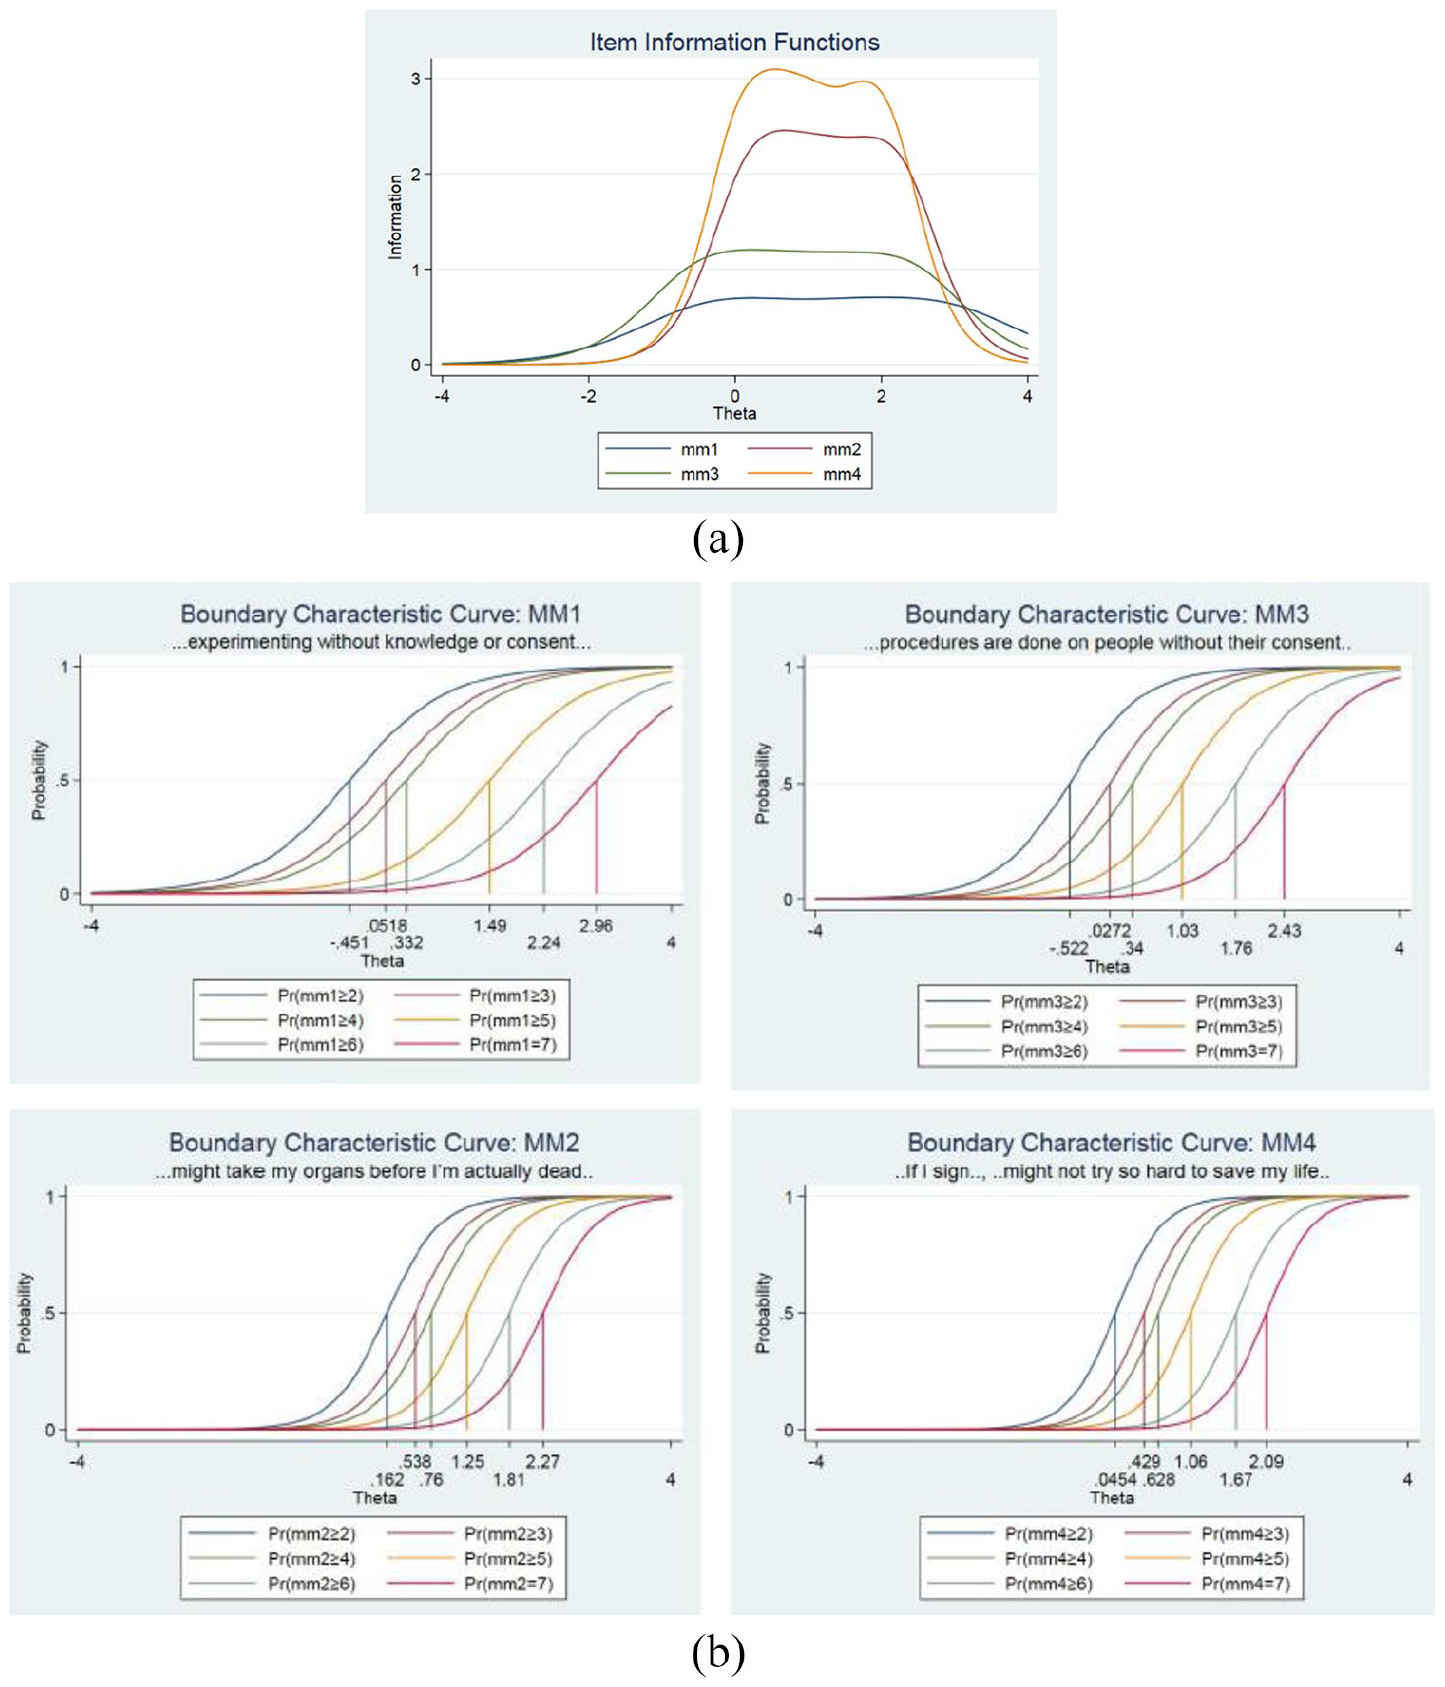
Item level information. (a) Item information curves. (b) Item characteristic curve for each of the four items.
Item discrimination scores.

Category characteristic curves for MM items (Figure 3) represents the probability that a respondent will select a response option, given the respondent’s latent trait (MM) value. It displays the probability of a person endorsing a particular response category based on their level of support for the item and the intensity or difficulty of the item. The range of latent trait (MM) value is plotted along the x-axis. The probability of selecting each category is plotted along the y-axis. An item is better at discriminating between individuals when the curves are peaked and dispersed across all levels of the latent trait. For example, an item with high discrimination would have seven peaks dispersed from low levels of the latent trait to high levels of the latent trait. Here, there is an overall well-spaced response category across MM1-4, with MM4 having well dispersed peak signifying better discrimination between individual scourings.
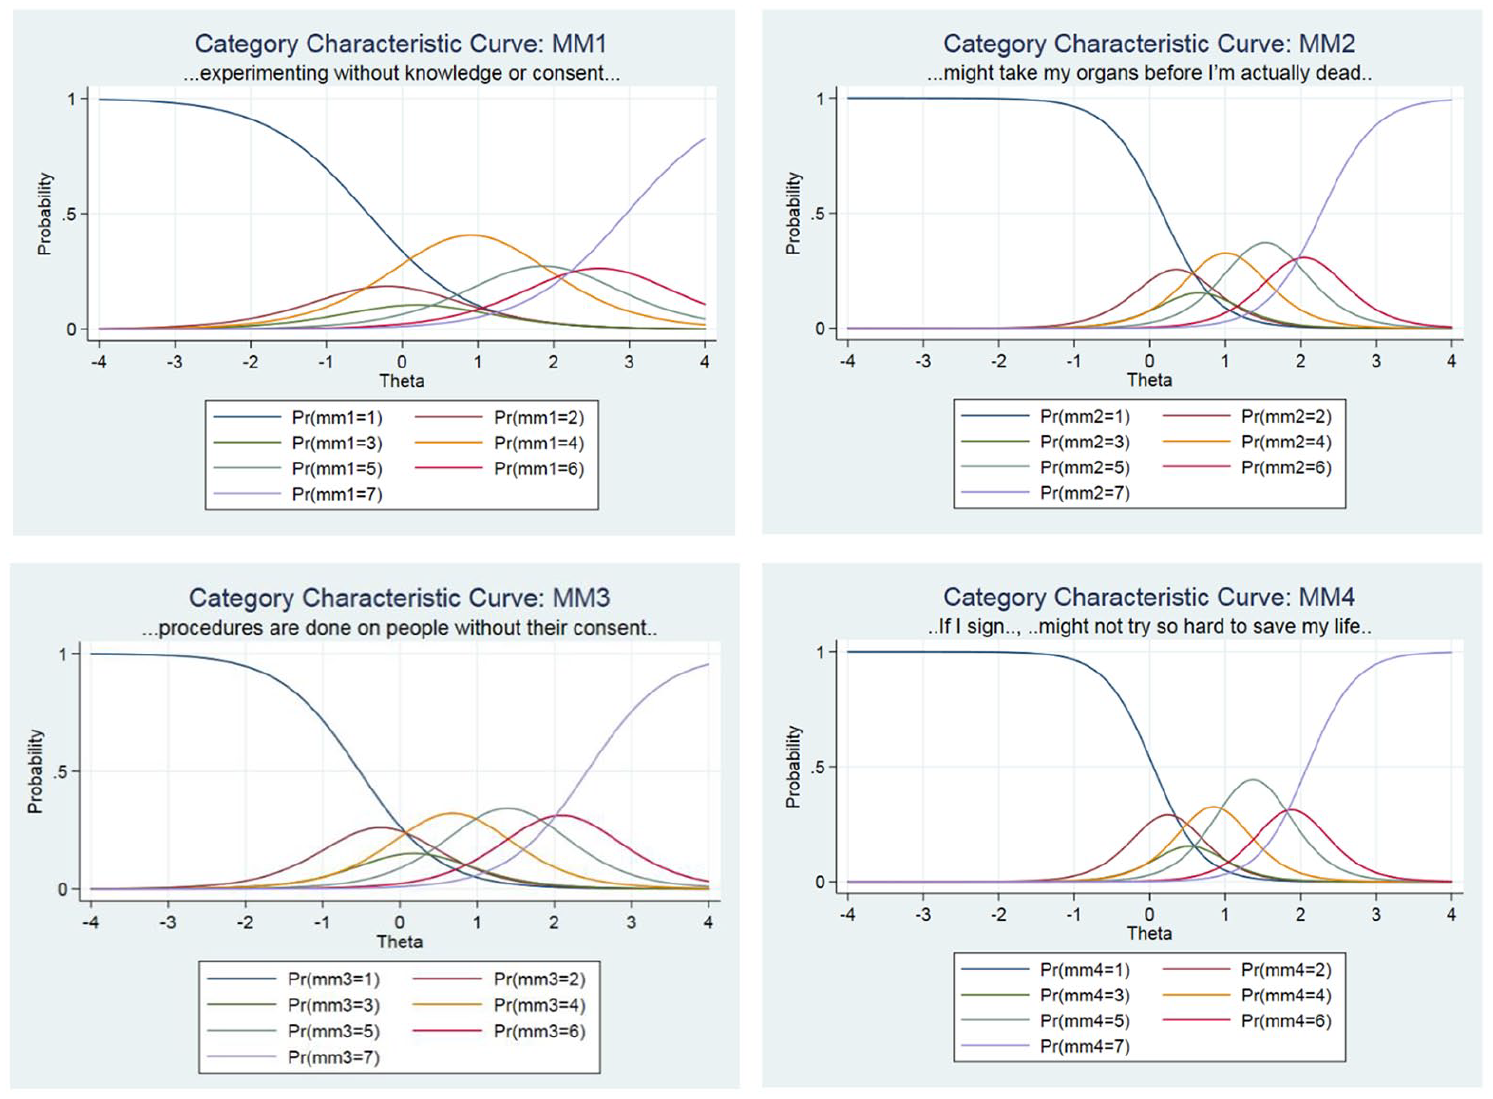
Category characteristic curves (CCCs) for each of the four items.
Discussion
To our knowledge, this is the first study to apply flexible IRT analyses to the measurement of MM, which highlights a robust measure that is generalisable across cultures and countries that is preferable to scales developed in single-country settings. Although the items here relate to organ donation, and the test has implications for the organ donation context, the test is measuring something more than just attitudes towards organ donation, but towards medical professionals and medical treatment in general. We used Mokken scaling to demonstrate that the 4 MM items developed by Morgan et al. (2008b) formed a unidimensional scale across four countries. The parametric IRT GRM approach demonstrated that the measure assesses medium to higher levels of MM very well, but unsurprisingly provides less information at lower levels of MM. Furthermore, it was clear that items relating to doctors are significantly more highly discriminating MM than other items, which is a novel addition to the literature.
Our results support the original findings of Morgan et al. (2008b), who used structural equation modelling on data from 4426 participants at six different geographic locations in the United States, and showed that MM was a unidimensional scale and one of the most influential noncognitive beliefs of an individual having a direct influence on organ donor card status. In addition, IRT analysis has enhanced the validity of the scale across four different countries and cultures and has highlighted unique aspects of overall scale and item level parameters. Incidentally, the scale with four items did not show validity for India, and one item (‘If I sign an organ donor card, doctors might not try so hard to save my life’) had to be dropped. This is probably due to lower sample size in this population, which does not meet the criteria for obtaining a valid overall scale H-value (Watson et al., 2012). It could also be due to high level of awareness of organ donation protocols in the same geographical region as has been shown in a study by Mithra et al. (2013), potentially introducing nonresponse bias (Sax et al., 2003), or due to high proportion of women responders as Data from the National Organ Transplantation and Tissue Organisation show that majority of living donations in India are from women and majority of organ recipients are men (Donation and Transplantation of Human Organs and Tissues, n.d.; Sahay, 2019 Further research is needed to explore this aspect in other parts of India as has been acknowledged elsewhere (Vincent et al., 2019).
The results of our IRT GRM-based analyses provide a closer look at the properties of the MM scale. The test and item information functions represent the precision with which a respondent’s MM value can be estimated. Higher information indicates greater precision. The Test Information Function revealed that the measure provides most information (estimation precision) at moderate/high levels of MM, but little information at low levels. Similarly, the Item Information Function curves showed that items 1 and 3 provided more information at low levels of MM, while items 2 and 4 provide more information at higher levels. These results suggest that, if it were necessary to shorten the scale (e.g. when competing with other measures in large population-based surveys), researchers could base their decision on whether discrimination or latent trait coverage were considered more advantageous, along with, of course, the content validity of the items. This has been done elsewhere, for example when measuring quality of life in breast cancer survivors (Xia et al., 2019). However, the final decision about the exclusion of items should be based on substantive reasons and not merely through the acceptance of quantitative values as candidate threshold levels, including theory and content validity. This is especially important as we may lose information about part of the measured domain that might be useful or important otherwise (Edelen and Reeve, 2007).
The properties of the scale are depicted through the Category characteristic curves, which shows overall well-spaced response categories across MM1-4. As shown in the item characteristic curves was that the discrimination parameters for scores of 3 and 4 lie close together, suggesting that these could be combined to form an overall 1–6 scoring range, without losing precision as has been shown elsewhere (Chen et al., 2009; Edelen and Reeve, 2007). However, caution should be used when making such decisions, as the trade-off for a reduced number of response options may lead to a decline in scale precision, particularly for respondents at extremes of the latent trait (Yang and Kao, 2014). Item reduction is a pragmatic choice in most cases and should be individualised to the study as has been explained elsewhere (Kolva et al., 2017).
In our findings, items which concerned mistrust in doctors showed significantly higher levels of discrimination than items which referred to more systemic aspects, such as hospitals and procedures. This is in contrast to other research, which shows that while distrust in the health care system is relatively high (20%–80% of respondents reporting distrust for each item on the Health Care System Distrust scale) (Rose et al., 2004), there is in contrast lower mistrust in one’s own primary care physician (only 10%–20% of respondents endorsing mistrust). This may be due to the wording of the items – the questions in our study concerned doctors in general, not specifically participants own doctors – future research could investigate the impact of such wording changes on this MM measure.
The MM measure provides a substantial amount of information about high levels mistrust, but little information around lower levels of the MM trait. We should not assume that low levels of MM correlates directly with higher levels of trust – these factors may be multidimensional, rather than unidimensional, as has been elucidated elsewhere (Goold, 2002; Pellowski et al., 2017; Sullivan, 2020). To explore trust, it may be necessary to employ another measure, perhaps also including reference to one’s own doctors rather than physicians in general, as outlined above. Trust is an important component of healthcare, and is elucidated as a set of expectations that the healthcare provider will do the best for the patient and has different meanings attached to it (Ozawa and Sripad, 2013). Thus, conducting cognitive interviews that focus on the wording or sense of these items may provide insight into respondents’ interpretations and responses. Future research could also explore newly written items to determine if they indicate discrimination at the lower levels of the MM trait. Also, of interest would be conducting interviews in local languages in non-English speaking countries (LoCurto and Berg, 2016), and potential use of this scale for predicting participation in any future (COVID-19) vaccination programmes (Palamenghi et al., 2020).
What does this study add?
This is the first study to use Mokken scaling and IRT GRM in exploring properties of MM. Across countries, MM was shown to be unidimensional, with higher discrimination and broader cover of the latent trait differentially demonstrated among individual items. It seems that MM for doctors is more discriminating factor than for systemic aspects on organ donation. The two general items (1 and 3) form a unidimensional scale with the two-organ donation specific items (2 and 4). Therefore, even though the latter items are specific to organ donation, the scale could be used in different contexts
Limitations and Strengths
This study was conducted in the context of organ donation (Doherty et al., 2017; Doyle et al., 2019; O’Carroll et al., 2016) using the IRT parameters, so that it should be generalisable beyond the sample in question (DeMars, 2011). Studies used brief questionnaire rather than interviews, a combination might provide more information as has been suggested elsewhere (Feveile et al., 2007). The inclusion criteria for the original studies were broad and the participants were sampled from the general population, increasing generalisability. While we are limited by a lack of data on ethnicity and small sample sizes from India and Malaysia, which limit sub-analyses (Şahin and Anıl, 2017), the overall sample size is adequate for the approaches taken and results should be generalisable beyond the samples obtained (Gregoire and Hambleton, 2004; Watson et al., 2018). In the included studies, it was seen that items regarding doctors are more highly discriminating in contrast to other studies and this needs to be understood in depth. Future research should concentrate on comprehensive multidimensional MM scales with bigger samples, and discrimination of MM between personalised and systemic aspects of healthcare system, for example the recent anti-vaccination movement (Hussain et al., 2018).
Conclusions
Four MM items formed a highly discriminating unidimensional scale across countries and measurement methods. An IRT GRM model showed that the measure captured moderate-high levels of MM better than lower levels of MM, and that there was significantly higher item discrimination for items concerning doctors, rather than systemic items. This MM measure should have excellent generalisability across settings.
Supplemental Material
sj-pdf-1-hpq-10.1177_13591053211064985 – Supplemental material for Assessing medical mistrust in organ donation across countries using item response theory
Supplemental material, sj-pdf-1-hpq-10.1177_13591053211064985 for Assessing medical mistrust in organ donation across countries using item response theory by Arunangshu Ghoshal, Ronan E O’Carroll, Eamonn Ferguson, Lee Shepherd, Sally Doherty, Mary Mathew, Karen Morgan and Frank Doyle in Journal of Health Psychology
Supplemental Material
sj-R-2-hpq-10.1177_13591053211064985 – Supplemental material for Assessing medical mistrust in organ donation across countries using item response theory
Supplemental material, sj-R-2-hpq-10.1177_13591053211064985 for Assessing medical mistrust in organ donation across countries using item response theory by Arunangshu Ghoshal, Ronan E O’Carroll, Eamonn Ferguson, Lee Shepherd, Sally Doherty, Mary Mathew, Karen Morgan and Frank Doyle in Journal of Health Psychology
Research Data
sj-xls-3-hpq-10.1177_13591053211064985 – Supplemental material for Assessing medical mistrust in organ donation across countries using item response theory
Supplemental material, sj-xls-3-hpq-10.1177_13591053211064985 for Assessing medical mistrust in organ donation across countries using item response theory by Arunangshu Ghoshal, Ronan E O’Carroll, Eamonn Ferguson, Lee Shepherd, Sally Doherty, Mary Mathew, Karen Morgan and Frank Doyle in Journal of Health Psychology
Footnotes
Appendix
1. The model fit statistics (Akaike information criterion (AIC) /Bayesian information criteria (BIC)) for IRT models were as follows (the lowest scores indicate the best fit): Nominal response model 16945.98, 17200.21 Partial credit model 17095.25,17227.66 Rating scale model 17194.33,17247.29 Graded response model 16857.49,17005.79
2. The graded response model can be summarized by the equation
Where:
3. Correlation matrix of medical mistrust items
Acknowledgements
The authors acknowledge the assistance of the following for data collection and other assistance: Amanda Villiers-Tuthill, Rishalan A/L Kobu, Jayakiran A/L Radhakrishnan, Nurul Farhana Binti Baharudin, Mehala Balasubramaniam, Deirdre Arthur, Abdullah Haidar, Talal Al Hassan, Anna Bennett, Princy Palatty, Prashanti Kamat, Jody Quigley, Josh Henderson.
Authors’ contribution statements
(1) Made substantial contributions to the conception or design of the work; or the acquisition, analysis or interpretation of data; or the creation of new software used in the work: AG, REOC, SD, MM, KM, FD
(2) Drafted the work or revised it critically for important intellectual content: AG, FD
(3) Approved the version to be published: Arunangshu Ghoshal (AG), Ronan E. O’Carroll (REOC), Eamonn Ferguson (EF), Lee Shepherd (LS), Sally Doherty (SD), Mary Mathew (MM), Karen Morgan (KM), Frank Doyle (FD)
(4) Agree to be accountable for all aspects of the work in ensuring that questions related to the accuracy or integrity of any part of the work are appropriately investigated and resolved: AG, FD
Data sharing statement
The current article includes the complete raw dataset collected in the study including the participants’ dataset, syntax file and log files for analysis. These files are all available in the Figshare repository and as Supplemental Material via the SAGE Journals platform.
Declaration of conflicting interests
The authors declared no potential conflicts of interest with respect to the research, authorship and/or publication of this article.
Funding
The authors disclosed receipt of the following financial support for the research, authorship and/or publication of this article: This research was supported by The Scottish Government Chief Scientist’s Office (Ref. CZH/4/686), RCSI Research Summer School and the RCSI Student Selected Component, who had no role in recruitment, data analysis or interpretation.
Research involving human participants and/or animals
All procedures performed in studies involving human participants were in accordance with the ethical standards of the institutional and/or national research committee and with the 1964 Helsinki Declaration and its later amendments or comparable ethical standards. The protocol was approved by the Research Ethics Committees (RECs) in each site (RCSI Dublin REC1048bb; UK – Stirling University General University Ethics Panel [No. 188]; Malaysia, RCSI PU REC – PUIRBH0097; India – Kasturba Hospital Institutional Ethics Committee IEC 134/2017).
Informed consent
Informed consent was obtained from all individual participants included in the study.

References
Supplementary Material
Please find the following supplemental material available below.
For Open Access articles published under a Creative Commons License, all supplemental material carries the same license as the article it is associated with.
For non-Open Access articles published, all supplemental material carries a non-exclusive license, and permission requests for re-use of supplemental material or any part of supplemental material shall be sent directly to the copyright owner as specified in the copyright notice associated with the article.
